Master Of Misdirection
I like to say, “a magician doesn’t need new tricks, they need a new audience.”
A great magician is a master of misdirection. If they want to wow the crowd, they need to catch them off guard.
The crowd knows it’s coming, but they are still amazed every time.
“I must know how that trick was done!”
We’ve all felt that, but only a few dig deep enough to try to find out.
Once you do dig through, it changes you forever… You can’t unlearn it.
Solutions reveal themselves as logical. It’s often a subtle misdirection: a way to divert your attention away from where the real trick takes place… out of sight.
The best tricks come from a master of misdirection.
Those who follow us know that the Big Money leaves clues for what’s ahead.
The Big Money wins at the market by sniffing out the sleight of hand.
For those who don’t follow us, just know that Mr. Market is a master of misdirection. We’ve seen extremes unlike anything we’ve ever recorded. The meltdown in March was the fastest in history.
The rip higher that followed, mesmerized the crowd.
But magic in markets isn’t designed to titillate. It’s more like dark magic. Big Money wins biggest when main street loses.

Big Buying In Stocks Disappearing Act
Eventually all epic rallies slow down. Buyers vanish. It’s the great disappearing act we’ve seen countless times.
For two weeks, we’ve pointed to changes in our data. In our post, Initial Descent, we showed how Big Money buying in stocks was slowing.
That’s step one before we pullback.
In fact, the past 11 weeks have shown more buyers than sellers. But, that changed yesterday.
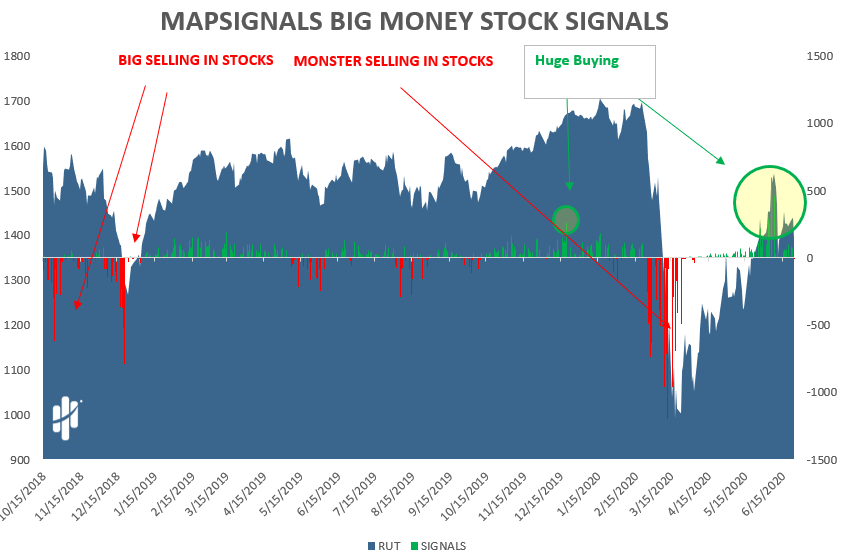
Below is our Big Money Stock Signals Chart. It’s a net of buyers and sellers each day. If the bar is green, there were more buyers. A red bar means more sellers.
Check out the huge buying the last couple of weeks. That’s the big circle off to the right. We’ve never recorded levels this high:
Now, let’s zoom in on what’s important. After 55 days of green bars, the first red bar came this morning. It’s so tiny – click the image to zoom in.
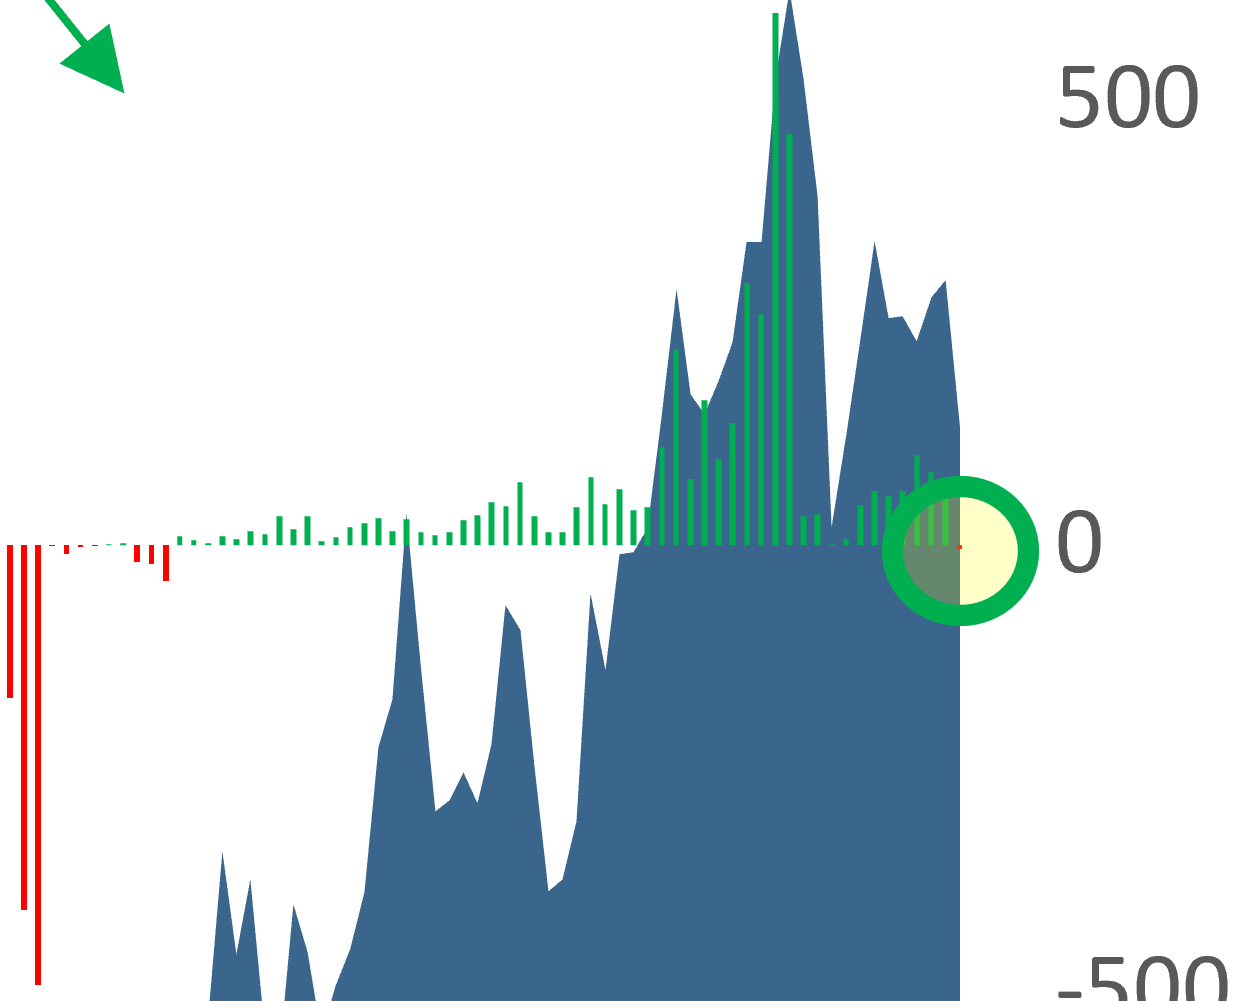
This is important because often, what happens under the surface prefaces what’s to come.
Magicians sometimes have a disappearing act. But you can’t vanish without diverting everyone’s attention.
Market rallies vanish eventually too. Markets are masters of misdirection – like when indexes rise while buy signals vanish.
Velocity Of Buying In Stocks Is Vanishing
We had record breaking buying in stocks a few short weeks ago. We highlighted that in, Record Breakers.
Typically, when we see insane buying, peaks are near. As you’ll see, our data paints a clear picture that buying is slowing down on a weekly basis.
When buying slows and selling grows, then markets begin to pullback.
Mapsignals readers now know how the Market-Magician is trying to misdirect us. That means we won’t get caught off guard.
The following charts are from our last 3 weekly MAP View reports. You can learn more about this awesome report here. In it, we summarize total buys and sells in stocks for each week and display that information by market cap.
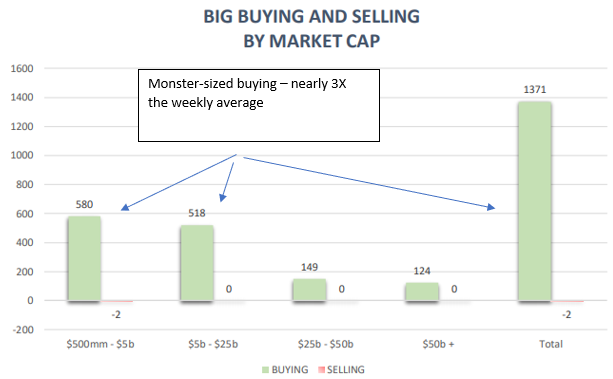
This is from the June 1 – 5 (the week of our record breakers post). This is what insane buying looks like:
Now check out June 8 – 12 (the week of our initial descent post). Total buy signals slowed dramatically:
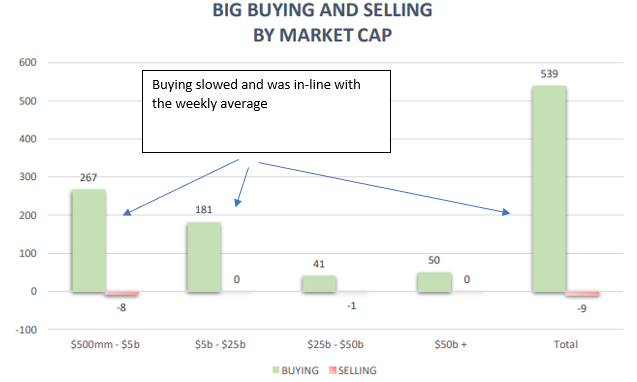
Let’s drive home the point one more time. Here are weekly signals from last week June 15 – 19 (the week of our when the tide goes out post):
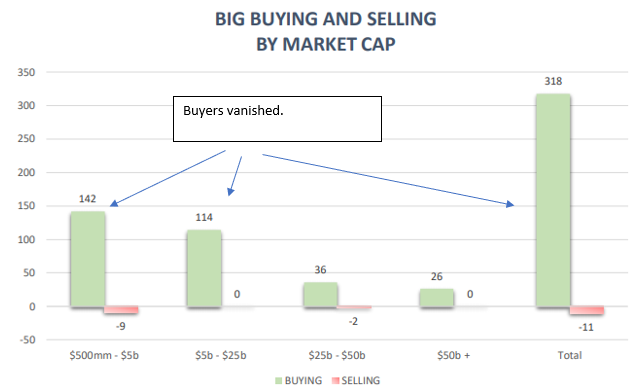
Buys fell from 1371 to 318 in that time period. That’s a 77% drop while indexes chugged higher. Now you can see the vanishing of buy signals. We’re sure many investors were misdirected.
When the market’s misdirection works perfectly, indexes don’t show what’s happening under the surface. They were heading higher, but our data was showing a clear divergence.
So, what comes next?
Selling In Stocks Will Increase
As we’ve said before, money flows in phases. Since late March, we’ve been in a buyers only market. This is phase 1 in the chart below:
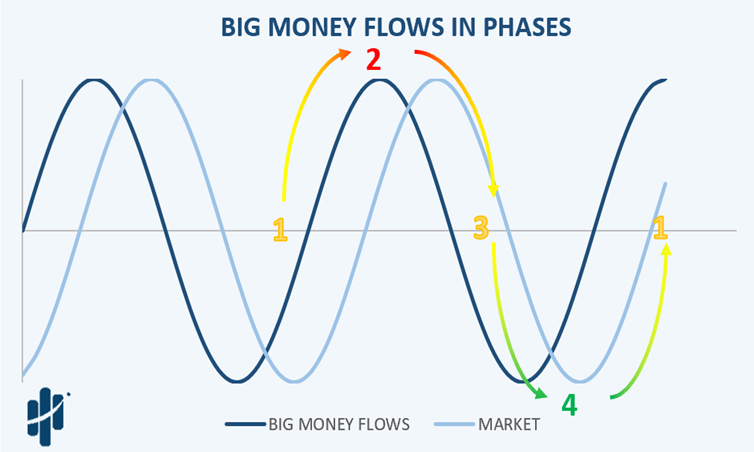
The slowing of buying that we’ve pointed to the last few weeks is approaching phase 2. This is when buying demand is met with more selling. It’s usually near a peak.
The phases work like this:
- Huge buying and very little selling – (think FOMO)
- Buying slows and selling picks up – (usually near a peak)
- Buying slows further and selling begins to take over – (a pullback has begun)
- Buying is gone, and sellers are in control – (think bear markets and scary headlines)
Phase 3 looks to be here.
Bottom line: we’re expecting lower market prices ahead. The vanishing act of buyers is happening.
Don’t get caught off guard.
Those who know how the trick is done marvel at it. They nod knowingly while others get duped. We’re market-magic experts here. So, we see this as good news. Lower prices = opportunity for the patient.
Use times like these to create a buy list of great stocks. If you need guidance on those- that’s our specialty. Find out more here.
The next time you see a magician, don’t focus where he or she wants you to look. Focus on what they are trying to hide.
It’s OK to lose innocence in magic shows, but it’s essential to lose innocence in investing.
The Market-Magician wants you to look at the indexes rising while the big buying exits stage left. That way he can sell to misdirected buyers.
But this time maybe you’ll watch with a smirk- now knowing how the trick is done.
But be careful- it changes you forever…