Volatility Crash
Stocks may have bottomed.
Capitulation appears long gone.
There’s a rare volatility crash signal also appearing.
Recapping tariff headlines is futile. One minute there’s no deal, then there’s a deal, and after that there’s another wrinkle to sort through.
Good luck connecting those dots.
A better use of time and effort is studying patterns of data.
Last week we debunked a popular bearish myth suggesting a death cross formation is somehow bad for stocks.
Then before that I offered 15 extreme charts for April 2025.
Both of those data-driven pieces signaled constructive views on equities.
If you’re still on the sidelines about whether or not to start adding to high-quality companies, today’s insights should finally settle the score.
Today, we’ll study powerful evidence that a volatility crash is yet another reason to buy the dip.
But first, let’s check in on the money flows landscape.
Equities are healing.
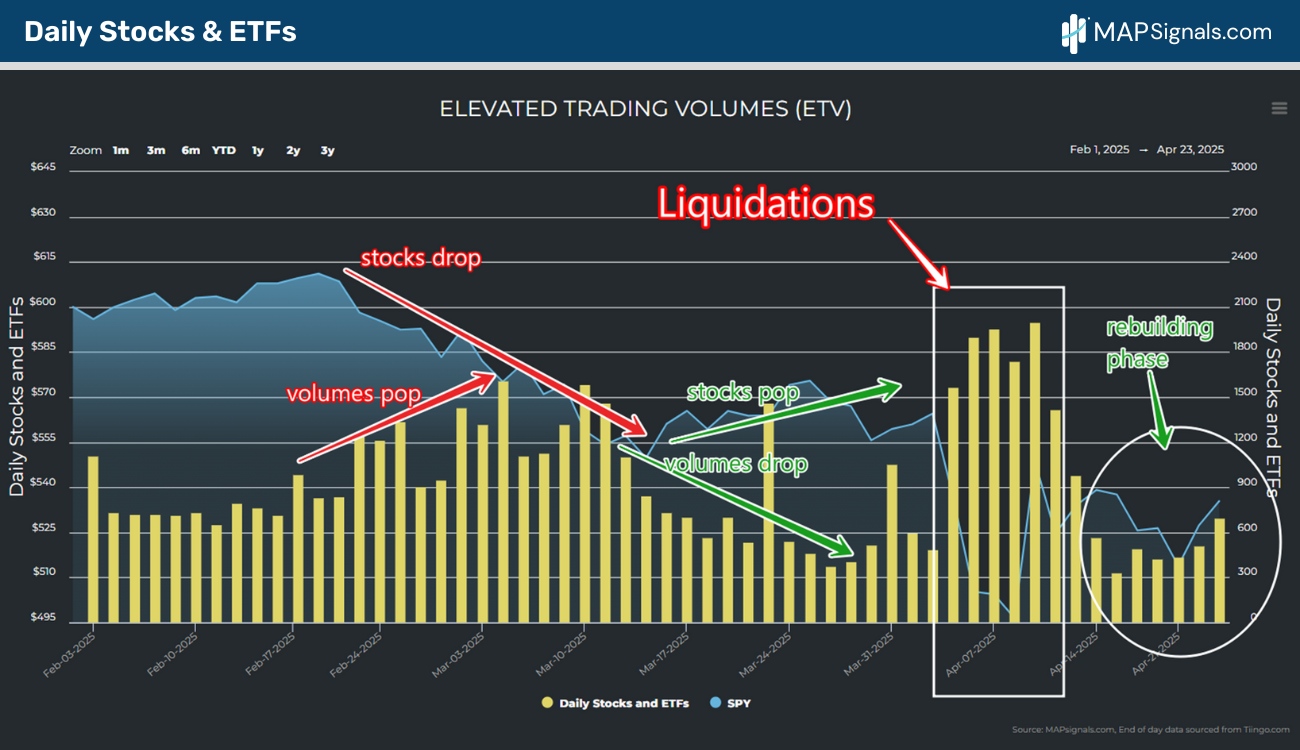
Stocks Rebuild as Liquidations Stop
Supply and demand is the key to equity prices.
Sitting on Wall Street trading desks, handling massive orders, taught us this.
MAPsignals can help you visualize why stocks have been gaining ground: Liquidations stopped.
Below is our proprietary chart of Elevated Trading Volumes (ETV) for U.S. stocks and ETFs. When volumes surge, stocks fall.
When liquidations stop, stops pop:
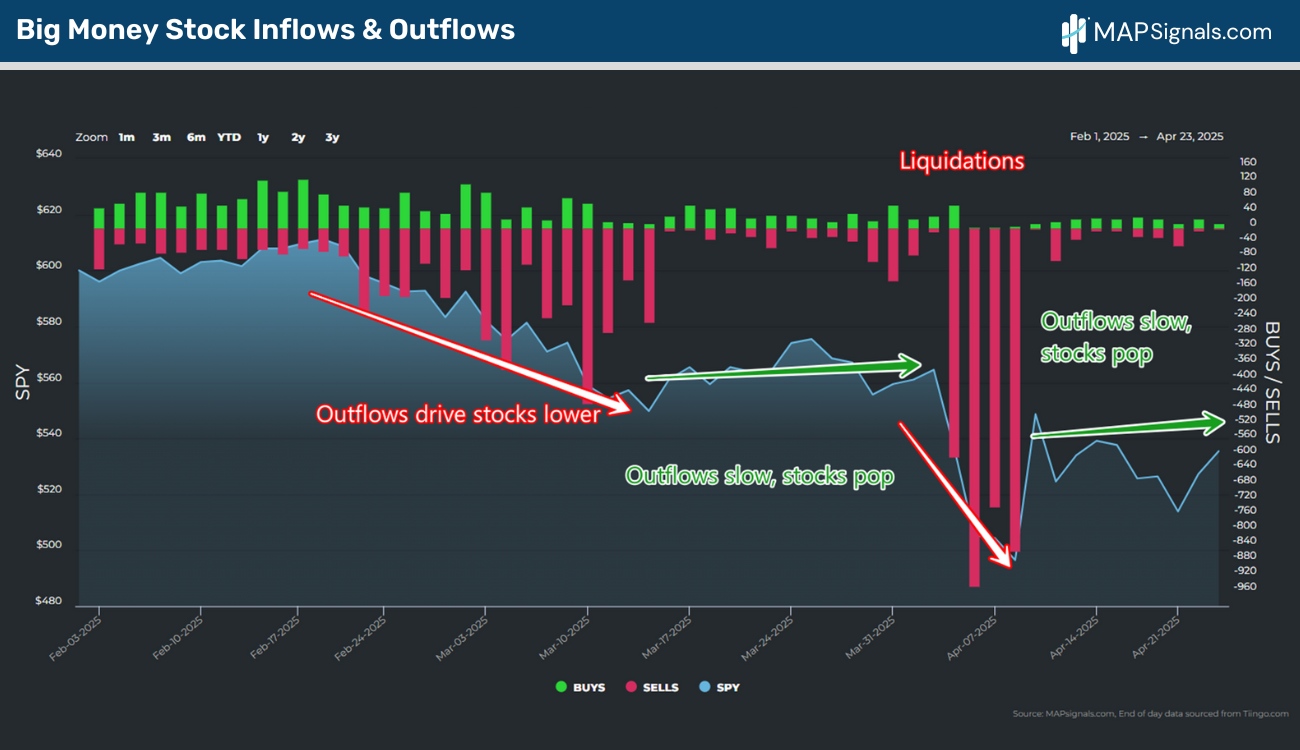
When we marry outsized volume analysis to equity flows, the relationship between outflows and forward equity performance is apparent.
Check out the following chart.
In early February we see outflows (red bars) increased, dragging on the S&P 500 (SPY ETF). When outflows pick up, stocks have nowhere to go but down.
That followed a period when selling stopped and equities stabilized.
Then came extreme capitulation, forcing stocks to crash.
Finally, we see exactly why stocks have been acting better the last couple of weeks: Capitulation vanished.
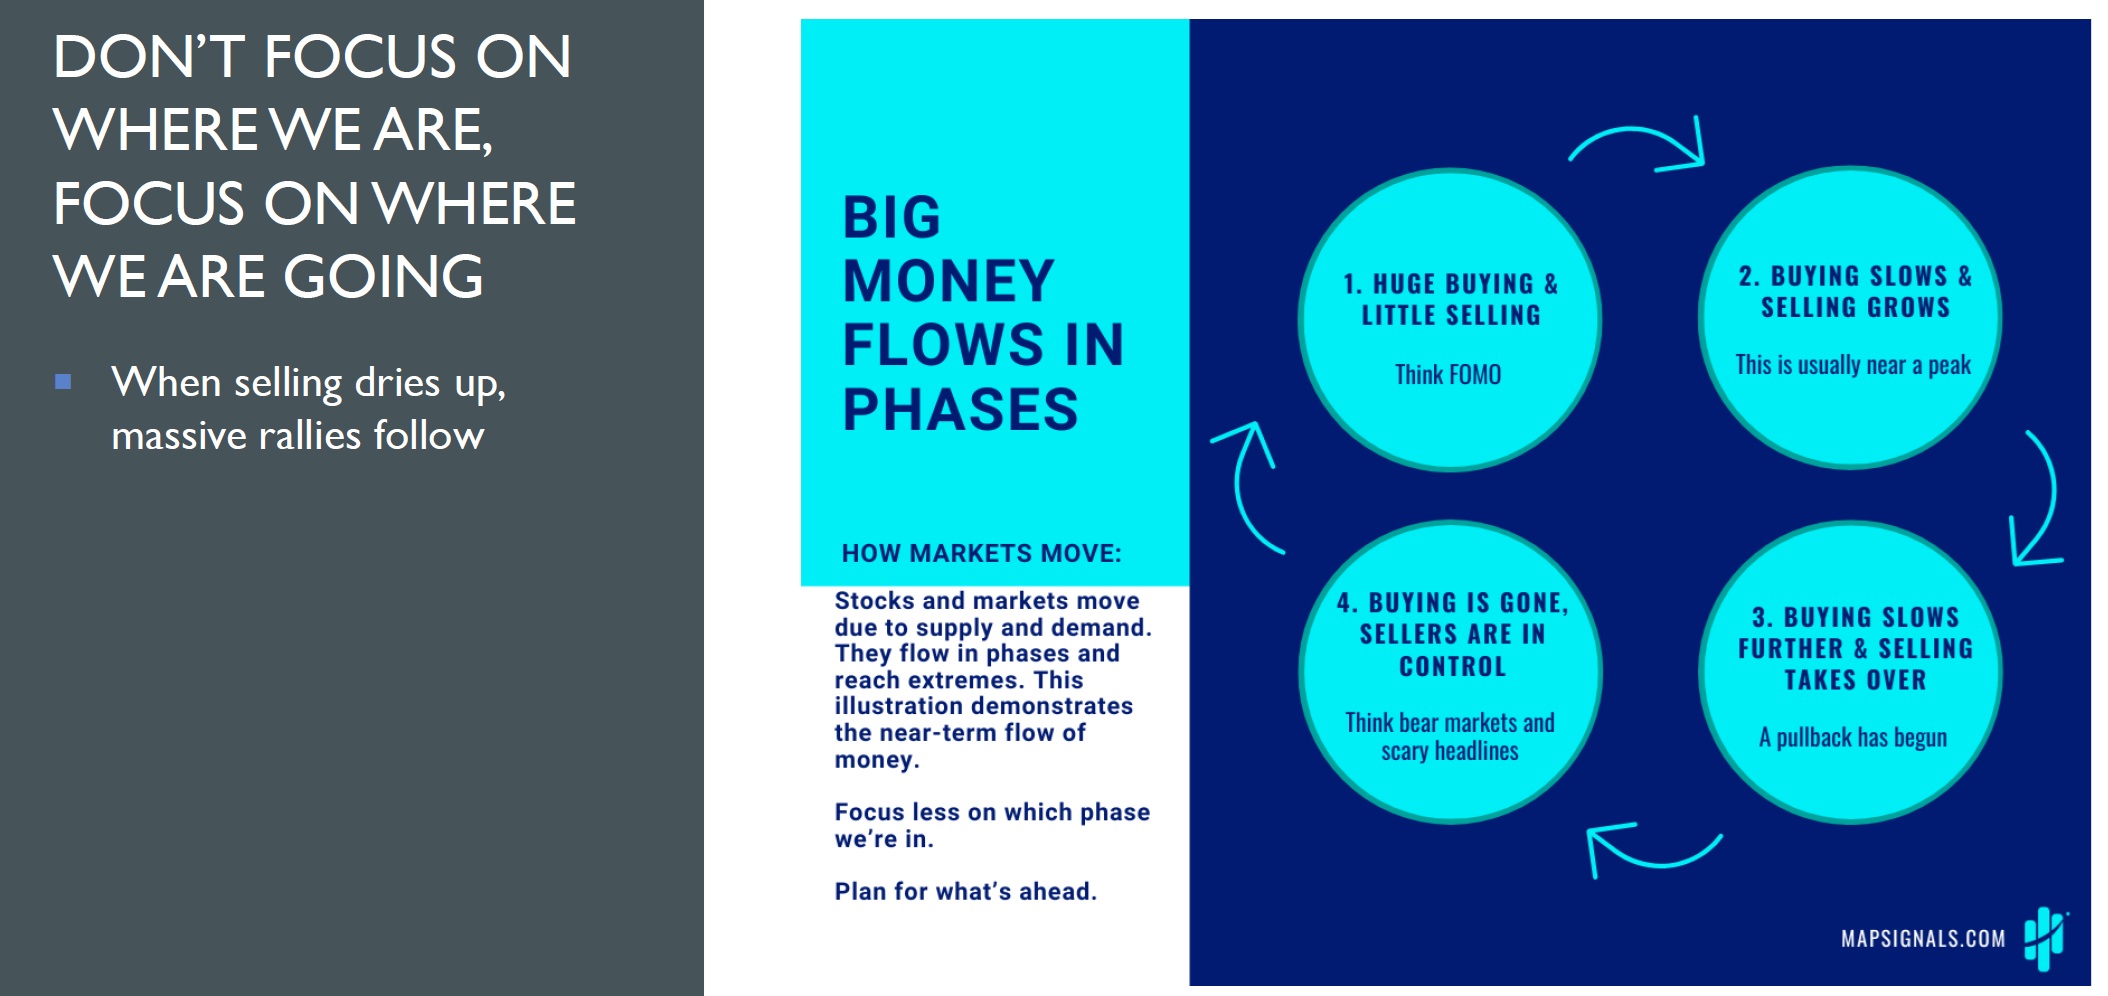
When you view money flows through this lens, every major pullback has a repeatable pattern.
Phase 1 is the FOMO phase where inflows seem to never stop.
Phase 2 is defined by an increase in outflows which caps equity prices (peaks).
Phase 3 is the corrective phase when selling takes over. Most pullbacks end here.
Phase 4 is rare and includes capitulation, an absence of buyers, and awful headlines…generally there’s zero reason to buy stocks.
What many investors fail to realize is how quickly markets shift from phase 4 to phase 1. It appears that’s what’s coming next:
As an investor, you want to be buying stocks during extreme capitulation. Equity fire sales bring deals rarely seen.
Now we fully recognize that not everyone wants to get in there when markets are crashing. It’s a bold strategy.
However, while we wait for the true buyers to show up in our data, which will likely be any day now, there’s a volatility signal that just arrived.
You’ll want to share this with your bearish buddies.
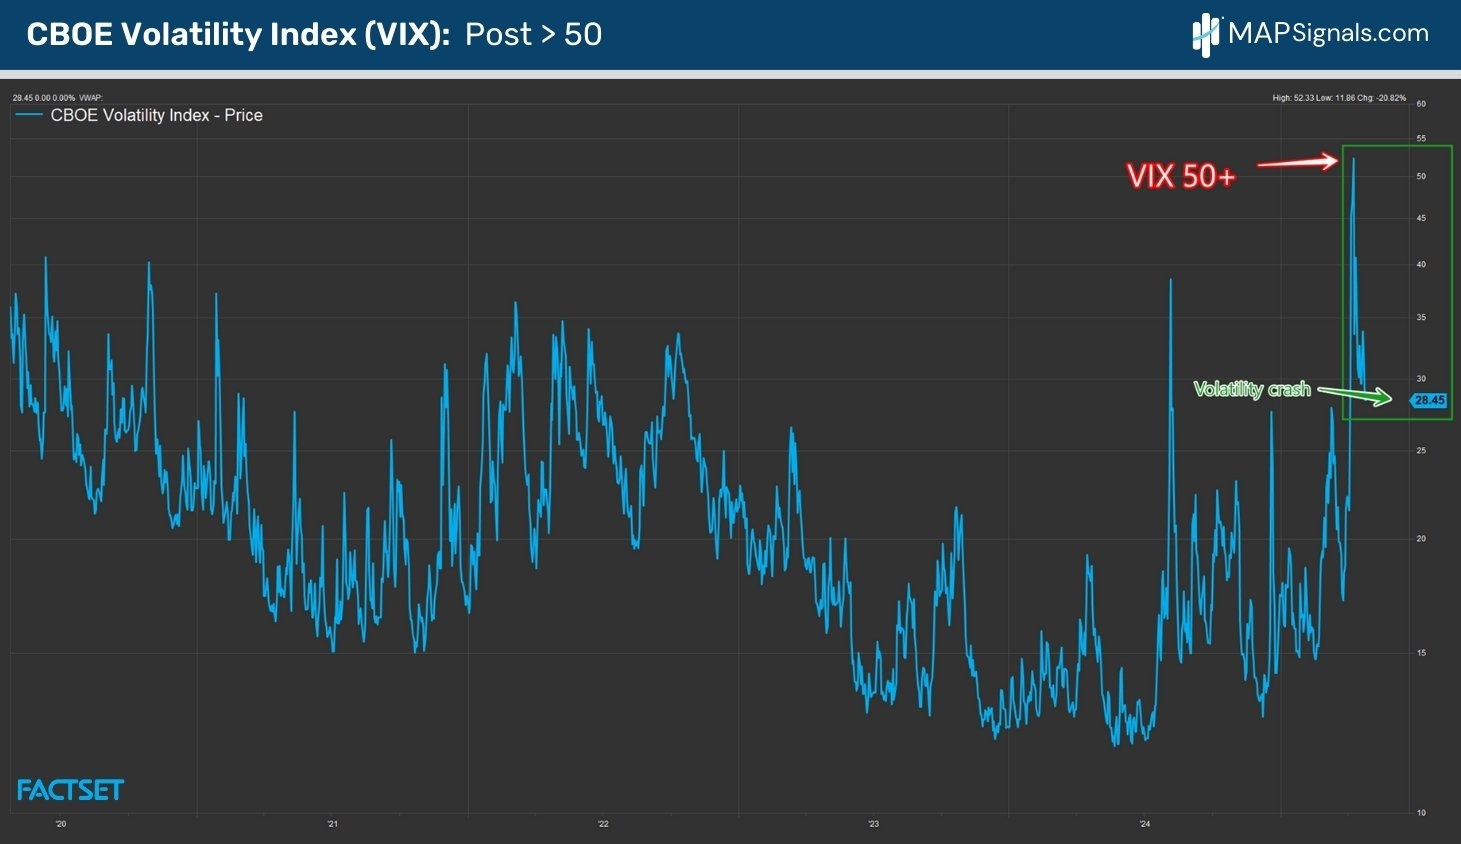
Volatility Crash
The CBOE Volatility Index (VIX) reached over 50 just days ago.
That’s ultra rare, last occurring in 2020.
It’s quickly pulled back to 28.45…a stunning volatility crash:
Can we learn anything from this volatility meltdown? YES.
I went back and isolated all 40+ VIX readings that eventually closed below 30. There’ve been a dozen instances since 1990.
Here’s how the S&P 500 fared afterwards:
- 3-months later stocks jump 5.2%
- 6-months later stocks climb 9.9%
- 12-months later equities pop 19.6%
- 24-months later equities soar 23.4%
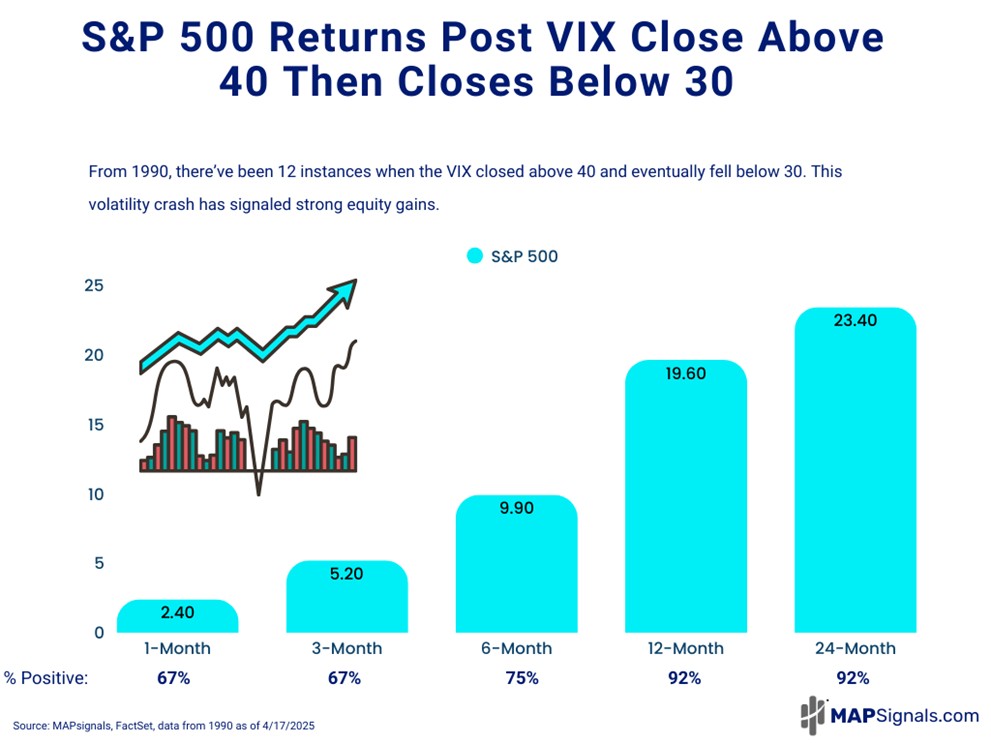
That’s a good setup.
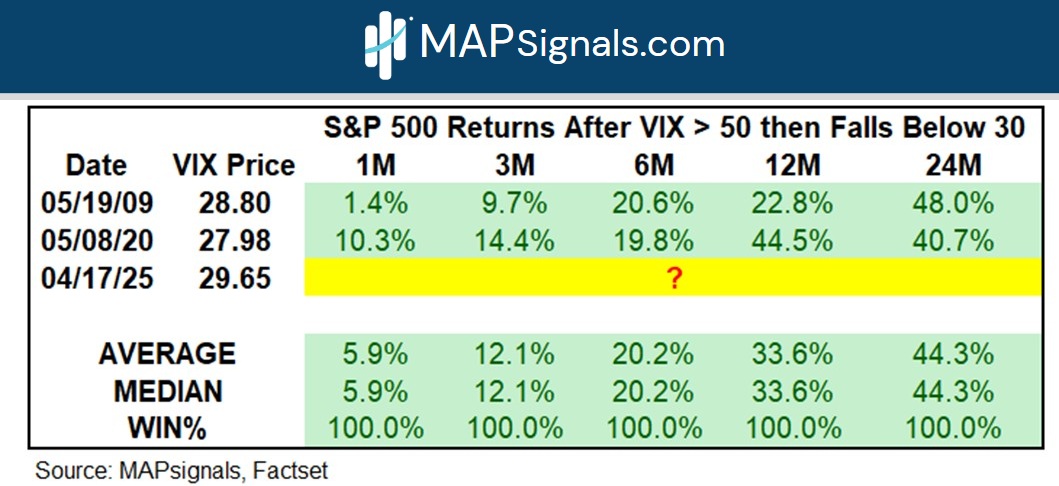
But we can’t stop here. There’s an even rarer signal hidden in this volatility crash.
When you single out periods when the VIX closed above 50 and then dropped below 30, a bear killer signal forms!
This rare collapse has only occurred twice during the direst periods: the GFC & COVID-19.
In each of these instances, the S&P 500 was positive 1, 3, 6, 12, and 24-months later…with a 100% positive hit rate.
Folks, if you’re not buying stocks right now…you’re going to miss the boat.
Capitulation came and went.
Now we see volatility melting away like ice on a hot day.
It’s only a matter of time before a surge of capital is put to work in equities. And by the time the crowd acknowledges it, stocks will be well into an uptrend.
Don’t follow the headlines.
Follow the money flows.
If you want research that goes against the crowd and offers insights that you can’t get anywhere else, get started with a MAP Pro subscription.
The opportunity is massive right now.
You just need a map to see it!
***Lastly, join co-founder Jason Bodner, May 15th–17th at the Hyatt Regency Miami, as he presents: Find Market-Beating Stocks and ETFs in 2025: 1-Click Quant Analysis at the 2025 MoneyShow Masters Symposium in Miami.
He’ll discuss our proprietary 1-Click Quant Analysis method of picking market-beating stocks and ETFs.
Click the image below to register now. You don’t want to miss this!