• Menu
  • Skip to right header navigation
  • Skip to main content
  • Skip to primary sidebar
  • Skip to footer

MAPsignals

We map big money.

  • Latest Insights
  • Power of MAP
    • MAP Products
    • MAP System
    • MAP White Papers
    • Videos & Interviews
  • Profit with MAP
  • About
    • About MAP
    • MAP Team
    • Authors
    • MAP System
    • MAP Products
    • Big Money Index
  • Members
    • Get Started With MAP
    • My MAP
    • Big Money Charts
    • MAP View
    • MAP View Options
    • MAP Top 20 Weekly
    • MAP 50
    • Member Updates
    • Platinum Updates
    • Members Only Posts
    • Performance
  • Portal

Our Big Money Index

The Big Money Index (BMI) is one of the most powerful features of our MAPsignals stock-picking system… and it almost wasn’t discovered.

When we created the MAPsignals system, we built it to uncover Big Money buying and selling of individual stocks. But as we watched the system identify winning trade after winning trade, we noticed something else…

While the Big Money tended to buy high-quality stocks and sell low-quality ones, there would be unusual periods when Big Money buying would also include bad stocks. Similarly, there would be periods when Big Money selling would also include good stocks.

So we kept studying the data, and we discovered something amazing…

By looking at Big Money activity across the entire market, we saw that periods of aggressive buying of good and bad stocks alike tended to last for about three to four weeks before ending in a broad market pullback. Likewise, periods of heavy selling of both good and bad stocks usually lasted for one to two weeks before kicking off a market rally.

Without even realizing it, we’d stumbled on the most reliable market timer we’d ever seen.

And now it’s right at your fingertips…

How To Use The Big Money Index

To make the Big Money Index as easy to use as possible, we boiled all our sophisticated analysis down to one number… the BMI ratio.

When the BMI is between 0% and 25% (the green area), selling has gotten overheated, leading the markets into oversold territory. These periods tend to last for about one or two weeks before a broad market rally kicks off.

At the other extreme, a BMI reading above 80% (the red area) means we’ve entered a period of runaway buying and markets are overbought. Periods like this tend to last a little longer, typically stretching about four weeks before leading to a broad market pullback.

We also created a simple visual representation to help our MAPsignals subscribers quickly understand what that ratio means to them as investors…

big money index

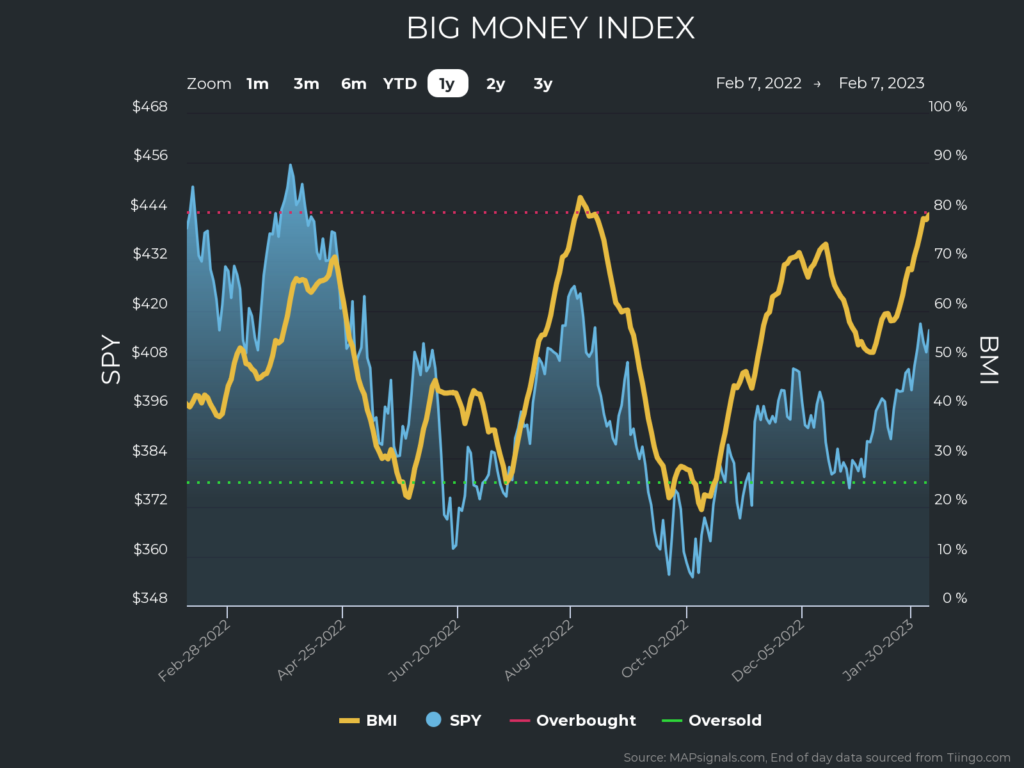
This “market traffic light” has proved extremely reliable over the past three years. That’s why we like to call it “The market timer’s best friend.”

And now it can help you prepare for market rallies and pullbacks weeks before they happen… so you can profit like the pros.

Subscribers of all levels get access to the Big Money Index updating on a daily basis and more!

Check out our tutorial below on how it works.

PROFIT LIKE THE PROS WITH MAP

Primary Sidebar

Get Big Money Insights for FREE

Want to know where the Big Money is headed?

Just enter your email address below. You'll get our FREE NEWSLETTER sent directly to your inbox.

We call it Big Money Insights... It’s your weekly sneak peek at the powerful market-moving forces that are hidden from 99% of investors.

"*" indicates required fields

This field is for validation purposes and should be left unchanged.

Follow us on Twitter

MAPsignals Follow 1,449 1,070

MAPsignals is a data platform that tracks institutional money flows in stocks and ETFs. Sign up for free insights here: https://t.co/SaAVHjKC9J

mapsignals
mapsignals avatar; MAPsignals @mapsignals ·
9h 1622987016957820928

One of my favorite #dividend #stocks having a day - Skyworks Solutions $SWKS - owned it for years

The $2B buyback is pretty significant given the market cap is sub $19B

#Semiconductors continue to see major inflows

Reply on Twitter 1622987016957820928 Retweet on Twitter 1622987016957820928 0 Like on Twitter 1622987016957820928 2 Twitter 1622987016957820928
Load More...

Footer

© 2021 Mapsignals.com

  • Home
  • Contact & Disclaimer
  • Privacy Policy
  • Terms & Conditions
  • Opt-out preferences
  • FAQ

Copyright © 2023 · Mai Law Pro on Genesis Framework · WordPress · Log in

✕
What Happened to Risk Assets White Paper is Here

Get your copy here and take a journey through our thoughts on margin and leverage.

Enter your email address below and you'll get our FREE NEWSLETTER sent directly to your inbox. 

 We call it Big Money Insights... It’s your weekly sneak peek at the powerful market-moving forces that are hidden from 99% of investors.