Why We Are Buying the Dip, and You Should Too
On the heels of a scorching 38% rally off last October’s low, the S&P 500 has hit turbulence since peaking in mid-July.
The large cap index notched a quick 9.7% correction while the NASDAQ 100 suffered a deeper 16% peak- to-trough decline.
Today, we’ll make the data-driven case for why we’re buying the dip, and you should too.
This pullback is perfectly normal and not the start of something worse.
We’ve got 4 evidence-rich reasons to stay the course. And we’ll reveal how you should best position your portfolio with winning sectors for the bull’s next leg higher.
Volatility is the Price Investors Pay for Outsized Gains
Most of the time, stock market dips are short and shallow.
The S&P 500 has seen 240 declines of 5% or more since 1927. The average decline is 11.8%. The median decline is only 8.3% because it’s equally weighted, giving less weight to big bear markets.
But let’s face it, drawdowns are never fun. Volatility often catches us off guard, appearing suddenly after extended rallies.
I don’t have to tell you, but it’s easy to get faked out.
Before we get into the macro case for more equity upside, let’s start with the #1 reason to buy this dip: market history.
It turns out volatility is perfectly normal. It happens every year. It’s a healthy cleansing process that resets expectations and shakes out weak hands.
It’s just the price you pay to enjoy the juicy returns only stocks can provide.
Check this out:
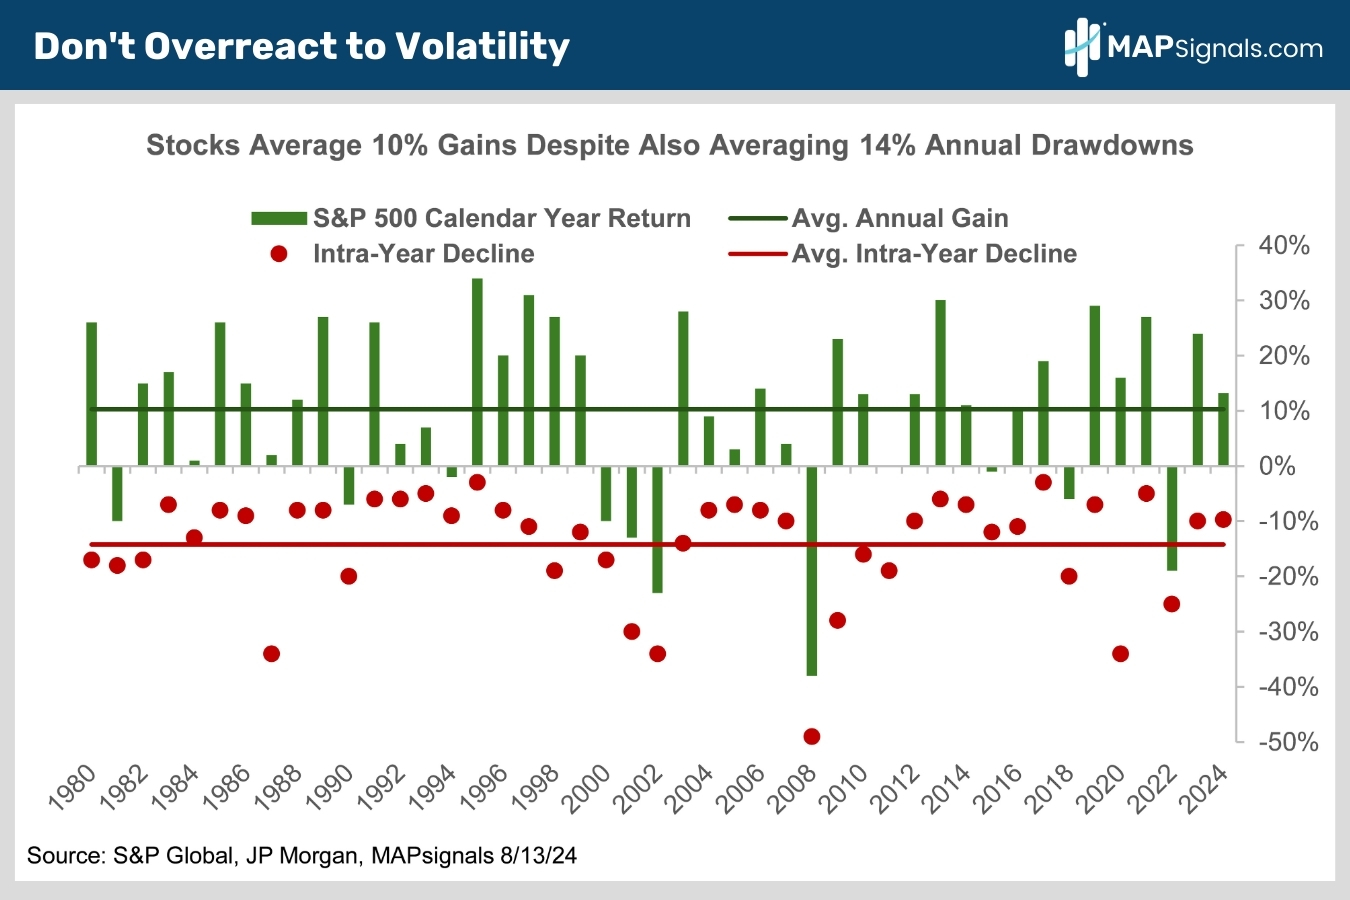
Since 1980, the S&P 500 has averaged a 14% annual peak to trough decline while still chalking up a healthy 10.3% average annual gain, plus dividends (chart). Think 12%.
There’s no free lunch. If you want to earn 12% on your money, you have to live with volatility.
A fresh historical perspective should make recent volatility more manageable. Now, let’s roundup the macro reasons for why we’re buying this dip.
Why We Are Buying the Dip, and You Should Too
Recession fears have made a comeback. Bond yields have dropped sharply amid softening economic data.
Before we assume a nasty recession looms, let’s take a deep breath and look at the data.
The job market is widely seen as the best indicator for gauging the health of the US economy.
While it’s true that the 4-week average of initial jobless claims has recently ticked up to 241,000 from its cycle low near 200,000 in January, the labor market remains fundamentally healthy.
The current 241,000 4-week average of initial jobless claims is 34% below its 60-year average of 364,000.
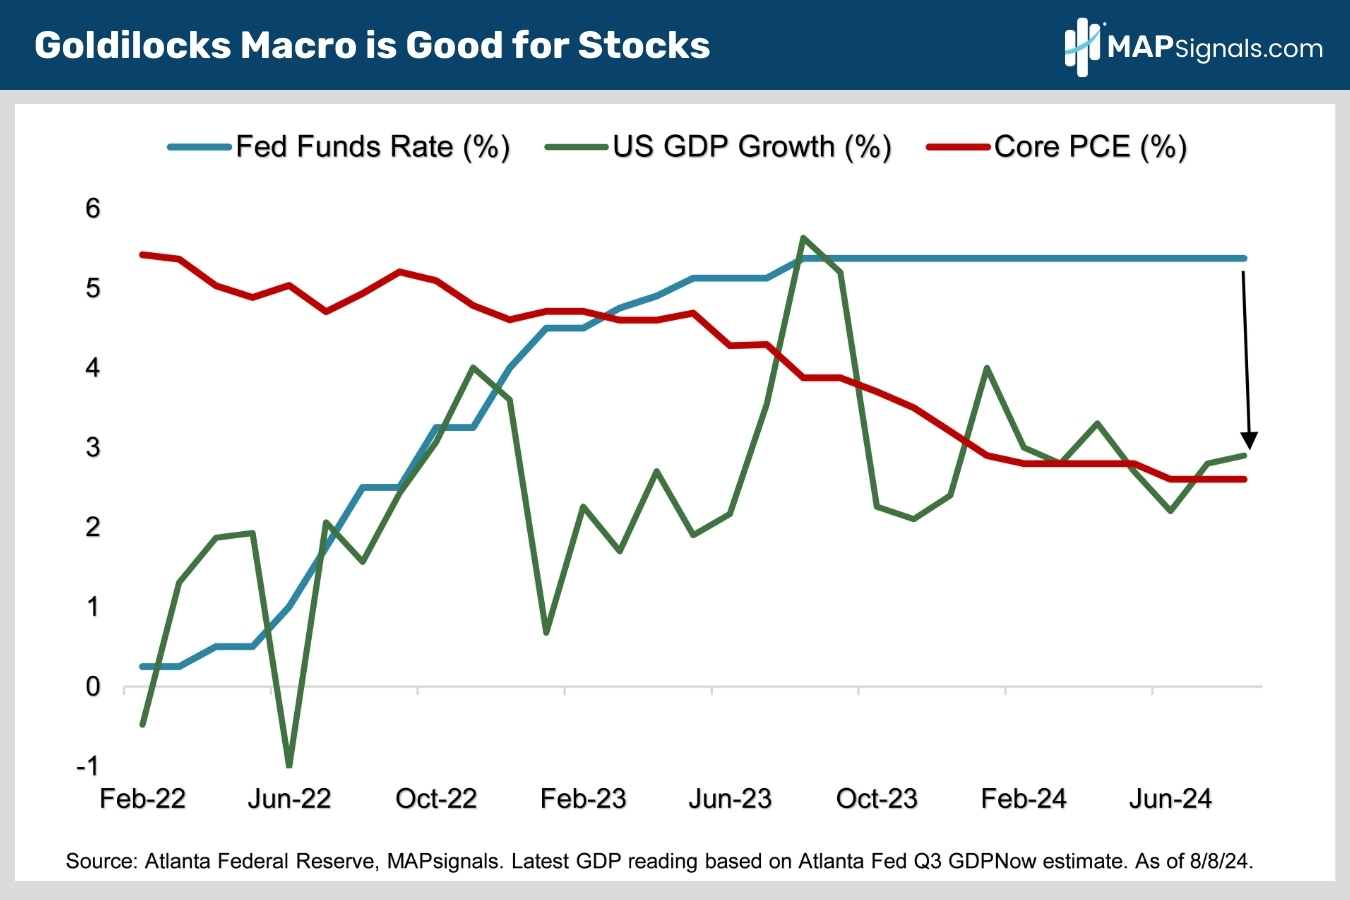
Meanwhile, the latest real time Q3 GDP forecast from the Atlanta Federal Reserve stands at a robust 2.9%.
And oh, by the way, inflation continues to fall. The Fed’s favored inflation measure, core CPE, stands at 2.5%, down sharply from its 5.4% peak two and a half years ago.
Add it all up and you’ve got the 2nd reason to stick with stocks: a goldilocks economic outlook that will continue to cushion stocks as the Fed finally begins cutting rates.
Thanks to the recent growth scare, markets are betting on even more aggressive Fed easing beginning in September. The Fed Funds Futures market now expects a 3.75% Fed Funds rate by next April.
This all points to higher market prices coming to a town near you:
OK, so the growth, inflation and Fed outlooks are likely to remain bullish for equities, let’s shift gears to check on another big macro driver of stock prices: corporate earnings.
Reason #3 to feel bad for the bears is rising corporate earnings.
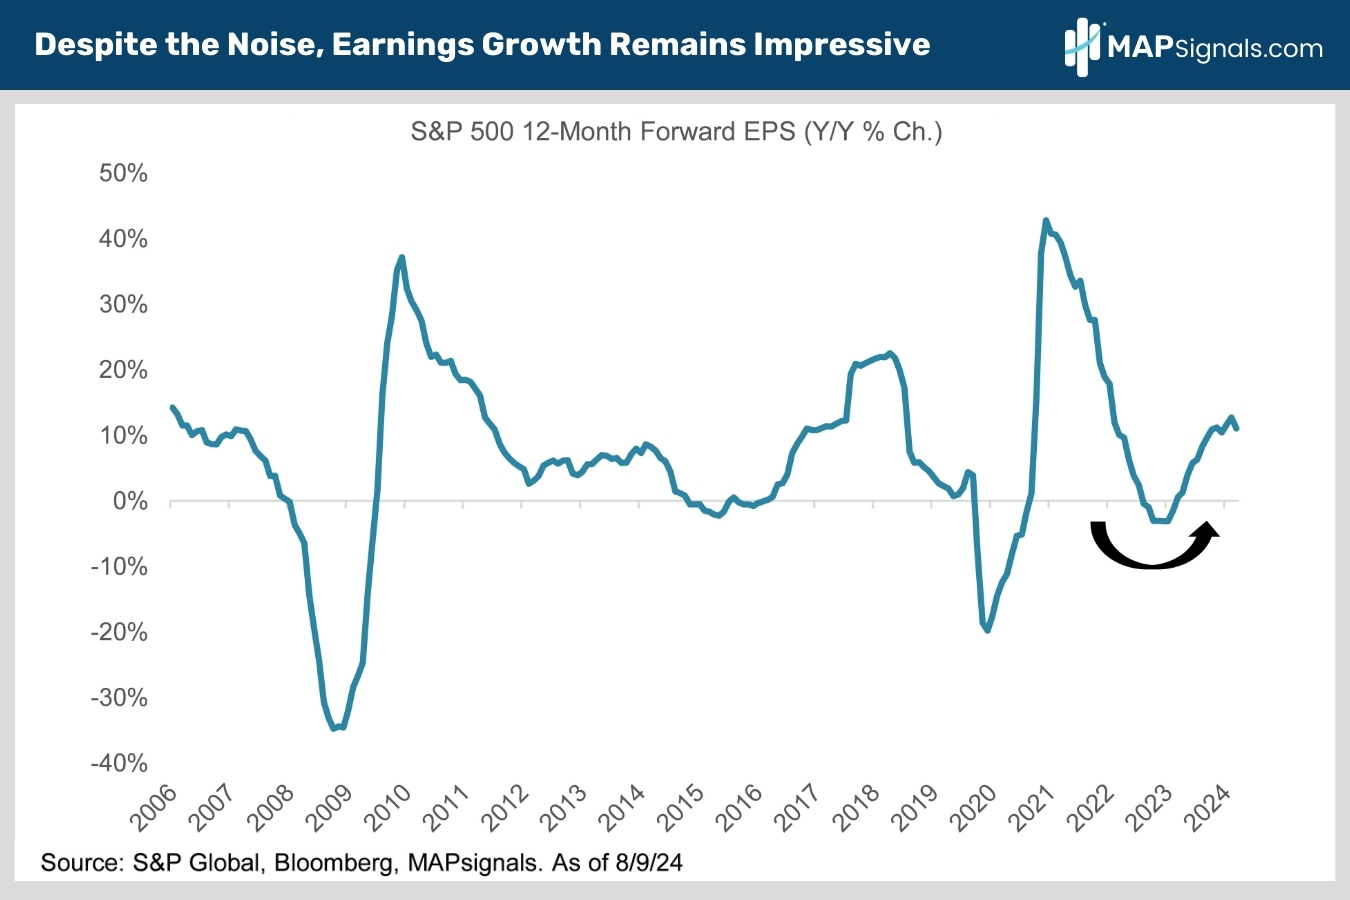
In the wake of 2023’s shallow earnings recession, S&P 500 12-month forward per-share earnings growth has ramped up to 11% after a better-than-expected second quarter earnings season.
When earnings are improving, stock prices follow suit. Keep a buy the dip mentality as long as corporate bottom lines are improving:
OK, so fundamentals are improving. But what about valuations?
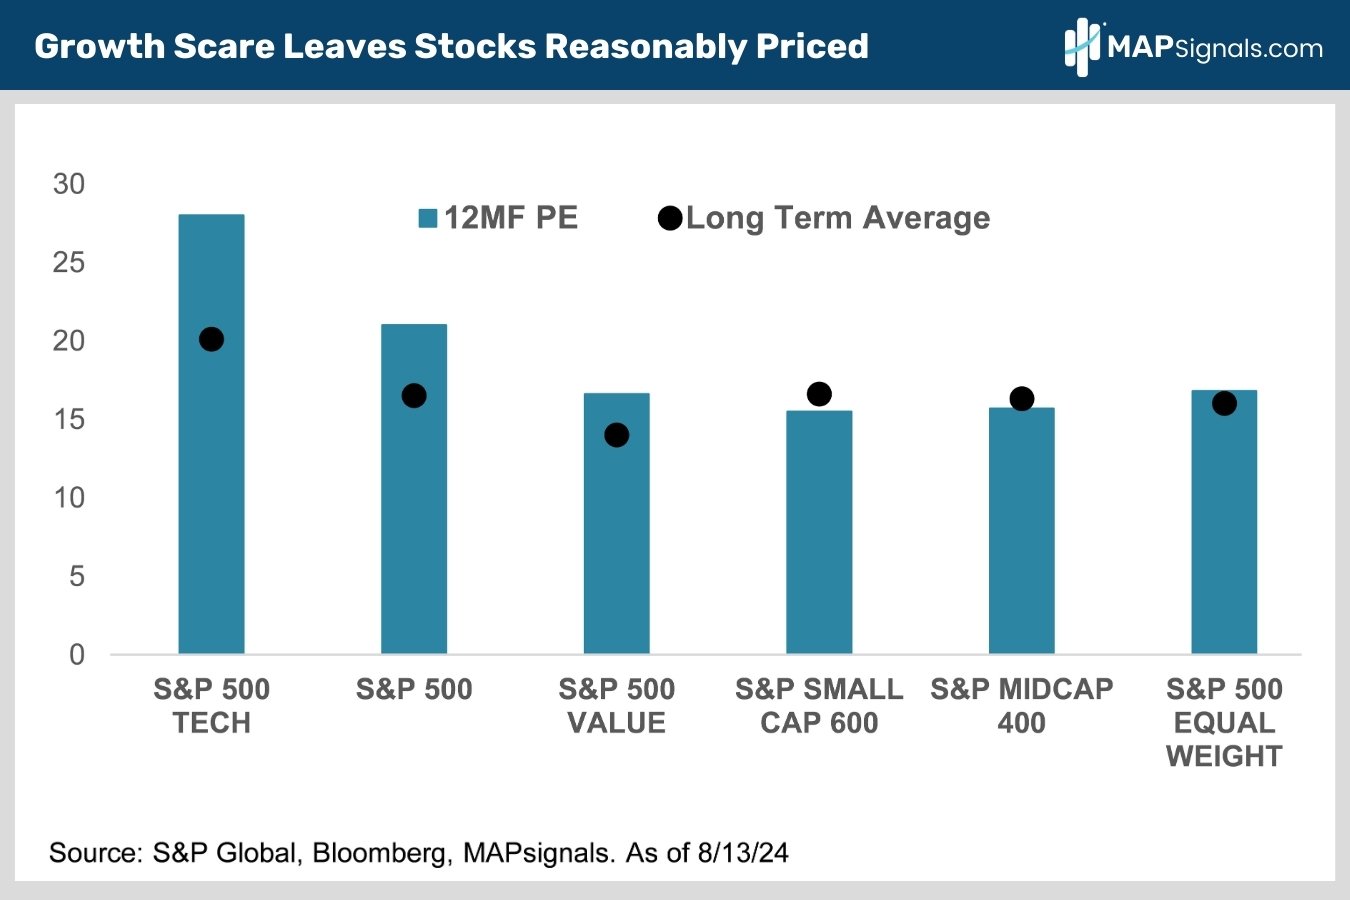
On the higher end of the valuation spectrum, technology stocks have reset lower but remain historically elevated at 28.5X 12MF EPS. This is justified by big tech’s amazing 20% profit growth.
As for the rest of the stock market, earnings are ramping up and valuations are reasonable relative to history, as this chart shows.
Relative value can be found in the S&P 500 Large Cap Value, S&P Mid-Cap 400, S&P Small Cap 600 and S&P 500 Equal Weight indices.
This is why earlier this month we made the case to own small and mid-cap equities. Throw in the fact that interest rates are likely to fall further, and these “value areas” are set for brighter days.
Reason #4 to be constructive on stocks is a healthy reset in tech valuations and plenty of value under the surface.
What This Means for Your Portfolio
The growth scare is a head fake.
Goldilocks growth, falling inflation and lower rates have earnings humming.
Throw in the downward valuation reset and it’s no wonder the big money is stepping up to the plate to buy.
We were one of the few out there early during Monday’s stock market crash telling our subscribers to be greedy rather than fearful… highlighting 3 incredible companies to scoop on sale.
We would encourage you to have a buy the dip mindset when volatility strikes. That’s a winning formula long-term.
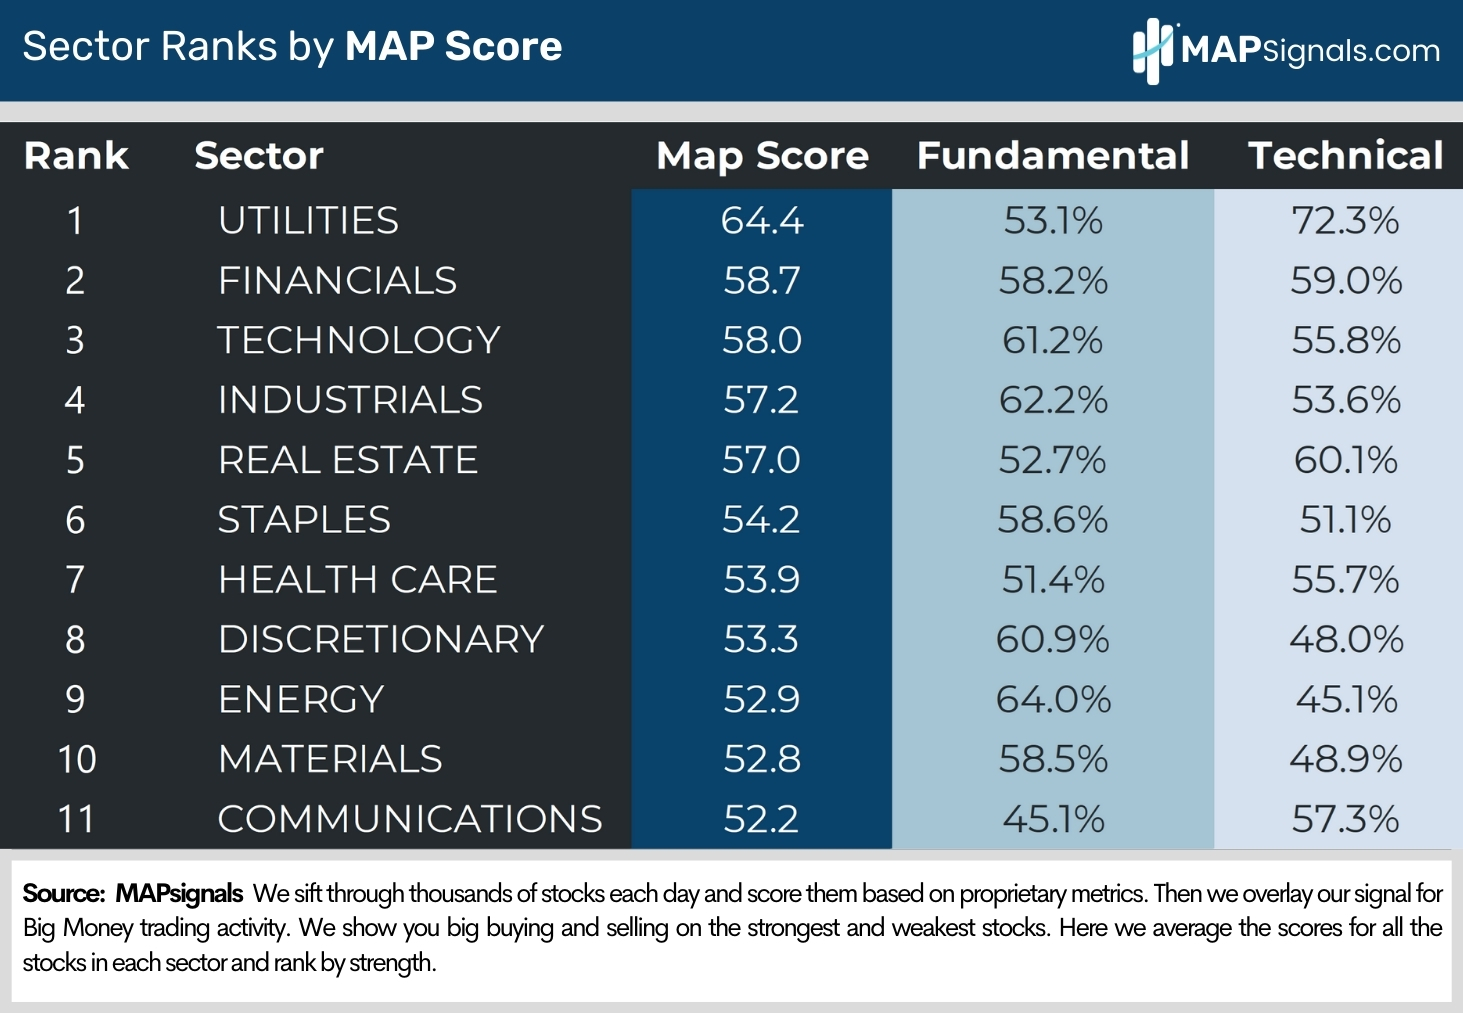
The areas beaming with institutional support are rate-sensitive sectors like utilities and real estate, as well as cyclicals like financials, industrials and tech:
There are plenty of incredible companies on sale. Use a map to find them!
Here’s the Bottom Line
Don’t overreact to volatility. It’s perfectly normal. It happens every year. It’s a healthy cleansing process that resets expectations and shakes out weak hands.
It’s just the price you pay to enjoy the juicy returns only stocks can provide.
Since 1980, the S&P 500 has averaged a 14% annual peak to trough decline while still chalking up a healthy 10.3% average annual gain, plus dividends. Think 12%.
Market history isn’t the only reason to like stocks.
Goldilocks growth, falling inflation and lower interest rates have earnings humming. Throw in the downward valuation reset and looming Fed easing and it’s no wonder the big money is stepping up to buy.
Rate-sensitive sectors like utilities and real estate, as well as cyclicals like financials, industrials and tech are all seeing strong institutional buying and top our sector rankings. That’s where you want to be.
If you want to find specific large-, mid-, and small-cap real estate, utilities, financials, industrials and tech names ramping with continual institutional support, get started with a MAPsignals PRO subscription.
It’ll get you access to our portal that updates every morning, showcasing the exact tickers being bought and their scores.
Our prized Top 20 list is full of cyclical market beaters. This is the report that found every outlier stock in our research.
There are plenty of quality gems to buy as the market shrugs off this growth scare.
You just need to consult a map!
Lastly, tomorrow my colleague Jason Bodner is presenting the Stock Investors’ Election Playbook at the MoneyShow Virtual Expo. If you want to learn how we use our unique data lens to uncover the biggest market moves and outlier stocks – tune it tomorrow, August 20th, at 4:40PM ET.
Just click the image below to sign up – see you there!