
R.I.P. Bears
The Fed finally did it.
They cut interest rates.
Our equity stance is summed up as follows: R.I.P. Bears!
So often, traders overcomplicate stock market price action. You can see it all over the media with recaps of yesterday’s wild ride.
Major indices were up triple digits during the Fed presser… then they finished the day flat.
On the surface, stocks appeared to go nowhere. And that helped the bearish mob tout how bad rate cuts are for stocks…even worse, making analogies to 2008.
Don’t fall for their tricks!
When you strap on the Big Money lens, you’ll find how bullish the action was…it was a massive institutional buy day.
Today we’ll set the record straight by reviewing history to learn what’s likely ahead for equities now that easing policy is here.
Then we’ll drive home the near-term money-flow narrative.
If you haven’t done so, now’s the time to hug a bear…they’ll need it.
Stop Fearing Fed Rate Cuts
Interest rate cuts are good for the economy:
- They spur economic growth as the cost of capital decreases
- Lower rates make debt burdens lighter, allowing profits to fall to the bottom line
These are just 2 of many sound reasons to be happy about rate cuts. Pretty simple, right?
Well, it can get more complicated given recent history. Bears love any chance to point out how a few rate cutting instances have been disastrous moments for stocks.
They are correct. The Dot-com Bubble, Great Financial Crisis, and COVID-19 are painful reminders of a few unfun rate slashing periods.
But let’s settle the score on the burning question for most investors right now: Are rate cuts bad for equity prices?
Below are the 9 initial Fed rate cutting periods since 1990:
- July 1990 Gulf War (-25bps)
- July 1995 Mid-cycle adjustment (-25bps)
- September 1998 Global Currency Crisis (-25bps)
- January 2001 Dot-Com Bubble Crisis (-50bps)
- November 2002 (-50bps)
- September 2007 Housing Crisis (-50bps)
- October 2008 Global Financial Crisis (-50bps)
- August 2019 Mid-cycle adjustment (-25bps)
- March 2020 COVID-19 Pandemic (-50bps)
Here are those events highlighted over the Federal Funds Effective Rate:
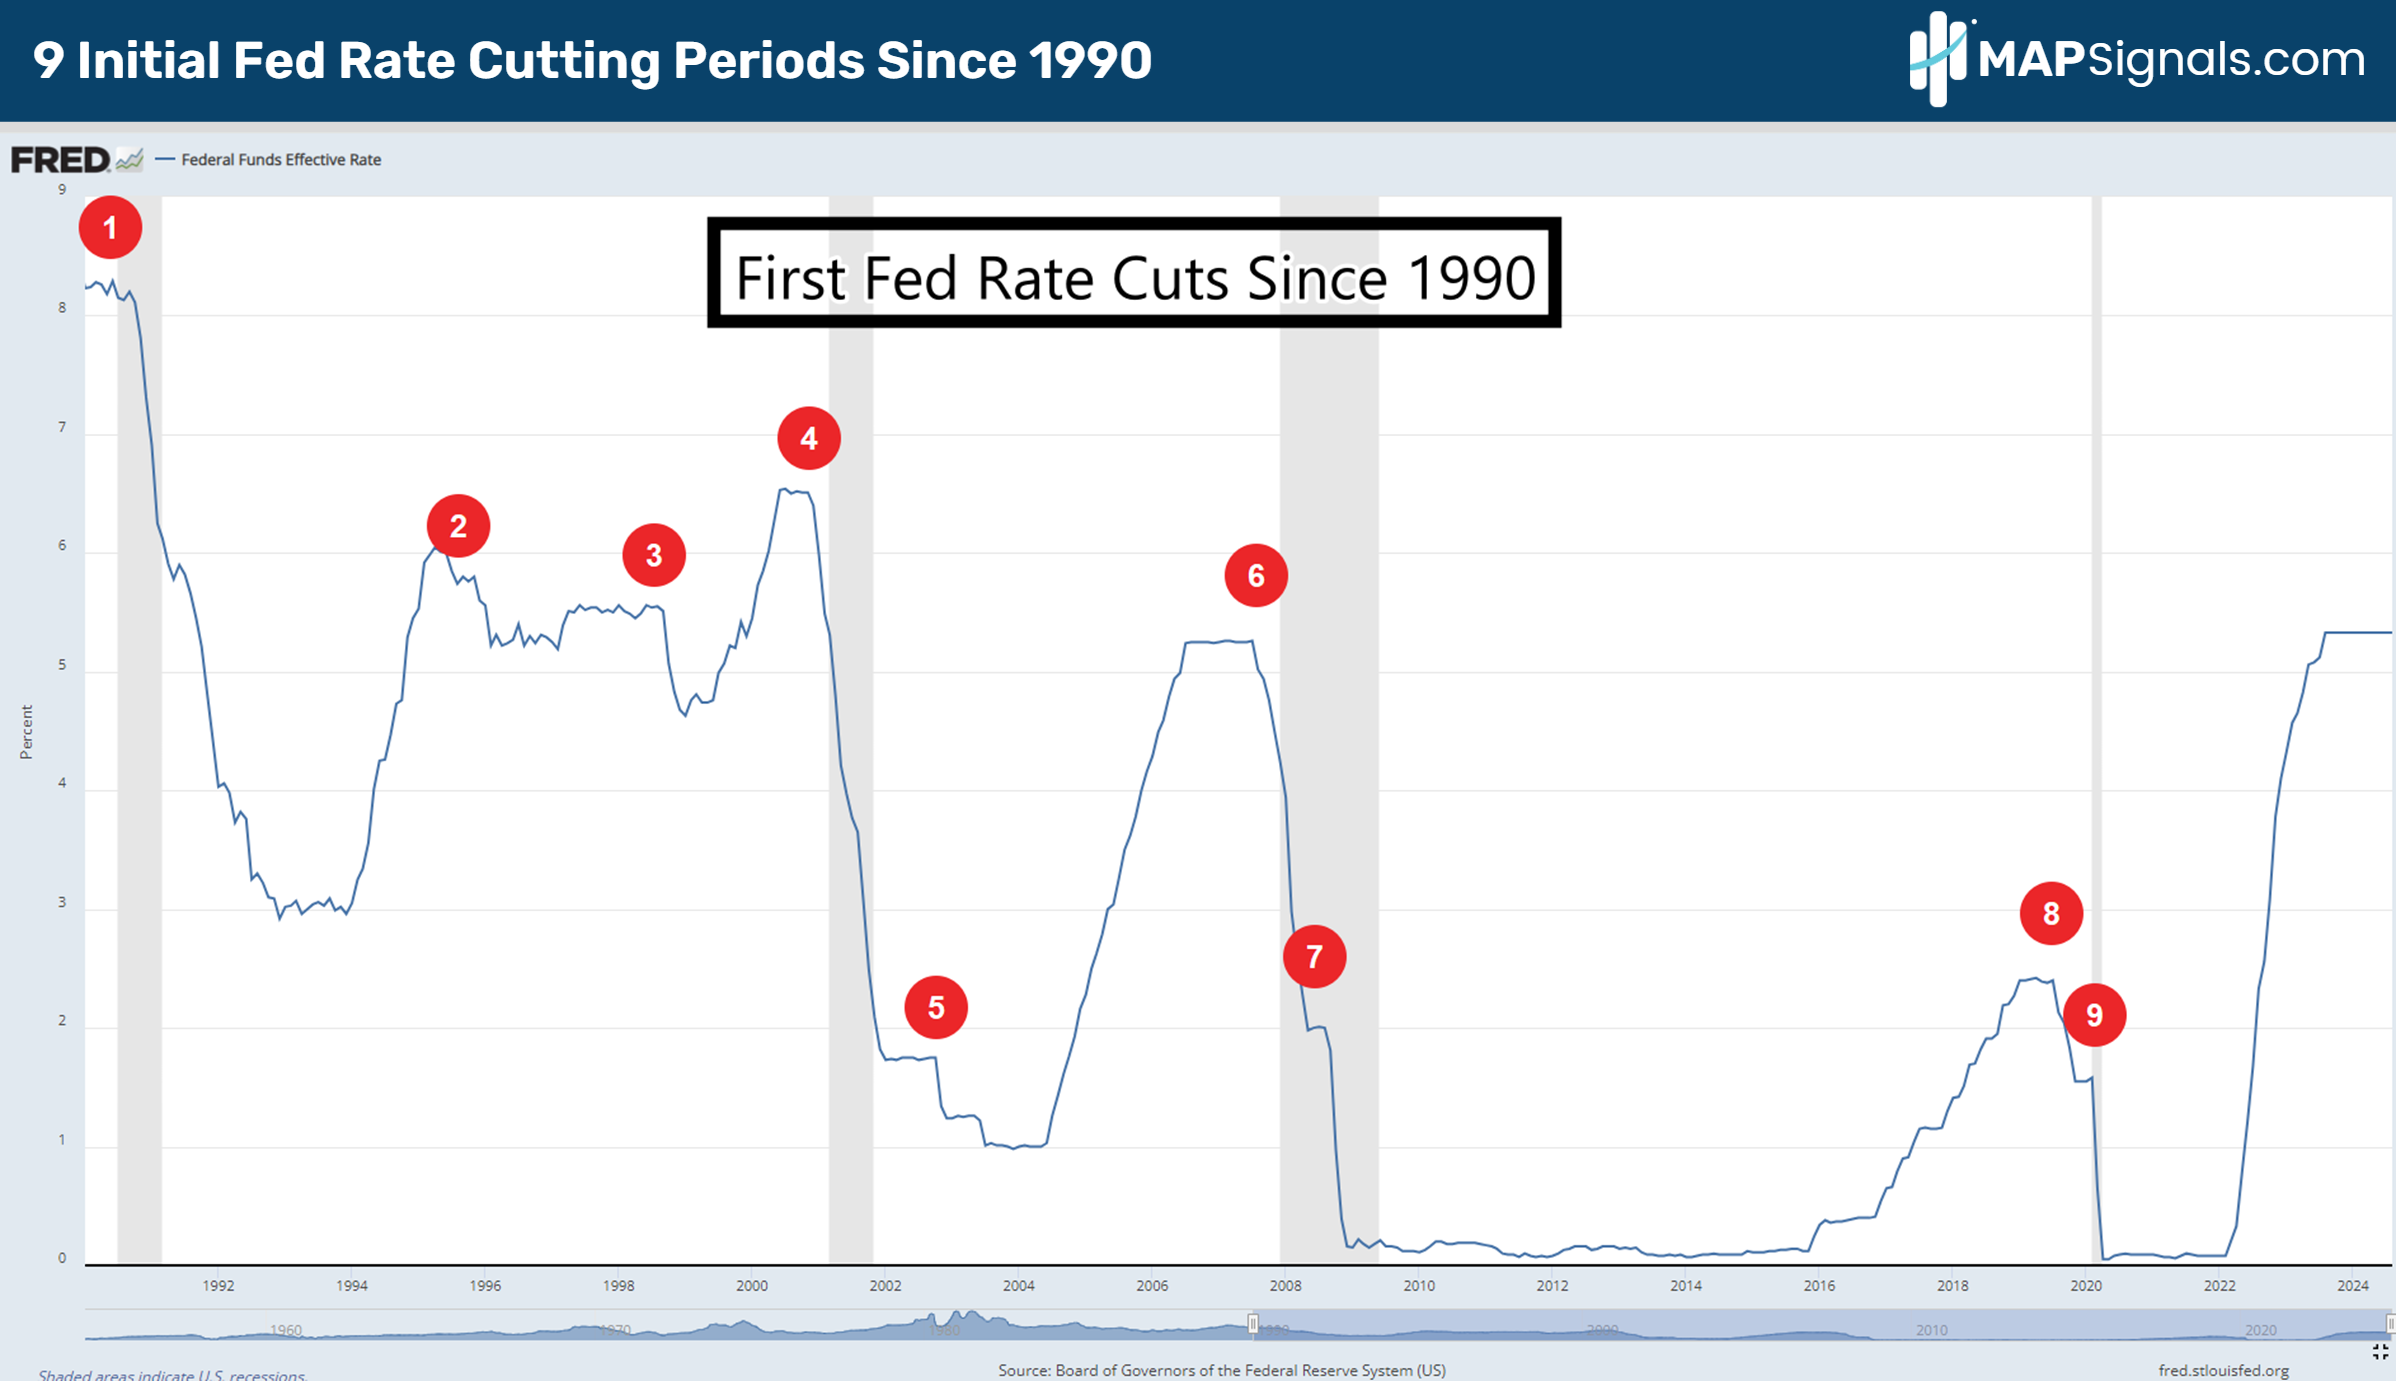
Unfortunately, perma-bears only focus on the big global panics to stir investors’ emotions.
The reality is that on average, after all 9 of these initial rate cutting episodes, the S&P 500 jumps an average of 7.7% twelve months later. This includes the nasty GFC and Dot-com crash.
Folks, we aren’t teetering on the edge of a panic. It’s actually the opposite. From my vantage point, employment is solid, recession is a no-show, and the consumer is alive and well.
My green-tinted glasses may not have you sprinting to switch to the bullish side of the aisle…and I don’t blame you. Personal views aren’t enough to seal the deal.
This is where evidence comes into play.
If you’re allergic to green, turn away now!
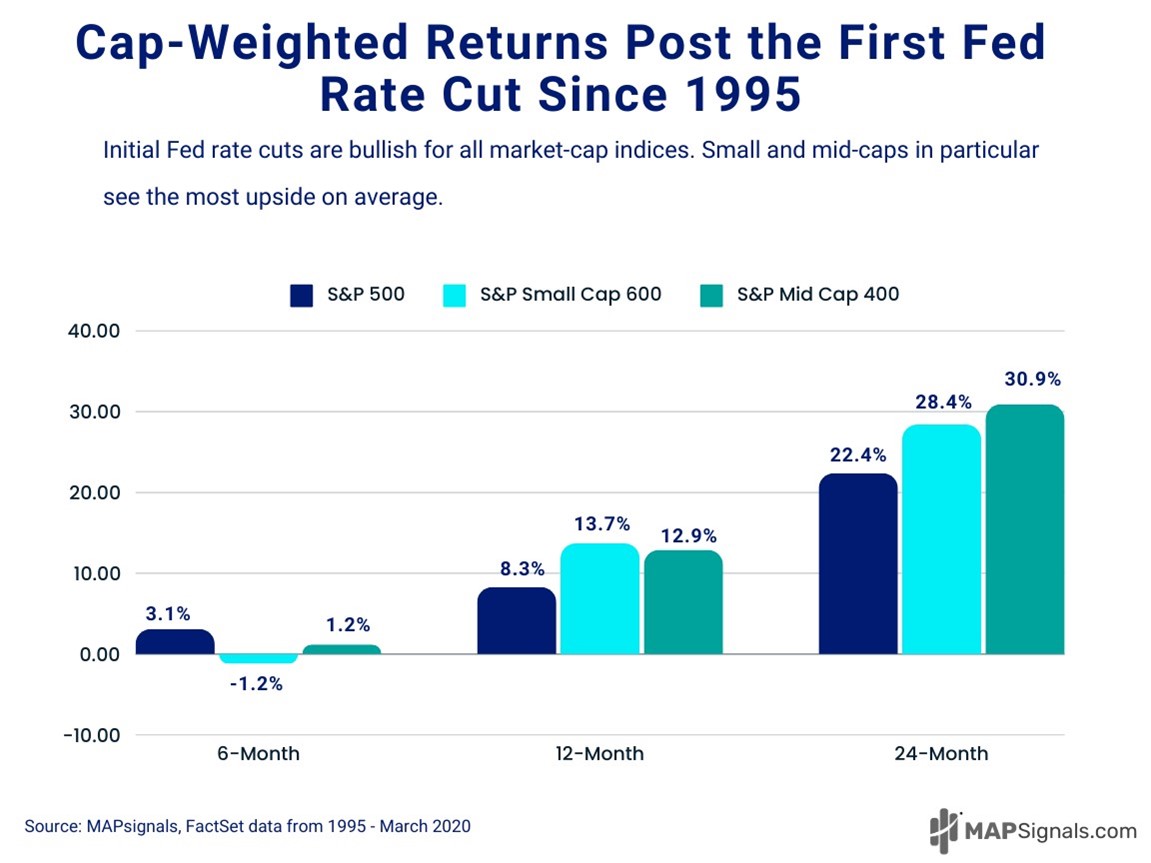
Below plots the forward returns for major large-cap, mid-cap, and small-cap equity benchmarks following the Fed’s initial rate cuts since 1995 (capturing small- and mid-caps from their start).
Last week, I shouted to buy small and mid-caps…check out why that stance is about to be turbo-charged.
12-months after initial Fed rate cuts, the S&P Small Cap 600 and S&P Mid Cap 400 gain 13.7% and 12.9% respectively.
Be bold for 24-months and you’re staring at a whopping 28.4% gain for small-caps and 30.9% rally in mid-caps:
If you’re not ready to chant R.I.P. Bears!…stay with me.
The smart money is already placing their bets on more juicy gains.
Big Money Index (BMI) is Ripping – R.I.P. Bears
It’s one thing to look backwards for clues. It’s another to see in real-time the risk-on action that’s taking hold.
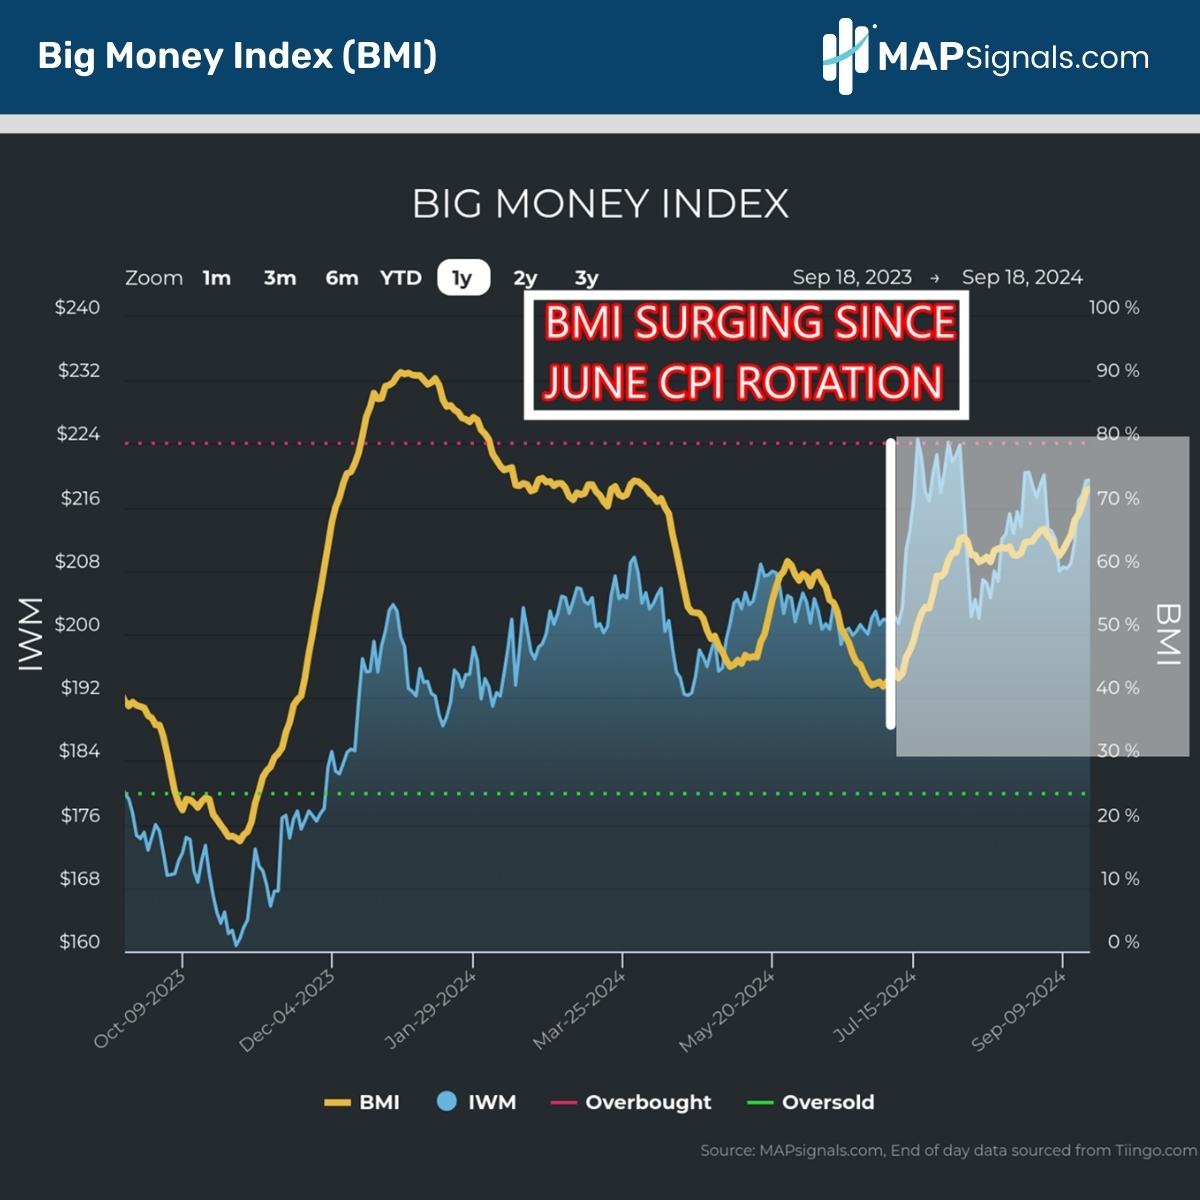
If you want to know where the Big Money stands now, just look at the Big Money Index (BMI). This is the stock market’s North Star.
If the BMI is trending up, it means one thing: Institutions are buying stocks. Since the breath-taking rotation kicked off on July 11th, the BMI has surged higher:
And before you fall for the media’s scare tactics about yesterday’s “weakness into the close.” Consider it was a 91% buy day in our data.
The past week has shown plenty of capital being put to work. Note how healthy yesterday’s 91% buy ratio was under the surface:
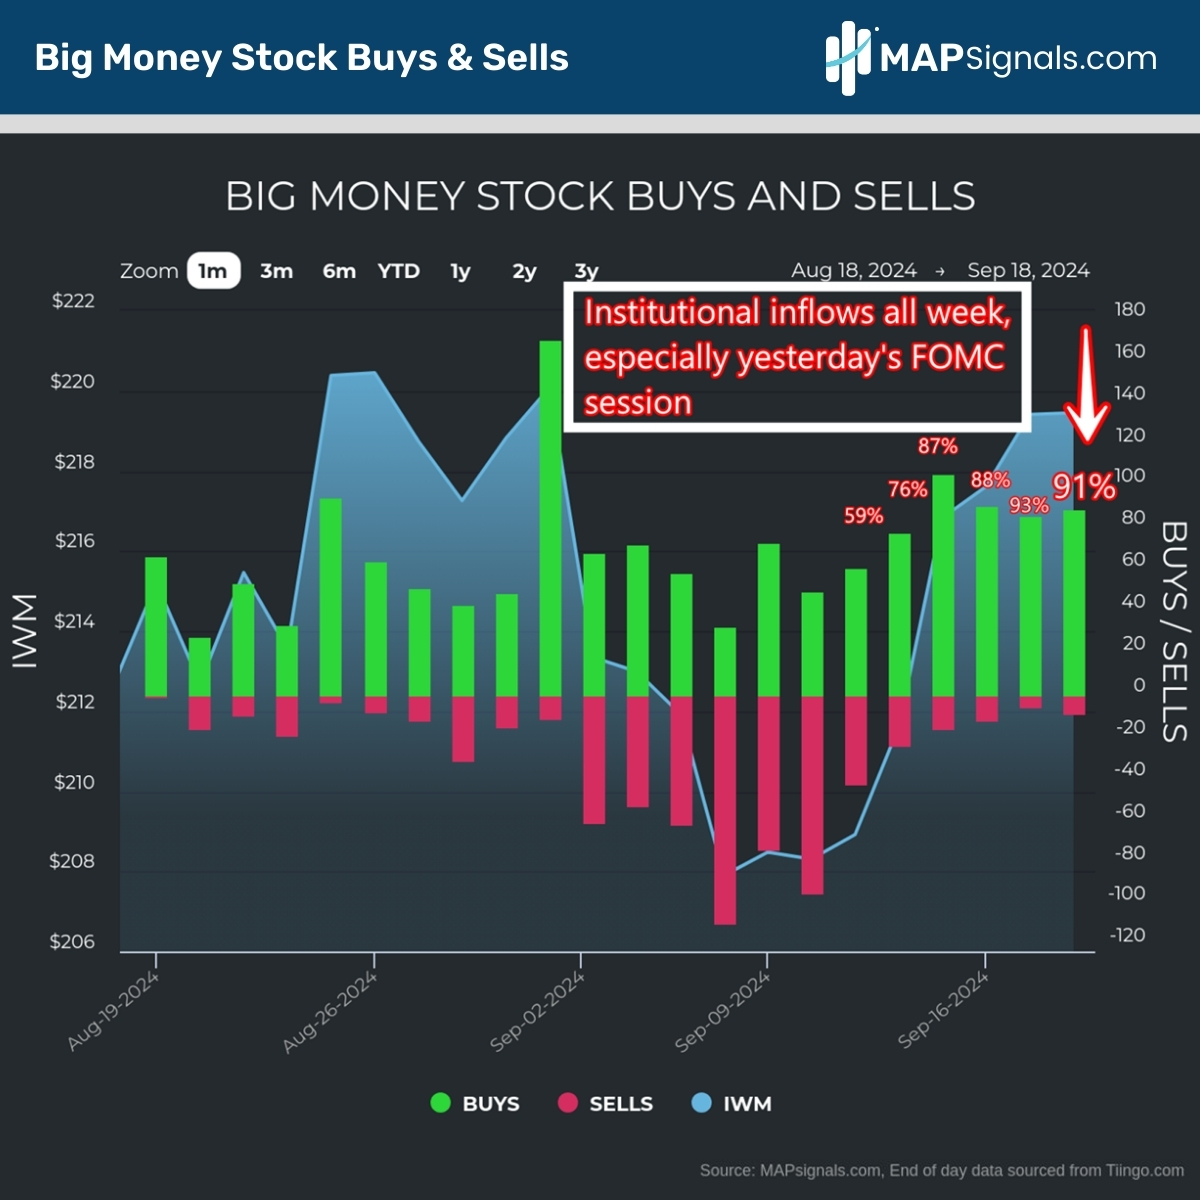
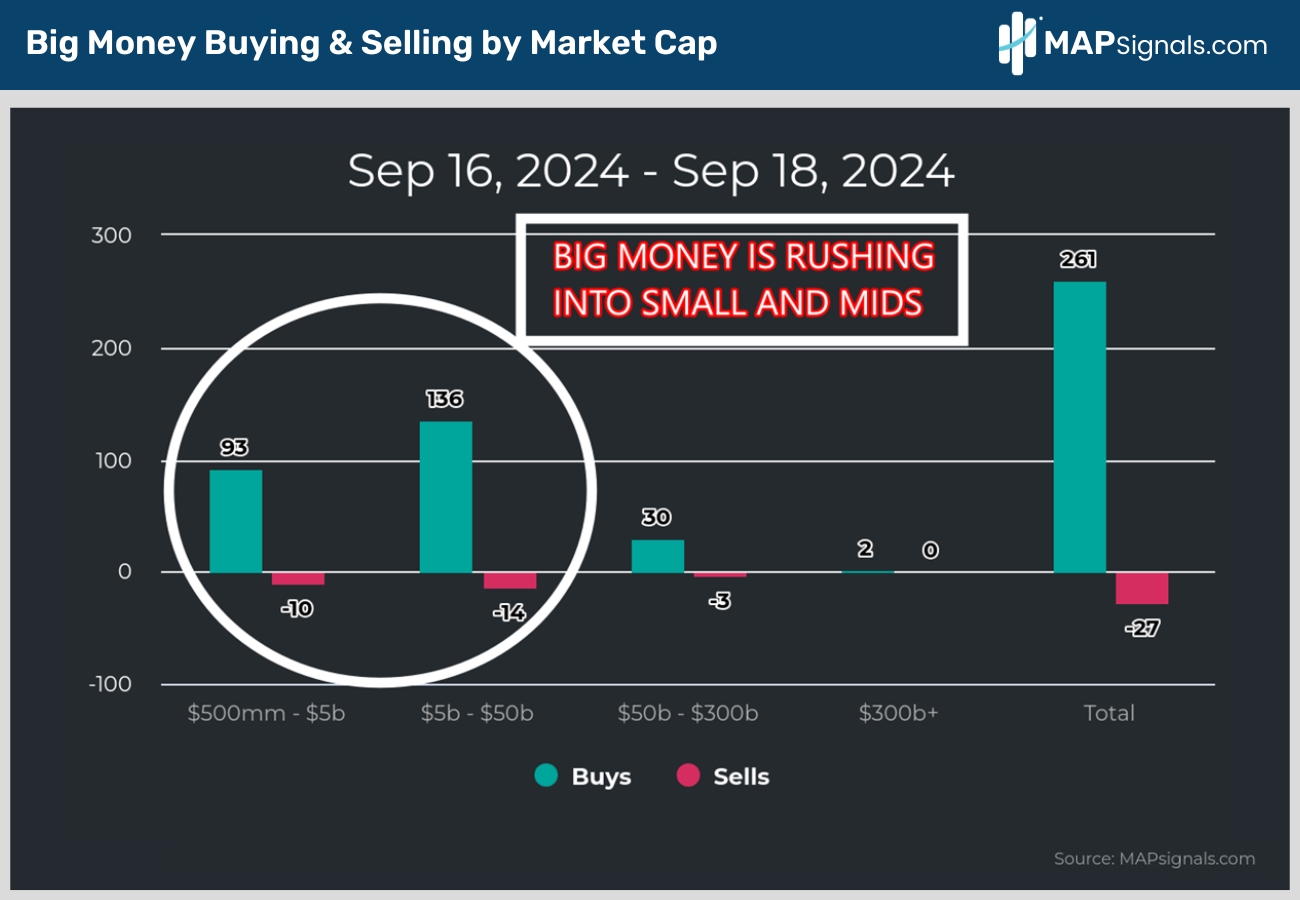
Given small- and mid-caps benefit most after the initial Fed rate cuts, it shouldn’t come as a surprise that this week’s inflows have been 88% in favor of stocks with market caps below $50 billion:
Let’s all say it together now – R.I.P. Bears!
We’ve been leaning into this theme for many months, and we aren’t shifting gears today. We’re doing something better.
Yesterday I spent a lot of time compiling the best stocks to own in this new rate-cutting environment.
This report showcases powerful equities with incredible businesses…and most importantly they are loved by institutions.
Can you invest without a MAP?
Maybe.
But I can’t recommend it!
Let’s wrap up.
Here’s the bottom line: Don’t fear rate cuts. Back to 1990, initial rate cuts saw the S&P 500 gain 7.7% 12-months later.
Even more impressive are the break-neck gains seen in small- and mid-caps back to 1995.
Couple this evidence with a surging BMI that’s heading North due to massive inflows into small- and mid-cap stocks, and there’s only one simple phrase that comes to mind: R.I.P. Bears!
If you’re looking for a champion stock list with names I’d bet you’re not familiar with, now’s a wonderful time to join MAP Signals as a PRO MEMBER.
As we enter the next phase of easier policy, don’t let your research fly blind.
Consult a map!