
2 Bear-Killer Signals are Here
Bulls are rebuked.
Pessimistic sentiment has reached climactic proportions.
That’s great news because 2 bear-killer signals are here.
Fear and worry have gripped investors to levels not seen since COVID. The crowd is deeply concerned that we’re facing a 2008 style event.
I can’t blame them. The media trots the doom-loopers out daily.
Instead of harping on how troubling the macro environment is right now, let’s take stock on the investing landscape. We’re in the midst of one of the deepest oversold levels seen in years.
Couple that with a monster seasonal tailwind and you’ve got healthy odds of a ferocious rally ahead…right when the crowd has thrown in the towel.
History casts a bright green light on markets in situations like now. The bears’ days appear numbered when you evaluate the evidence.
2 Bear-Killer Signals are Here
Trading on Wall Street taught me a couple of unforgettable lessons.
First, always respect the flow of money. Since late July the Big Money Index (BMI) collapsed from red hot overbought levels to a recent deeply oversold reading.
When institutions become net sellers, stocks have nowhere to go but lower.
Second, pay attention to extreme positioning. The most violent stock rallies occur after everyone has sold.
We’re witnessing history as the BMI is sitting at one of the lowest levels ever, indicating underweight equity positioning:
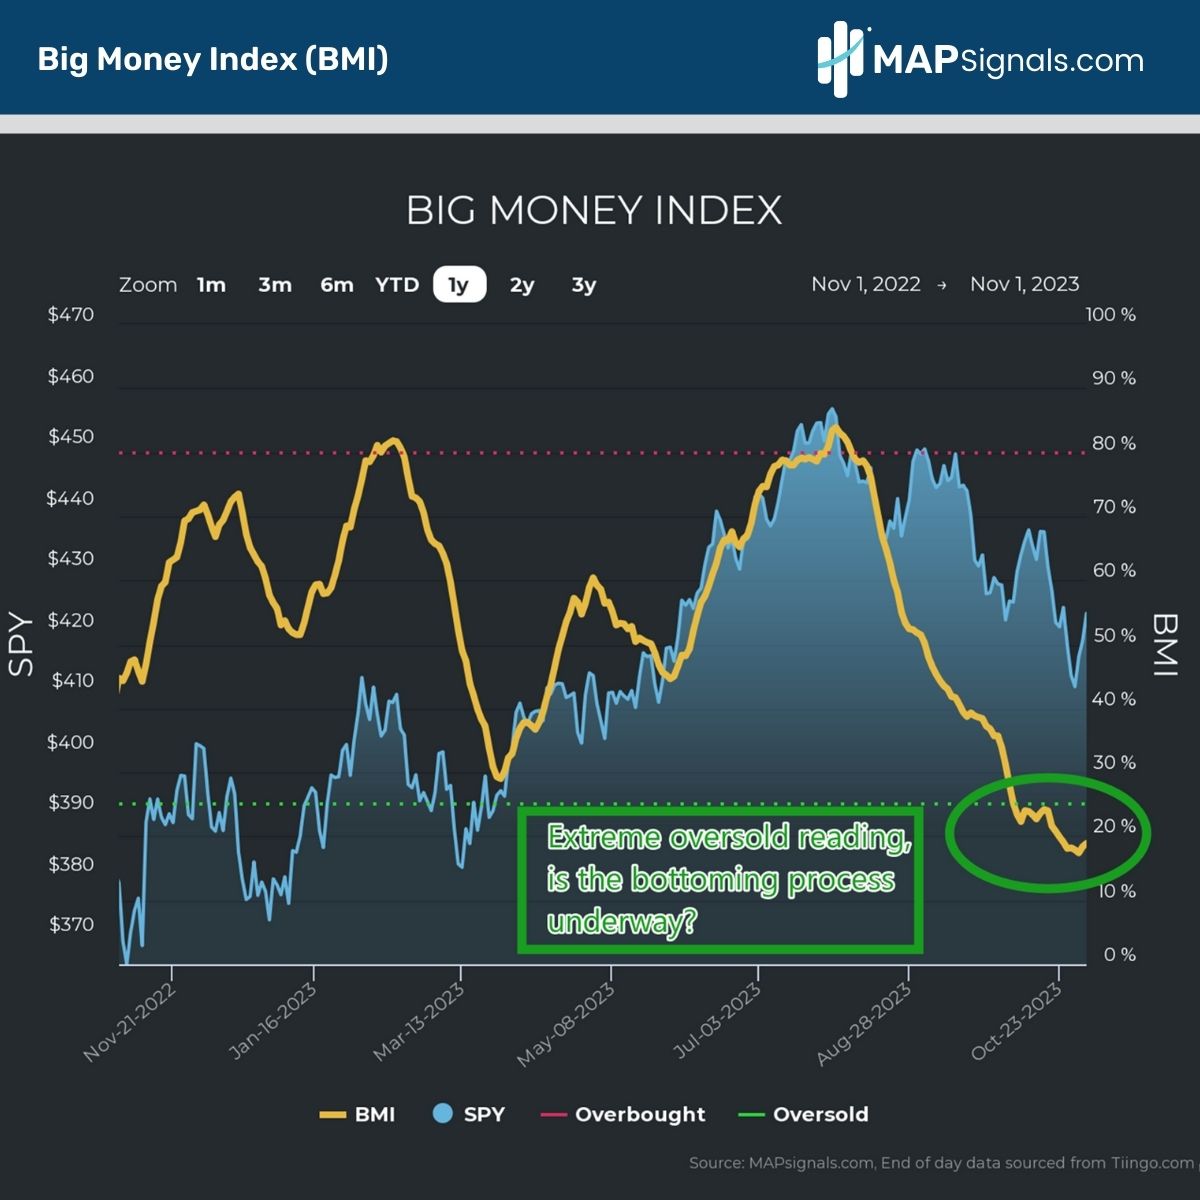
As you can see above, we are well below the 25% green oversold line. In fact, we recently broke below 19%, a level last reached during the COVID-19 crash.
Folks we are deeply oversold, a magnitude that rarely lasts forever.
While the crowd patiently waits for the next bear-rug-pull event to unfold, the BMI has actually perked higher recently. I believe a major bottoming process is underway.
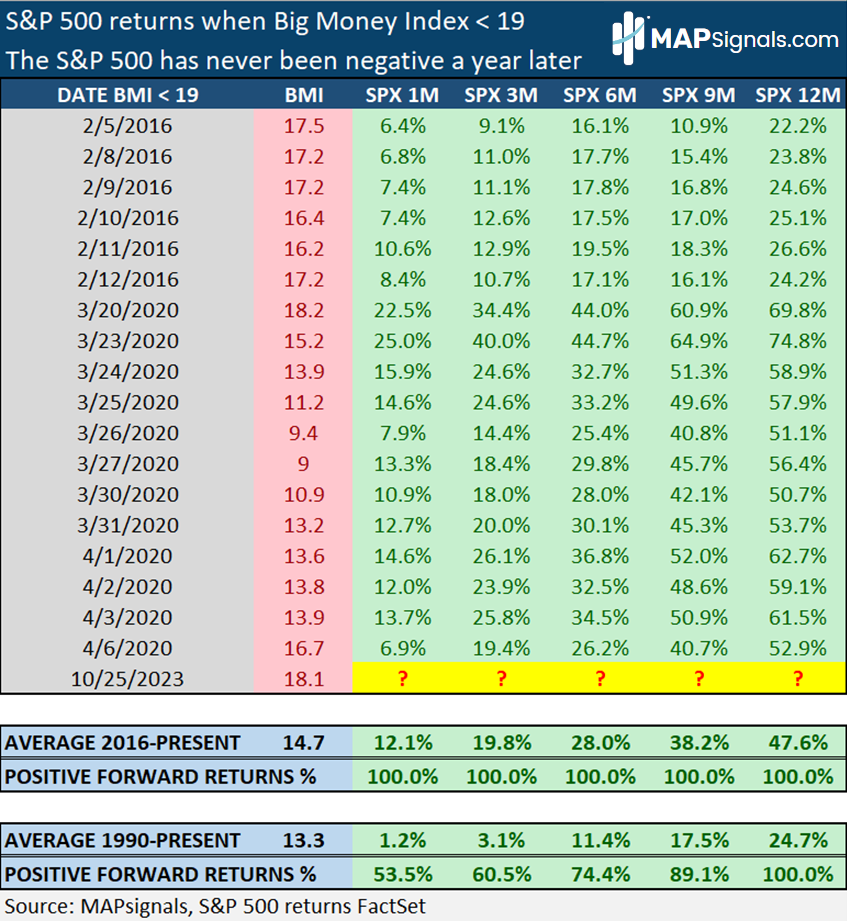
When you review history, you’ll see why. We went back and studied all instances when the BMI was below 19. The forward returns are eye-popping to say the least.
Since 2016, there’ve been 18 instances where we’ve clocked a sub 19 BMI reading. Incredibly, stocks are higher in all periods from 1 to 12 months later!
One year post this level of selling, the S&P 500 is up a mind-numbing 47.6%.
Now, clearly this dataset includes a healthy dose of recency bias as these rare events are due to 2 distinct periods: 2016 and COVID-19.
But don’t write off this signal.
Going back to 1990, a sub 19 BMI reading occurred 129 times. In bear-killer fashion, the S&P 500 was up an average of +24.7% a year later.
Even more striking, the positive hit ratio stands at 100%:
One word comes to mind when you look at that graphic: JUICE.
But this isn’t the only reason to be constructive on stocks. A mega seasonal tailwind is brewing now.
November Kicks Off Buying Season for Stocks
They say to sell in May and go away. Turns out there’s truth to this Wall Street adage.
Going back to 1990, in the 6-month period from May to October, stocks eke out barely positive gains.
That’s right. The latest +.62% returns from March to October in 2023 actually rhymes with history as the S&P 500 averages just +2.02% for this period.
That’s the unfortunate news.
The better news is November kicks off bear-killer season. In the 6-month period of November through April, the average gain for the S&P 500 more than triples to +6.7%:
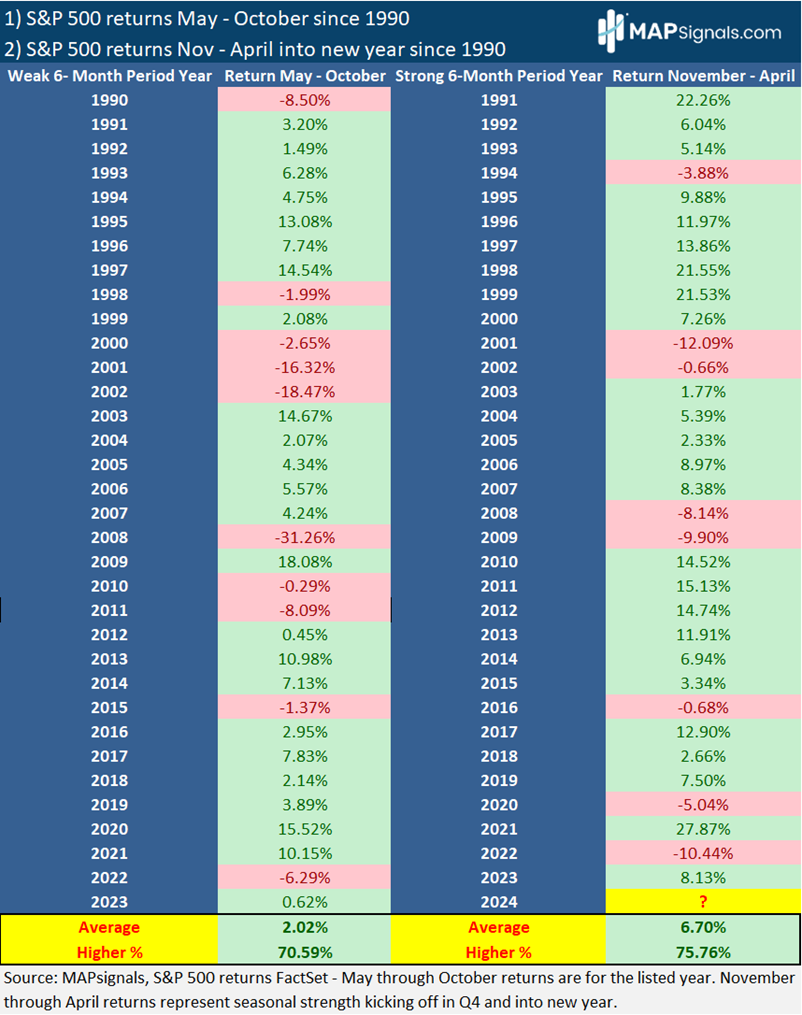
Not only are returns stronger beginning in November, the positive hit ratio climbs to 75%.
Couple seasonal tailwinds alongside deeply oversold conditions and I’ll say it again: 2 bear-killer signals are here.
And to throw another log on the bullish fire, yesterday’s rally showed outlier stocks under accumulation. This is a brand-new development.
The data suggests institutions are putting good money to work…shouldn’t you?
Let’s wrap up.
Here’s the bottom line: The bearish rhetoric is relentless, teeing up a favorable bullish setup. The BMI has sunk to levels that have signaled higher stock prices a year from now…100% of the time.
If that’s not enough to get you excited, November draws a line in the sand, kicking off major seasonal strength. From 1990, November through April more than triples the returns of May – October.
2 bear-killer signals are here.
This is when MAPsignals data-driven process shines.
New leading stocks are set to emerge…don’t be a sad bear and miss what’s coming.
By the time the media is shaking the bullish pompoms, the BMI will be well off the lows. The stock chase will be well underway.
We’re staring at one of the best setups seen in years.
Don’t get lost. Get a MAP!
If you’re a professional money manager or take investing seriously get started with a MAP PRO subscription.