A Case Of The Mondays
Volatility stinks. It always shows up like a thief in the night. Point is, get used to it. That’s what markets and stocks do.
Media headlines have been really awesome recently, too. I’m sure you’ve seen the Trade-War tweets, and something along the lines of “The VIX spikes 30% in a day!”, or how this is “late stage cycle activity.” If you’re really lucky, you’ve seen all three! But seriously, the media needs you to click those stories. After all, they’re in the business of selling ads…and advertisers love a lot of viewers.
The bottom line is this – the sky isn’t falling. So, what’s really going on?
Tariffs, Taxes, and Fundamentals
First, last Friday, President Trump increased tariffs on 200B worth of Chinese imports. Now, we see China is retaliating with 60B worth of tariffs on U.S. goods.
So get this, I found it interesting that over the past 12 months, according to some economists, the price of Chinese goods actually fell despite the initial 10% tariffs imposed by the U.S. last year.
This is likely due to China devaluing its currency, while the USD strengthened. These things offset the original tariff. Now, I don’t claim to be an economist, but maybe the headlines shouldn’t be as “tariffying” as they seem.
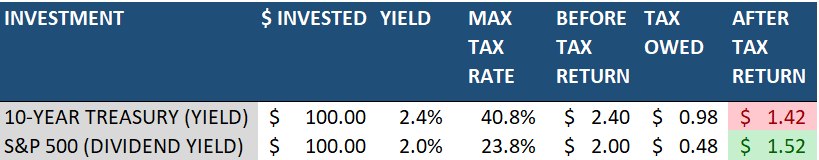
Next, yields are super low. The dividend yield on the S&P 500 is right around 2% and the yield on the 10 Year Treasury sits at 2.4%. Each is taxed differently. Dividends are taxed as long term capital gains, while Bond income is taxed as ordinary income. Looking below, you can make the case that wealthy investors will do better owning stocks compared to treasuries. Bottom line: capital should continue to flow into stocks.
Third: quarterly results are good. According to FactSet, for Q1 2019:
- 90% of the companies in the S&P 500 reported earnings
- 76% reported a positive earnings surprise
- 59% reported a positive revenue surprise
- Stock buybacks rose. Q1 saw $227B worth. Keep in mind that companies can wait to buy until prices fall.
- The blended sales growth rate for Q1 2019 was 5.3%
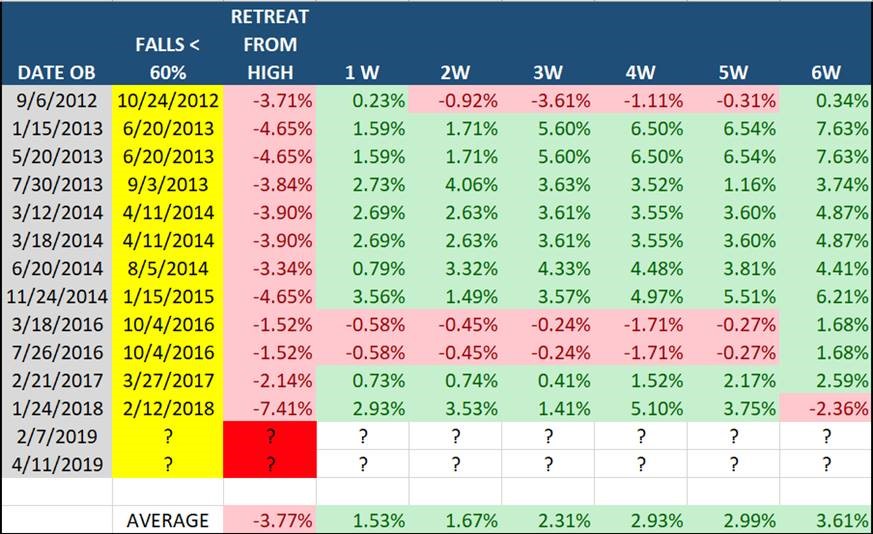
So, what does Monday’s selloff look like according to MAP? Weeks ago we were heavily overbought and since then selling has picked up. Our ratio fell fast. We’ve seen activity like this before. Looking back since 2012, there have been 12 times when markets went from heavily overbought (80%+ of stocks showing buying) and then fell to below 60% (similar to today). In general, this coincides with a nasty selloff, like the past few days.
Below are the prior times when this happened. The “Retreat From High” shows how far SPY fell from its closing peak. But more importantly, look at the 1-6 week performance after the ratio falls below 60%. That is a lot of green. We aren’t at 60% yet, but we are close.
Bottom line: A little bit of volatility is simply a case of the Mondays.