An Ultra-Rare Positive Omen Just Happened
Volatility is not only uncomfortable – it’s also unsettling.
Everyone everywhere wants to know when it will end. Well, we may have just gotten a small hint…

In the two prior trading days the QQQ (NASDAQ tracking ETF) had closes of -3% and +3.3% consecutively. Below you’ll see the past month and a half of trading returns for QQQ with Friday and Monday’s action highlighted in yellow:
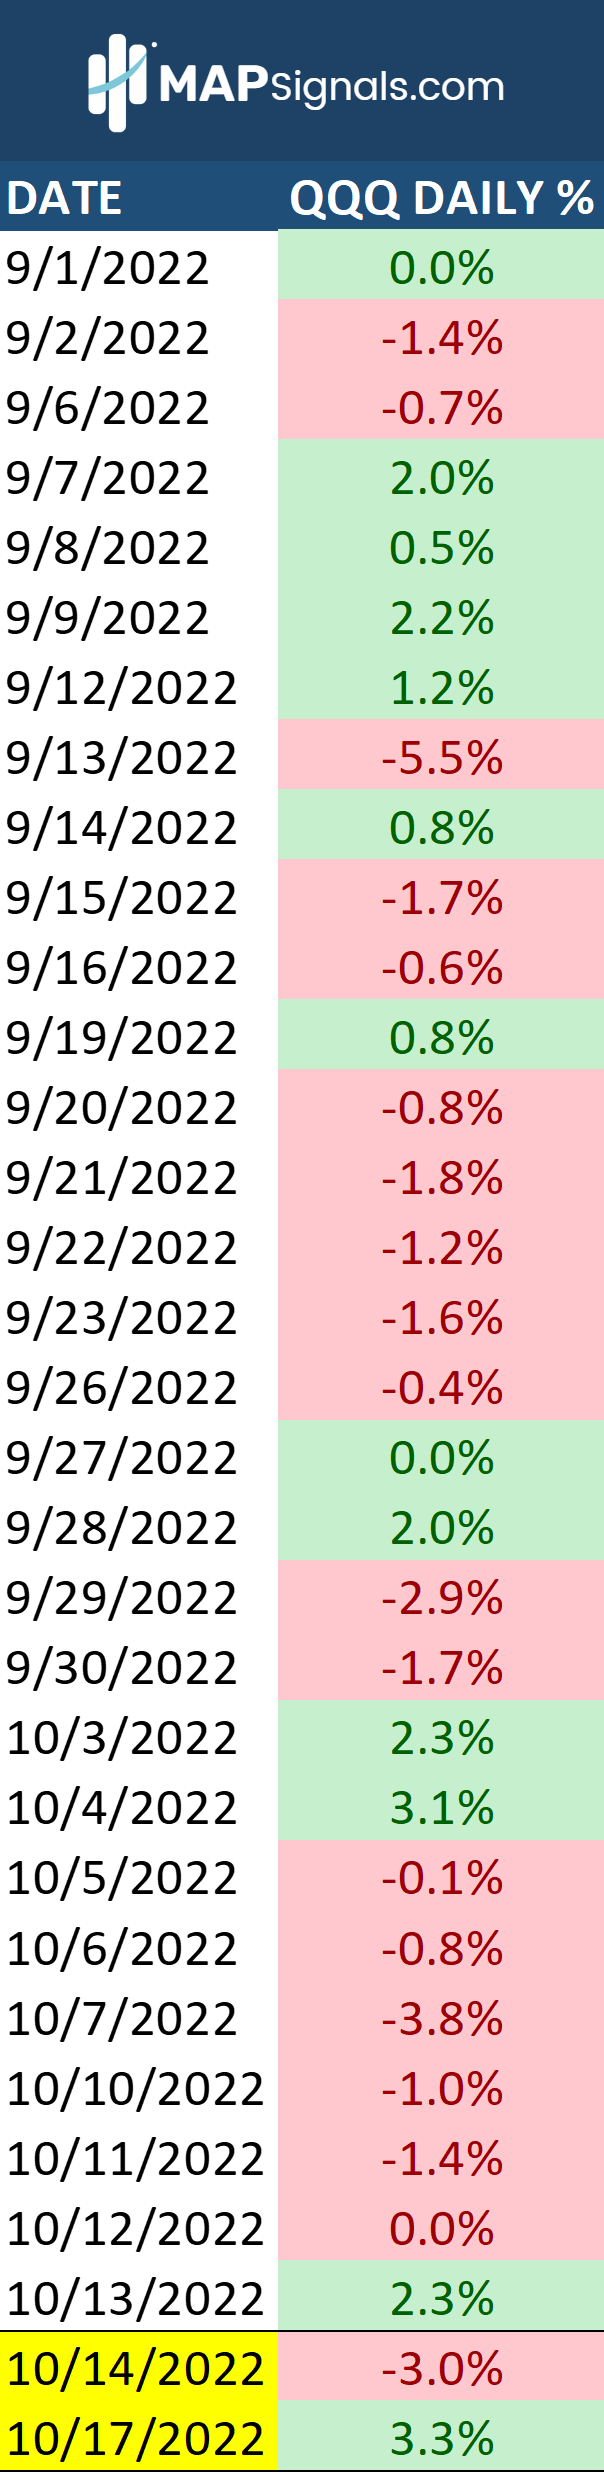
Data Source: Tiingo & FactSet
It is still volatile as I write this on October 18th. The trading session began over +2% which faded to +.7% right now.
Plus or minus 3% sounds like a lot, right? The answer is: it is a lot, but how much? I sought to put this in perspective by looking at the average daily move of the QQQ as far back as my data goes.
An Ultra-Rare Positive Omen Just Happened
To understand how volatile things have been, let’s start with an expected daily move for QQQ. It began trading March 10th, 1999. That gives us 5,942 trading days. The average daily return is 0.06% to be exact. That means on any given day we should expect the QQQs to rise 0.06%. Now, measuring the absolute daily move (making negative days positive), QQQ is expected to move 0.96% every day since the first day of its trading in 1999. This is basically the volatility measurement.
In the world of statistics and probabilities, an observance three times the expected outcome is a lot. Therefore a 3% actual move on the NASDAQ tracking ETF (more than 3 times the expected daily move) on any given day is very unusual. In fact, the QQQ posted a one day move of 3% or more a total of 483 times. That’s only 8.1% of the entire trading history. And even more rare are consecutive days of absolute moves of 3% or more – like last Friday and Monday. That has only happened 210 days out of 5,942, or 3.5% of the total trading history. That’s ultra-rare!
Now, some of those consecutive days happen more than two days in a row. For instance, during the pandemic in March of 2020, the QQQ posted 8 consecutive days of ± 3%:
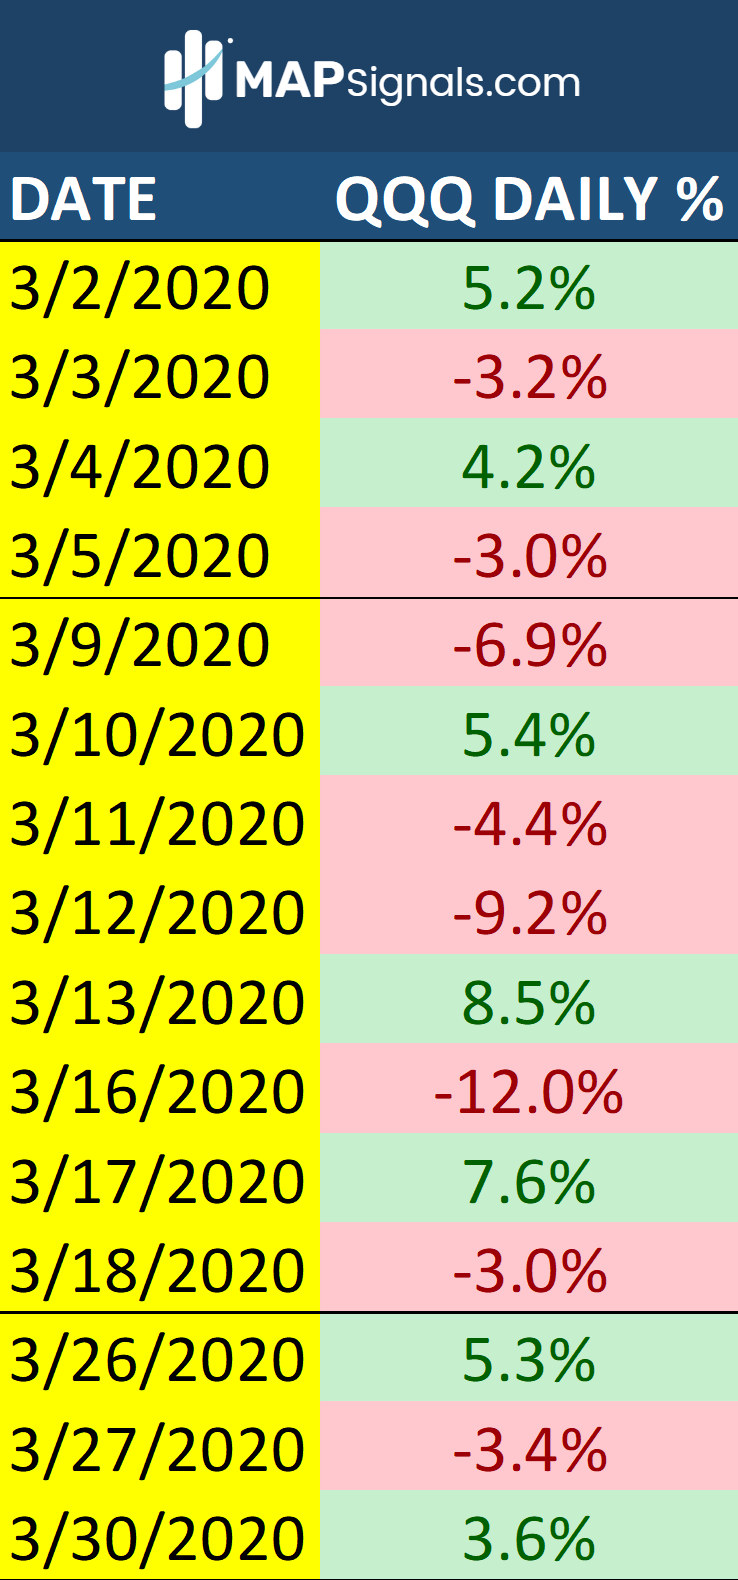
Data Source: Tiingo & FactSet
When we take periods of consecutive ± 3% days we arrive at 87 periods – or only 1.5% of the trading history. So, the recent up down is in fact – incredibly rare. I wanted to know what tends to happen after we see activity like this. The results weren’t promising at first…
I ran two sets of averages. First let’s look at the whole history. Here are the forward returns for QQQ after consecutive days of 3% absolute returns:

Data Source: Tiingo & FactSet
Ho-hum.
I suppose the only good news we could glean out of that, is that a year from now or two years from now we can expect the QQQs to be moderately higher.
But this is not a true representative of the market. This is because 61.5% percent of all these instances occurred prior to 20 years ago: October of 2002. Naturally it’s only fair to include this period of extreme volatility as a scientist. But remember: the QQQ began trading at the peak of internet speculation in maximum volatility. And once the Internet bubble burst, we were faced with 9/11 and a bout of accounting scandals for a serious financial crisis at the turn of the century.
So, I wanted to see what happens when we strip out that unusual time of QQQs’ infant years and look forward from October of 2002. These were the forward returns for the QQQ after consecutive days of 3% absolute moves since October 1 of 2002:
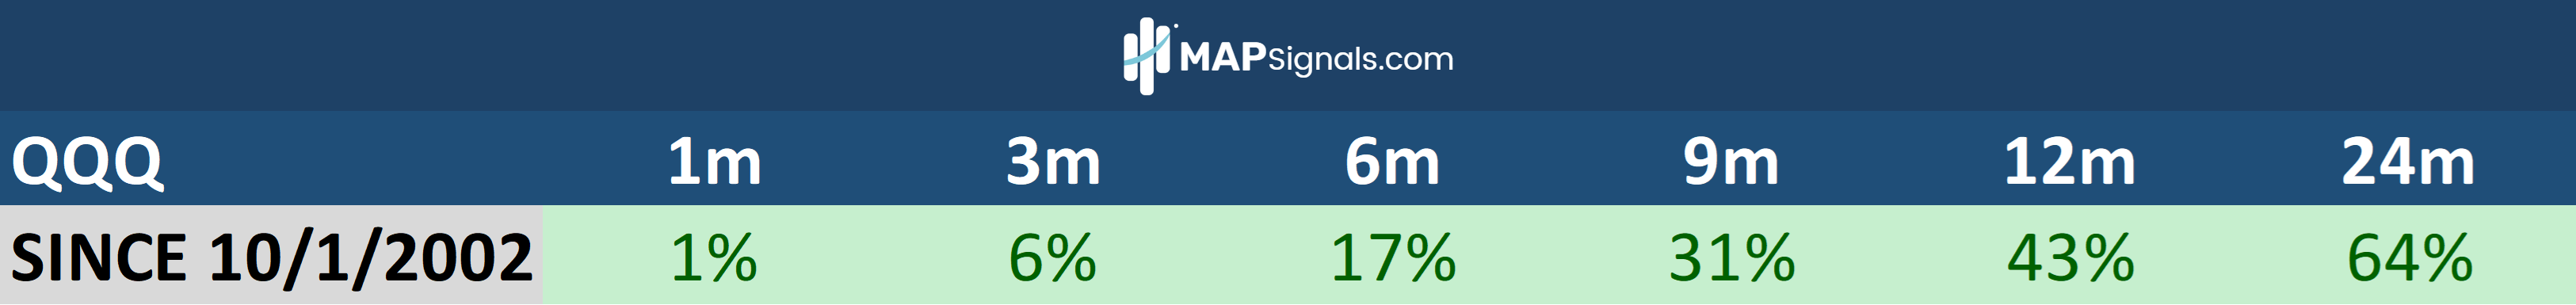
Data Source: Tiingo & FactSet
This is a much more accurate representation of a “normal” market. But don’t forget: this also includes the Great Financial Crisis, the COVID-19 pandemic, and all the other minor scares along the way such as Greek debt, Ebola, the Russian invasion of Ukraine, etc.
I should add that average positive returns weren’t just skewed by big returns either. Here is how it broke down after the 31 periods were observed. The tech fund is up on average in all forward instances from 1-month to 24-months:
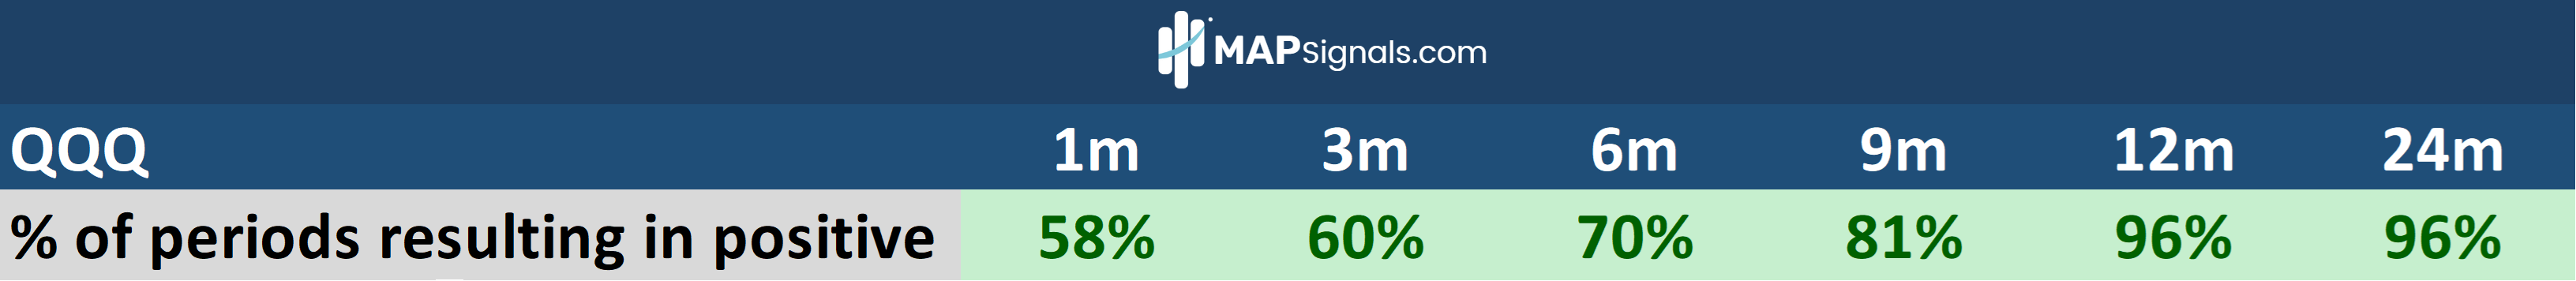
Data Source: Tiingo & FactSet
So, the ultra-rare ± 3% consecutive days in the QQQ just happened. And the above history suggests you should cheer up… because odds are very strong for higher prices as soon as 1 month from now. The data keeps piling up: We are near the bottom.
Have a great evening!
JB