• Menu
  • Skip to right header navigation
  • Skip to main content
  • Skip to primary sidebar
  • Skip to footer

MAPsignals

We map big money.

  • Latest Insights
  • Power of MAP
    • MAP Products
    • MAP System
    • White Papers
    • Videos & Interviews
    • Big Money Podcast
  • Profit with MAP
  • About
    • About MAP
    • MAP Team
    • MAP System
    • MAP Products
    • Big Money Index
  • Members
    • Get Started With MAP
    • My MAP
    • MAP View
    • MAP Options
    • MAP Top 20 Weekly
    • MAP 50
    • Members Only Posts

Baton Rouge Stock Market

February 25, 2020 //  by MAPsignals Staff//  Leave a Comment

In French, baton rouge means red stick.

In Louisiana, French explorer, Iberville, was moving along the Mississippi River when he saw a stick that appeared red. He named the region, Baton Rouge.

That red stick marked a boundary for local Native American tribes.

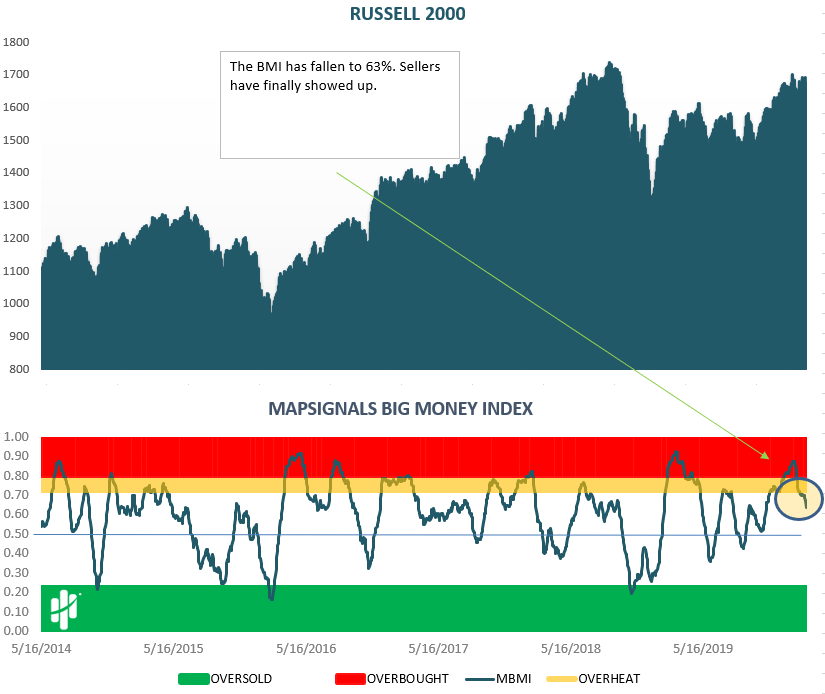
Big Money Index Says Sellers Are In Control

For Mapsignals, a red stick also means a boundary. On January 30, we wrote how our data is changing. Selling is picking up.

Our Big Money Index has a big red stick on it. It acts like a boundary in our research. Typically you don’t want to add stocks in that area. You want to wait for a pullback.

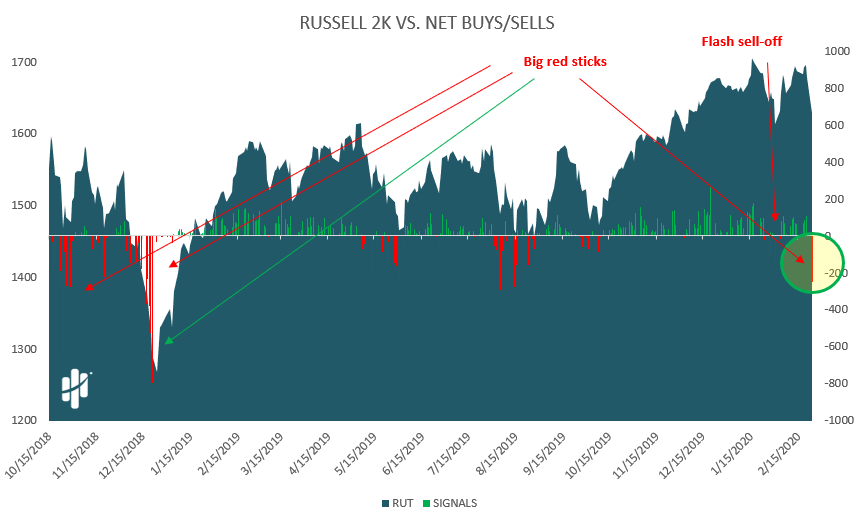
Now, we can take it a step further and see how big the selling was yesterday. The takeaway is how big selling usually brings more big selling.

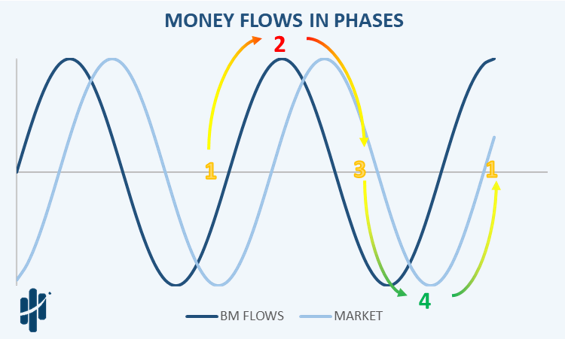
The Big Money Flows in Phases

So, where are we in the stream of things? Here’s how the big money flows:

  1. Big money rushes in and selling is non-existent (where we were for months…think FOMO)
  2. Big money buying slows and selling picks up a bit (that’s where we’ve been the last few weeks, until yesterday)
  3. Big money buying slows further and selling grows – (this is when the BMI starts falling towards 50% and lower. We are approaching this phase)
  4. Big money buying is gone, and sellers are in control – (this is when the media blasts bear articles…it’s when you want to get those buy tickets out)

It looks like this:

So, what’s the game plan?

Once we break below 50% -I get excited. That’s when many professional investors are forced to sell stocks because they get the tap on the shoulder from their risk manager.

Let’s embrace the pullback and be patient. Embrace the red stick.

Bottom line: Like many of us, you may have missed the train of selling that happened at the end of January. It was like a flash sell-off, lasting just a day.

We will keep our cool and focus on patience and process like we discussed last week.

Right now it’s a red train approaching the platform.

When the attendant yells, “tickets please!” We’ll be showing our tickets… and you can bet they won’t be sell tickets.

Spread the word!

Category: All, Big Money Insights Weekly, Special Reports

Previous Post: « Repeating Success
Next Post: Time To Go Fishing »

Reader Interactions

Leave a Reply Cancel reply

Your email address will not be published. Required fields are marked *

Primary Sidebar

Get Big Money Insights for FREE

Want to know where the Big Money is headed?

Just enter your email address below. You'll get our FREE NEWSLETTER sent directly to your inbox. 

 We call it Big Money Insights... It’s your weekly sneak peek at the powerful market-moving forces that are hidden from 99% of investors.

Categories

  • All
  • Big Money Insights Weekly
  • Big Money Series
  • MAP 50
  • MAP In The Media
  • Members Only
  • Performance
  • Podcast
  • Special Reports
  • Stocks
  • Videos & Interviews
  • White Papers

Archives

  • January 2021
  • December 2020
  • November 2020
  • October 2020
  • September 2020
  • August 2020
  • July 2020
  • June 2020
  • May 2020
  • April 2020
  • March 2020
  • February 2020
  • January 2020
  • December 2019
  • November 2019
  • October 2019
  • September 2019
  • August 2019
  • July 2019
  • June 2019
  • May 2019
  • April 2019
  • March 2019
  • February 2019
  • January 2019
  • December 2018
  • November 2018
  • October 2018
  • September 2018
  • August 2018

Footer

© 2020 Mapsignals.com

  • Home
  • Contact
  • Privacy Policy
  • Terms & Conditions
  • Cookie Policy (US)
  • FAQ

Copyright © 2021 · Mai Law Pro on Genesis Framework · WordPress · Log in