Big Money Buying Slows To Key Level
We prepared you for August volatility. We started telling readers in July, but this morning something happened. The Mapsignals Big Money Index (BMI) breached a key level – 45%. You may remember that this means we expect to see lower market prices near-term. Basically, selling overtook buying and pushed our index down below 45%. But don’t worry, it’s nothing more than the 7th inning stretch. Our data says that the bears’ days are numbered. Selling is starting to exhaust itself.
So, what’s next? Historically we tend to be close to the end of a market pullback once the index falls below 45%. On average, it takes 13 days until the bottom. The average pullback is -5.45%.
As we’ve said before: get your buy list ready. History says the recovery will be fast.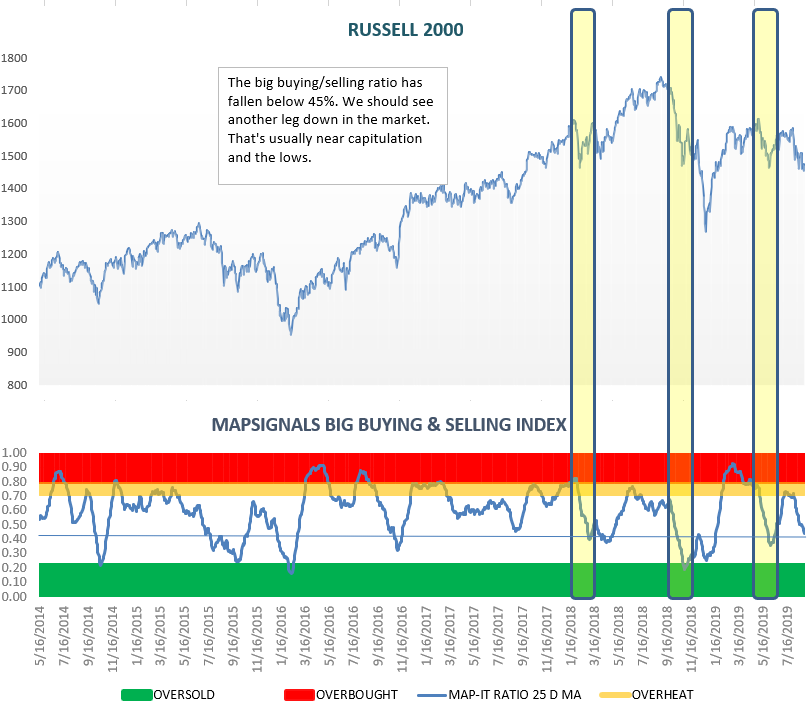
BOTTOM LINE: The Mapsignals Index has guided us before: we think the bears’ days are coming to an end. Follow the big money and get your buy list ready.