• Menu
  • Skip to right header navigation
  • Skip to main content
  • Skip to primary sidebar
  • Skip to footer

MAPsignals

We map big money.

  • Latest Insights
  • Power of MAP
    • MAP Products
    • MAP System
    • White Papers
    • Videos & Interviews
    • Big Money Podcast
  • Profit with MAP
  • About
    • About MAP
    • MAP Team
    • MAP System
    • MAP Products
    • Big Money Index
  • Members
    • Get Started With MAP
    • My MAP
    • MAP View
    • MAP Options
    • MAP Top 20 Weekly
    • MAP 50
    • Member Updates
    • Platinum Updates
    • Members Only Posts

Bull Crossing

October 17, 2019 //  by MAPsignals Staff//  Leave a Comment

Last Friday, the big money did something that historically means the bulls are ready to run.

You see, the story of the market’s future, is like many things, often written in the past.

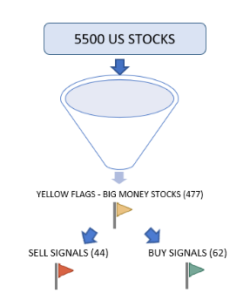
We scan 5,500 stocks each day and get “yellow flags.” This is when big money is moving in or out of stocks in a big way.

A yellow flag is one step below a buy (green flag) or sell (red flag) signal. To get those, you need an extra high-price or low-price relationship with volume to become a buy or sell.

Out of all those stocks, we only get a handful of yellow, green, and red flags. We have 30 years of data, but looking back the last 10 years, we normally get 477 yellow flags every day. The average green flag buys are 62, and red flag sells are 44. Out of those buys and sells, we gather them up for a week and sort by score. That’s how we find the best stocks.

Last Friday we had a big stock market rally with 666 yellow flags- that’s 40% more than the 10-year average, or 2,518 trading days. But we only had 40 green buy flags- that’s 35% below average. Does that mean the market approval of the China news is just another head-fake to ignore?

Well, we looked back over the past 10 years at days where we got higher than average yellow flags and lower than average green flags, on an up day in the market: just like Friday October 11th. There were 140 times since October 12th 2009. The average rise on those 140 days was +0.96%. What we saw made our eyes grow wide.

Here it is summarized in a table:

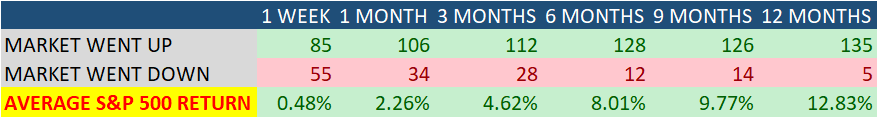
It tells us that a big short cover rally like Friday looks great for the market. The average return for all 6 time frames is positive. And hard to believe as it may be, the S&P 500 was up a year later 135 out of 140 times averaging 13%. That’s 96% of the time.

Since Friday’s close, the S&P 500 is +1%.

Bottom Line: Looking back, history says the bulls are ready to run.

Spread the word!

Category: All, Big Money Insights Weekly, Special Reports

Previous Post: « How We Buy On Dips
Next Post: Best 5G Stocks »

Reader Interactions

Leave a Reply Cancel reply

Your email address will not be published. Required fields are marked *

Primary Sidebar

Get Big Money Insights for FREE

Want to know where the Big Money is headed?

Just enter your email address below. You'll get our FREE NEWSLETTER sent directly to your inbox. 

 We call it Big Money Insights... It’s your weekly sneak peek at the powerful market-moving forces that are hidden from 99% of investors.

Categories

  • All
  • Big Money Insights Weekly
  • Big Money Series
  • MAP 50
  • MAP In The Media
  • Members Only
  • Performance
  • Podcast
  • Special Reports
  • Stocks
  • Videos & Interviews
  • White Papers

Archives

  • March 2021
  • February 2021
  • January 2021
  • December 2020
  • November 2020
  • October 2020
  • September 2020
  • August 2020
  • July 2020
  • June 2020
  • May 2020
  • April 2020
  • March 2020
  • February 2020
  • January 2020
  • December 2019
  • November 2019
  • October 2019
  • September 2019
  • August 2019
  • July 2019
  • June 2019
  • May 2019
  • April 2019
  • March 2019
  • February 2019
  • January 2019
  • December 2018
  • November 2018
  • October 2018
  • September 2018
  • August 2018

Footer

© 2020 Mapsignals.com

  • Home
  • Contact
  • Privacy Policy
  • Terms & Conditions
  • Cookie Policy (US)
  • FAQ

Copyright © 2021 · Mai Law Pro on Genesis Framework · WordPress · Log in