
Buy the Dip Now
The S&P 500’s slump into a correction has been swift. The index only took 16 trading days to fall 10% from its February 19 all-time high.
Other than 2020’s epic Covid collapse, that’s among the S&P’s fastest corrections ever. And most high momentum growth stocks have been hit much harder.
After a couple of years of epic gains, many investors have forgotten what it’s like to lose money, making the recent drop even more painful.
Fear not. Buy the dip now.
Today, we’ll show you three data-rich reasons this is a buyable dip and not the start of an ugly bear market. Then, we’ll screen the S&P 500 to find the 20 most battle tested stocks to help you weather this drawdown and profit on the other side.
3 Reasons to Buy the Dip Now
Corrections are never fun, especially when big losses pile up quickly. It’s easy to get emotional and make mistakes.
History can help keep you cool:
Reason #1 to buy the dip is that since 1980, stocks have averaged 10% annual gains despite suffering a median annual drawdown of 14% (chart).
Don’t equate volatility with losing money. Stocks pull back every year but still finish in the black 70% of the time with juicy gains.
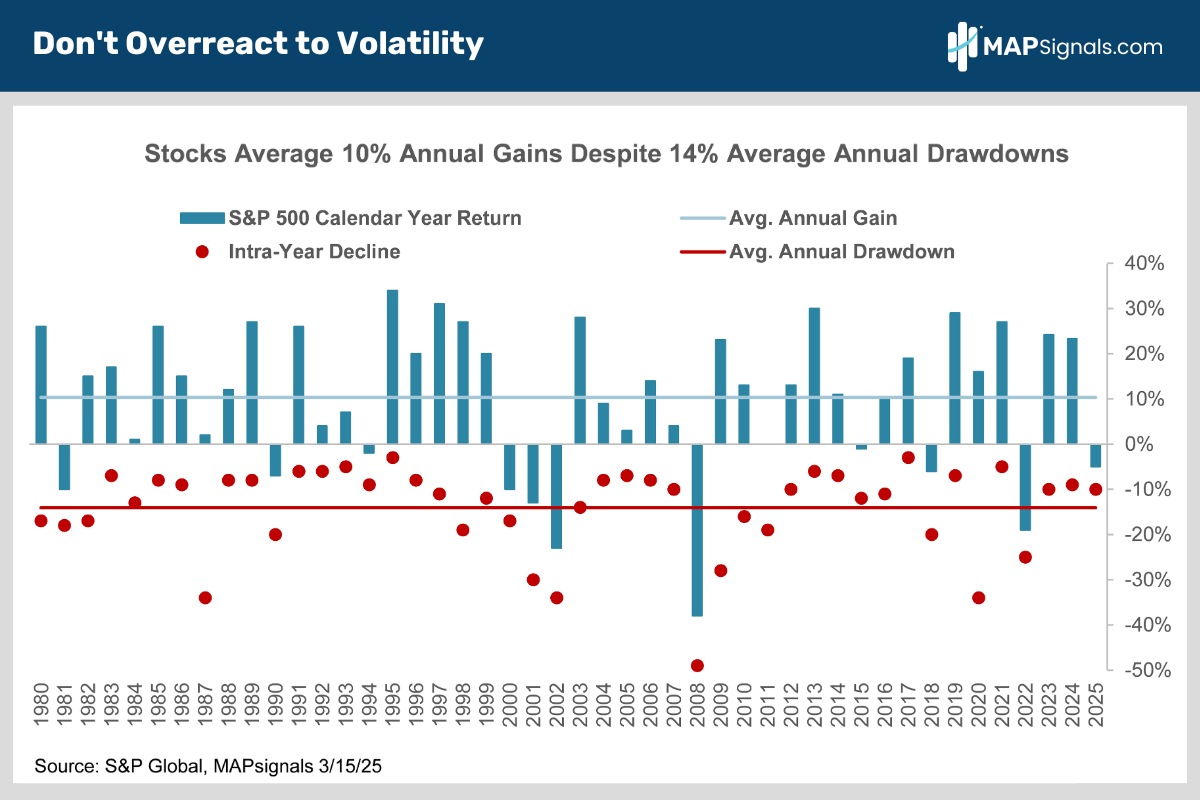
Pullbacks are part of the investment process. They aren’t a harbinger of doom.
Let’s now shift to another reason to be constructive.
Corrections are Short and Shallow When the Economy Dodges Recession
How low will we go? It’s what everyone wants to know.
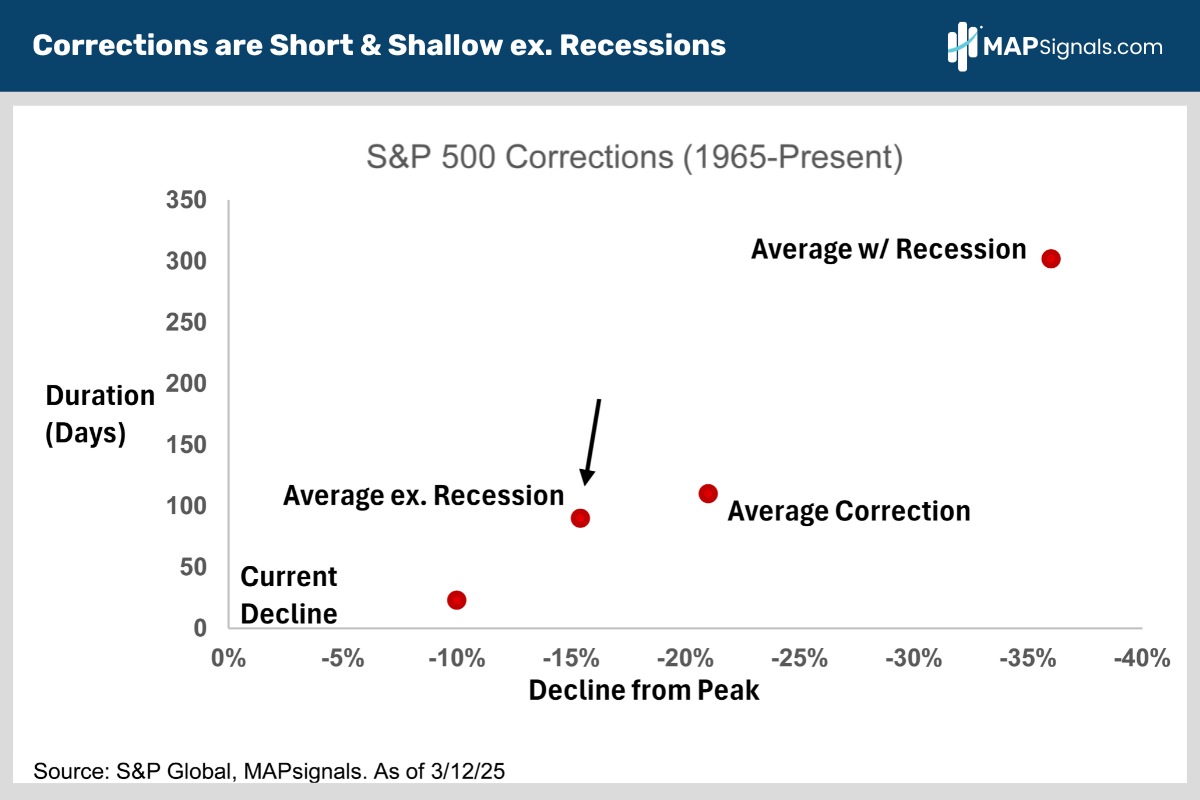
To find out, we analyzed every S&P 500 correction going back to 1965.
It turns out that when the economy dodged a recession, stocks fared best, averaging 15.4% declines that lasted a little over three months.
Conversely, when the economy fell into recession, market declines were far deeper, averaging 36% and lasting three times as long (chart).
The good news is a lot of damage has been done.
The better news is that fading recession fears has been the winning ticket the last few years:
Let’s now dive into the scariest word on Wall Street: Recession.
Reason #2 to buy the dip is that a recession is unlikely.
Back in 2023 everyone on Wall Street thought we were headed for a surefire recession. Those fears persisted well into 2024. Regular readers know we were never in the recession camp.
Here’s why:
Consumption represents roughly 70% of US economic activity.
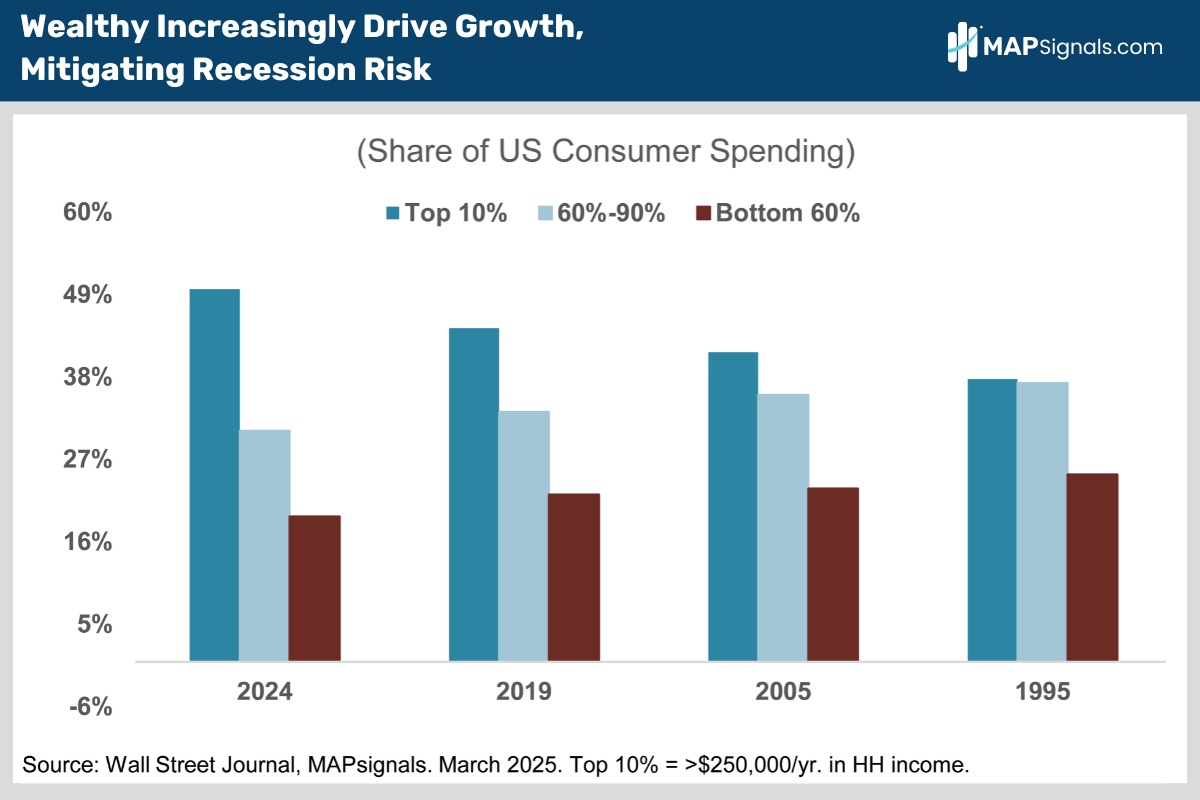
We figured out earlier than most that the wealthy are driving an ever increasing share of overall US consumer spending.
The top 10% of households by income now account for half of all consumer spending, up from only 38% in 1995 (chart).
A bet on a recession is essentially a bet that wealthy Americans will pull back on their lifestyles sharply.
While possible, it’s highly unlikely now. After all, the labor market remains strong with weekly jobless claims at 240K vs. a recession average of 400K.
Wall Street still expects 1.5% to 2% 2025 real GDP growth.
Americans love to shop and the wealthy always have the money to do it.
That’s left the US economy structurally less vulnerable to recession than in the past.
While the consumer drives the US economy, it’s important not to ignore the corporate sector.
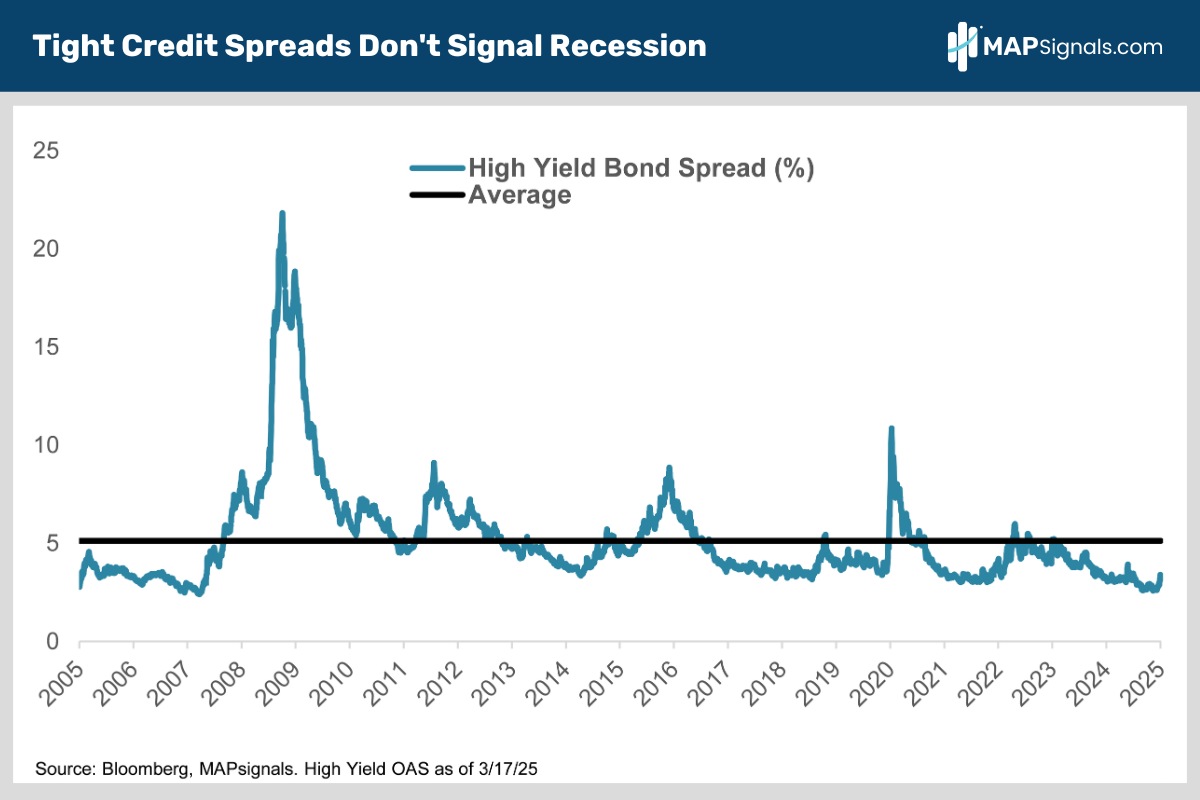
On that front, a look at high-yield credit spreads shows little sign of recession.
Spreads are nearly record tight at 3.4% above comparable Treasury yields vs. their 20-year average of 5.1% (chart).
If the economy were really on the verge of cracking, you’d see much greater spread widening…indicating heightened risks.
The pros aren’t worrying too much about a recession and neither should you.
Speaking of you, I’m sure you are aware of the sour feelings investors share right now. It’s been all over the headlines recently.
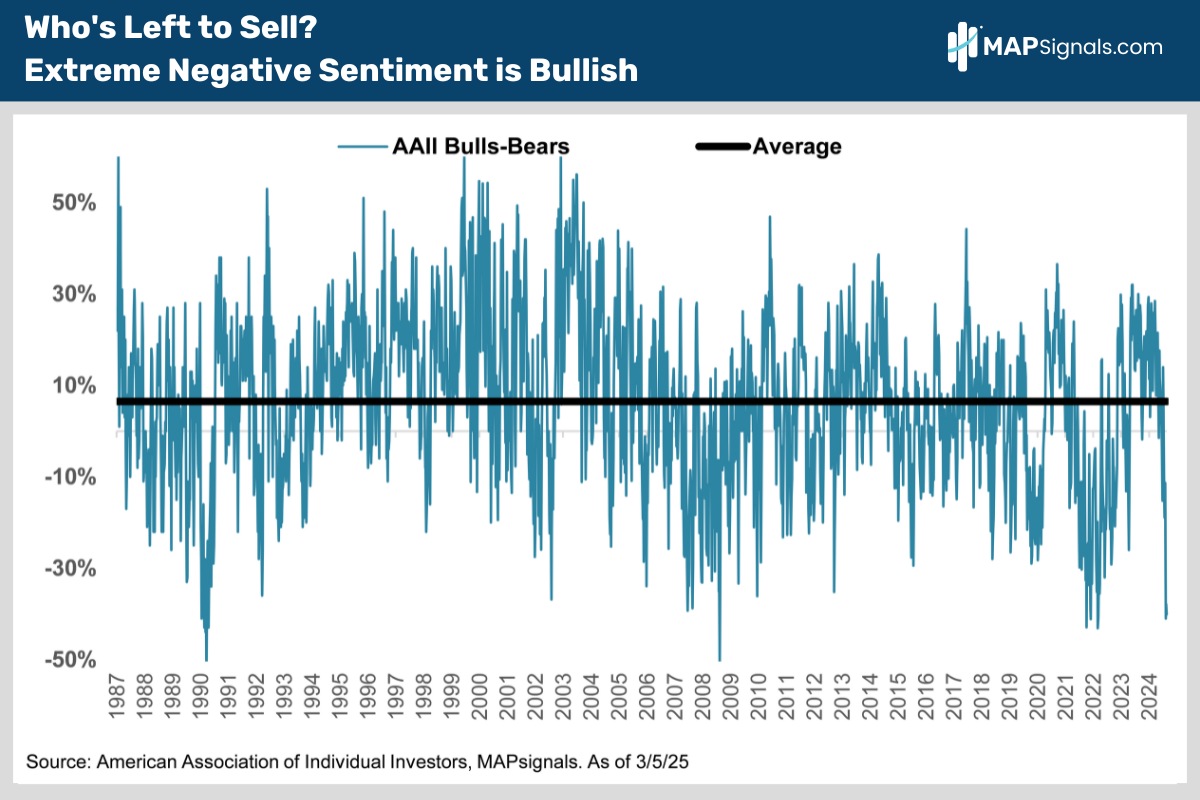
Reason #3 to buy the dip is extremely bearish sentiment.
The American Association of Individual Investors (AAII) surveys its 2 million members to see how they’re feeling about stocks.
We track the 4-week average of bullish minus bearish sentiment readings. It’s averaged 6.5% since 1987.
The latest reading has bears swamping bulls by 40%, among the weakest prints in 40 years:
Here’s the best part about such a lousy reading:
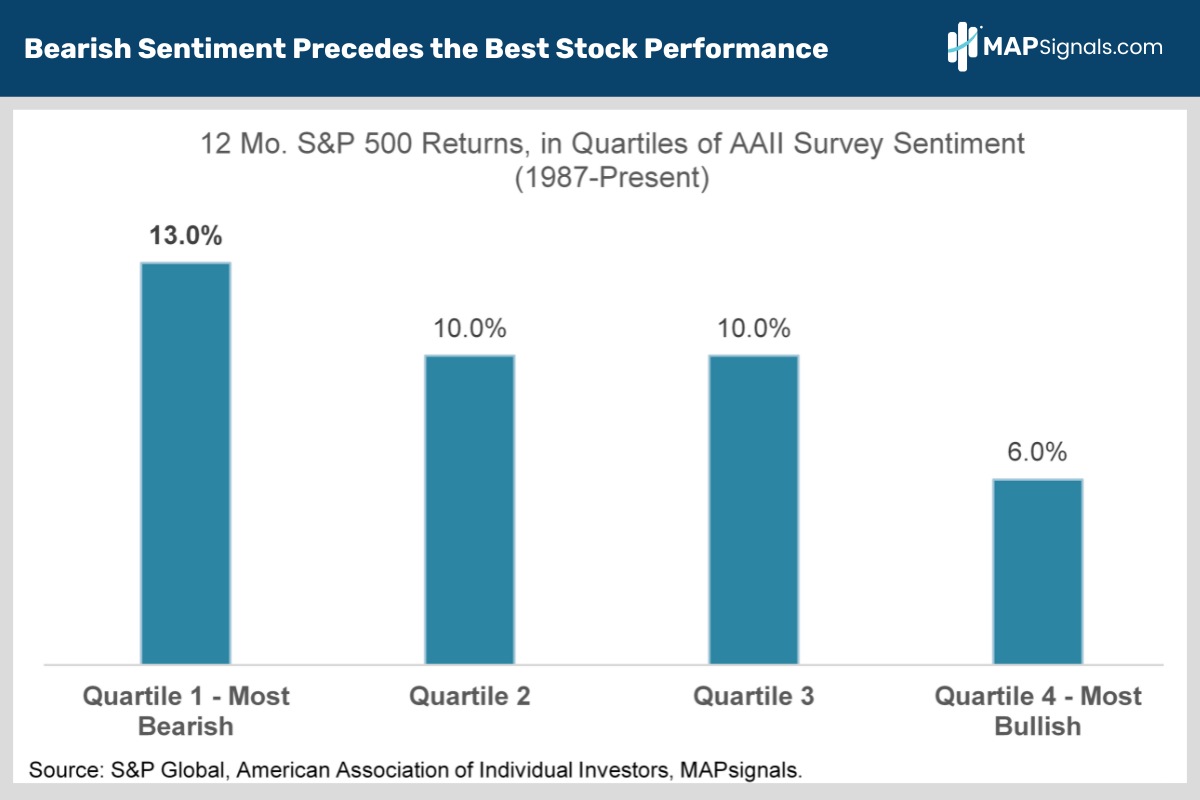
Since 1987, the S&P 500’s best performance has come in years following really bearish sentiment readings like what we’re seeing today.
The S&P has averaged a 13% gain in the 12 months following top quartile, bearish AAII sentiment survey readings.
Conversely, the index has only gained 6% in years following the most bullish sentiment readings (chart).
Let’s say it again. Deals are here.
Get your list ready and buy the dip now!
How to Tilt Your Portfolio
The biggest performance theme in the stock market this year is the underperformance of 2024’s momentum darlings - most notably the Magnificent 7 - as the stock market finally begins to really broaden out.
The S&P 500 Equal Weight Index is outperforming the S&P 500 sharply YTD thanks to its much lower weighting to big tech.
We screened the S&P 500 for the 20 stocks with the highest MAP Scores that incorporate both fundamental and technical factors.
Not surprisingly, there isn’t a single big tech stock on the list. Instead, it’s full of under the radar, high quality names from outperforming sectors like financials, industrials and health care.
We think these high-quality stocks represent the best way to navigate a choppier stock market without trading away upside when this bull market resumes its upward charge.
This stands in stark contrast to overweighting defensive sectors. Staples, utilities and pharma offer downside protection but leave you largely sidelined when the market rebounds.
If you aren’t a PRO member, and are a serious investor, get started today to access the below report. It’s a beauty!
High-quality companies aren’t just more profitable, their earnings are more reliable and steadier than their low-quality peers.
In addition, they sport low debt to equity ratios and strong balance sheets, enabling consistent dividend growth.