• Menu
  • Skip to right header navigation
  • Skip to main content
  • Skip to primary sidebar
  • Skip to footer

MAPsignals

We map big money.

  • Latest Insights
  • Power of MAP
    • MAP Products
    • MAP System
    • White Papers
    • Videos & Interviews
  • Profit with MAP
  • About
    • About MAP
    • MAP Team
    • Authors
    • MAP System
    • MAP Products
    • Big Money Index
  • Members
    • Get Started With MAP
    • My MAP
    • Big Money Charts
    • MAP View
    • MAP View Options
    • MAP Top 20 Weekly
    • MAP 50
    • Member Updates
    • Platinum Updates
    • Members Only Posts
    • Performance
  • Portal

Climate Change Market

April 9, 2020 //  by Lucas Downey//  2 Comments

If you want to divide a room, take a poll on climate change.

If you want to divide a room, take a poll on “will we retest the lows?”

Wherever you stand on either of these issues shouldn’t matter.

What does matter is that the climate in the market is changing – have a look.

Market Internals Are Improving

As you know, we follow the big money. We were deeply oversold – which is extremely rare.

Those are times to go fishing for great sales.

But now, the climate is shifting – look how the Big Money Index is rising like a phoenix from the ashes.

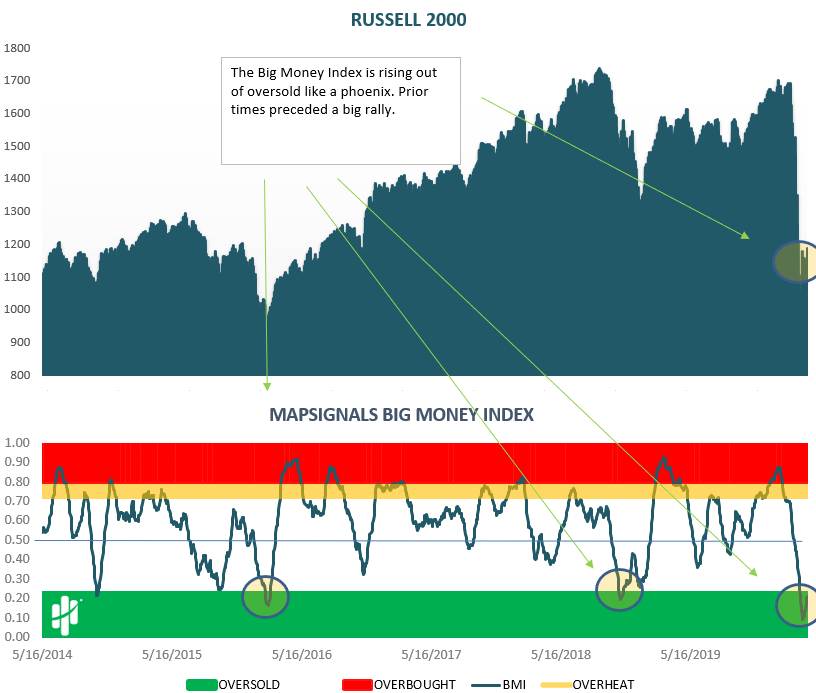
We circled prior times when the BMI began to rise out of oversold conditions.

Typically you want to be on the right side of that trend.

If we zoom in on daily action, you can see a massive climate change.

Monster selling came, then it slowed, and now a few green seedlings are sprouting.

The below chart shows the net buys/sells for the market each day.

Green bars show there were more buyers, red bars mean sellers are in control.

Climate Change Market As Buyers Emerge

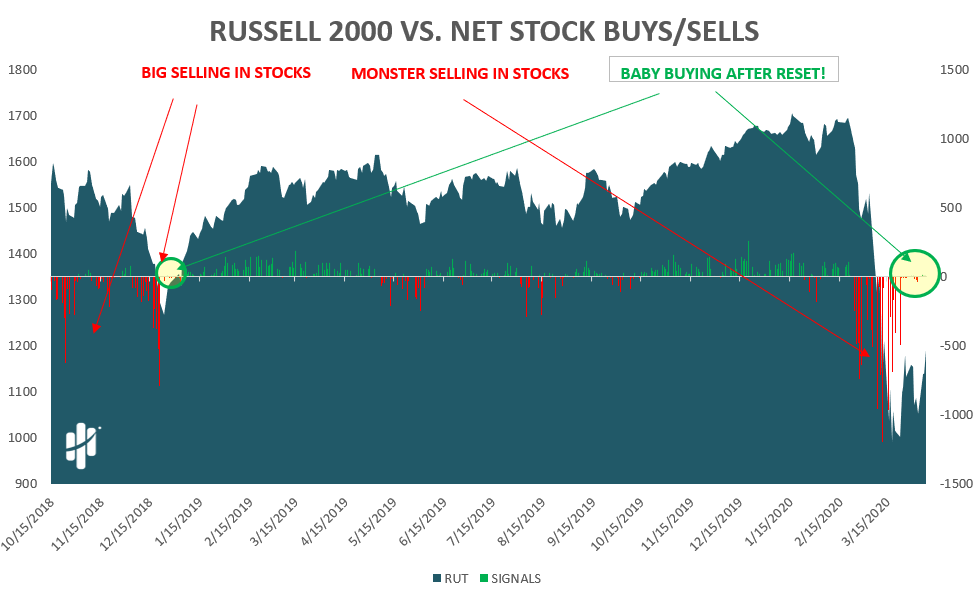
I’ve circled the last time we saw seedlings sprouting after a shock wave of selling.

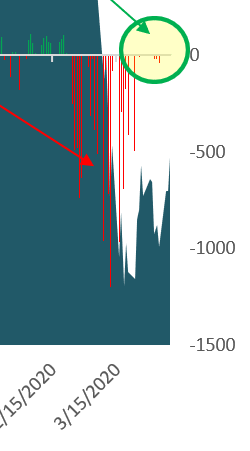
Here’s a zoom in – you’ll need a magnifying glass!

It’s a Climate Change Market

Some of the best stock scoops were during the free-fall.

When markets reach oversold – monster selling is usually unsustainable.

You tend to have forced sellers in that type of market.

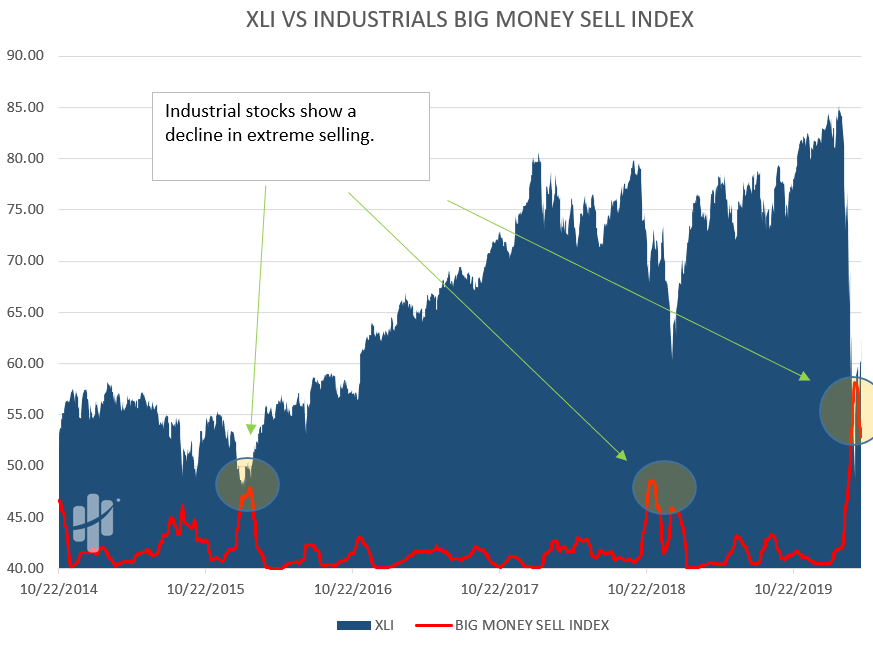
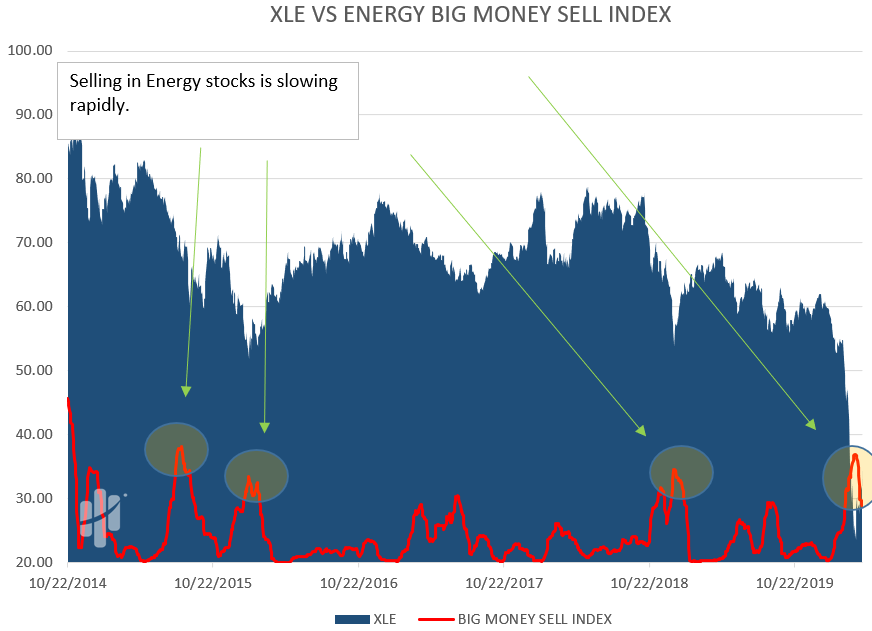
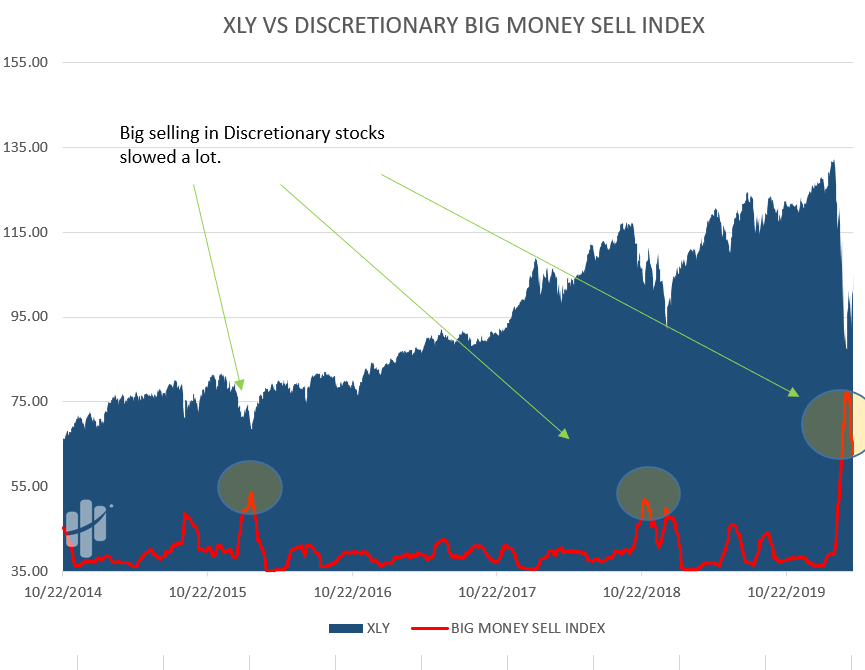
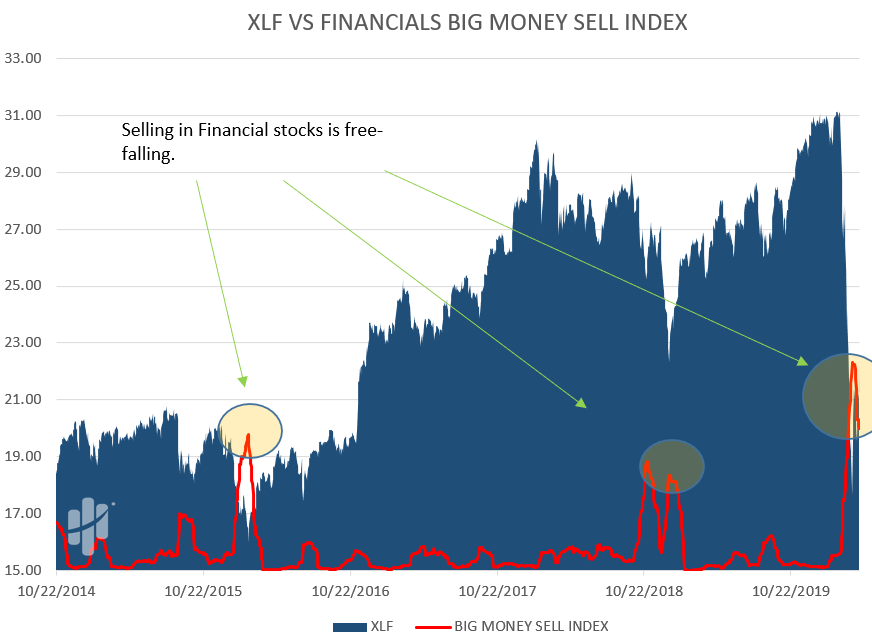
We can see how brutal the selling was by looking at sector selling.

The following charts show a moving average of sell signals by sector.

When the red line is increasing, the rate of selling in stocks is climbing.

When the red line is falling, the rate of selling is evaporating.

Click the images to zoom in:

Bottom line – the market internals have been shifting.

We are presenting the data and have no agenda.

Oftentimes, data can give us clues for when the market is preparing a shift.

We were able to use these clues to give us amazing entry prices on phenomenal stocks.

Hopefully you see what we see – a climate change market.

Lucas Downey
Lucas Downey

Lucas is co-founder of MAPsignals. His full bio can be found here.
Prior to MAP, he was Head of ETF Sales at Cantor Fitzgerald & SVP of Derivatives at Jefferies, LLC.

Spread the word!

Category: All, Big Money Insights Weekly, Special Reports

Previous Post: «holding aces Holding Aces
Next Post: Wealth Research Group Interview with Jason Bodner »

Reader Interactions

Comments

  1. Jared

    April 13, 2020 at 9:13 pm

    Hello,

    I just came across the Big Money Indicator today as part of an a different financial email and did some google searching and came across your website. I was wondering what my best route or options would be to gain access to your BMI or additional content you provide. Thank you, Jared

    Reply
    • Mapsignals Staff

      April 14, 2020 at 7:31 am

      Hey Jared –

      All of our subscriptions include the Big Money Index updated each week. You can sign-up at https://mapsignals.com/get-map/.

      Also, we plan to have an improved experience for users where they can get daily data updates and the ability to manipulate our data themselves.

      Reply

Leave a Reply Cancel reply

Your email address will not be published. Required fields are marked *

Primary Sidebar

Get Big Money Insights for FREE

Want to know where the Big Money is headed?

Just enter your email address below. You'll get our FREE NEWSLETTER sent directly to your inbox.

We call it Big Money Insights... It’s your weekly sneak peek at the powerful market-moving forces that are hidden from 99% of investors.

"*" indicates required fields

This field is for validation purposes and should be left unchanged.

Categories

  • All
  • Big Money Insights Weekly
  • Big Money Series
  • Macro Insights
  • MAP In The Media
  • Members Only
  • Performance
  • Podcast
  • Special Reports
  • Stocks
  • Videos & Interviews
  • White Papers

Archives

  • May 2022
  • April 2022
  • March 2022
  • February 2022
  • January 2022
  • December 2021
  • November 2021
  • October 2021
  • September 2021
  • August 2021
  • July 2021
  • June 2021
  • May 2021
  • April 2021
  • March 2021
  • February 2021
  • January 2021
  • December 2020
  • November 2020
  • October 2020
  • September 2020
  • August 2020
  • July 2020
  • June 2020
  • May 2020
  • April 2020
  • March 2020
  • February 2020
  • January 2020
  • December 2019
  • November 2019
  • October 2019
  • September 2019
  • August 2019
  • July 2019
  • June 2019
  • May 2019
  • April 2019
  • March 2019
  • February 2019
  • January 2019
  • December 2018
  • November 2018
  • October 2018
  • September 2018
  • August 2018

Follow us on Twitter

MAPsignals Follow 570 803

MAPsignals - we map the markets.

mapsignals
mapsignals avatar; MAPsignals @mapsignals ·
12 May 1524761713190572032

The #BigMoneyIndex is just days away from reaching #oversold.

It's our most #bullish #signal.

@LukeDowney walks you through today’s landscape and how it compares to prior drawdowns. $SPY $BMI

Read here: https://mapsignals.com/map-blog/a-rare-buy-signal-is-approaching/

Image for the Tweet beginning: The #BigMoneyIndex is just days Twitter feed image.
Reply on Twitter 1524761713190572032 Retweet on Twitter 1524761713190572032 1 Like on Twitter 1524761713190572032 4 Twitter 1524761713190572032
Load More...

Subscribe To Our YouTube Channel

MAPsignals

MAPsignals
#BestOversoldStocks #OversoldStocksToBuy #BestStocksToBuyNow
These are the best oversold stocks to buy now for May 2022.
Latest blog post: https://mapsignals.com/map-blog/

At MAPsignals, we are long-term focused. When solid companies get sold hard, it can be an opportunity. Technology stocks are reaching attractive levels in our opinion. 

Stocks don't go up in a straight line. Pullbacks can offer deals to the patient investor. As markets digest higher inflation, rising interest rates, and a Russian war - great companies will eventually thrive.

Lucas Downey breaks down the following 5 Best Oversold Stocks to Buy Now for May 2022:
1:39 Meta Platforms, Inc. (FB)
3:57 Apple Inc. (AAPL)
6:13 Garmin Ltd. (GRMN) 
8:12 Alphabet Inc. (GOOGL)
10:47 Visa Inc. (V)

Disclosure: Luke holds long positions in GRMN, GOOGL & V in personal and managed accounts at the time of filming.

Learn more at www.MAPsignals.com
Remember this is not personal investment advice of any kind. Make sure to always do your own research when it comes to investing in the stock market. This video is for entertainment purposes only. Our focus is to help investors make sense of markets with data.

Our disclaimer can be found here: https://mapsignals.com/contact/

Music by Karl Casey @ White Bat Audio
Best Oversold Stocks to Buy Now for May 2022
YouTube Video UC4nueJix0bSLmZyilUuCVrQ_oeQ7s1swbKE
Load More... Subscribe

Footer

© 2021 Mapsignals.com

  • Home
  • Contact & Disclaimer
  • Privacy Policy
  • Terms & Conditions
  • Cookie Policy (US)
  • FAQ

Copyright © 2022 · Mai Law Pro on Genesis Framework · WordPress · Log in

✕
The Big Money Index White Paper is Here

Get your copy here and know where the Big Money is headed.

Enter your email address below and you'll get our FREE NEWSLETTER sent directly to your inbox. 

 We call it Big Money Insights... It’s your weekly sneak peek at the powerful market-moving forces that are hidden from 99% of investors.

Manage Cookie Consent
We use cookies to optimize our website and our service.
Functional Always active
The technical storage or access is strictly necessary for the legitimate purpose of enabling the use of a specific service explicitly requested by the subscriber or user, or for the sole purpose of carrying out the transmission of a communication over an electronic communications network.
Preferences
The technical storage or access is necessary for the legitimate purpose of storing preferences that are not requested by the subscriber or user.
Statistics
The technical storage or access that is used exclusively for statistical purposes. The technical storage or access that is used exclusively for anonymous statistical purposes. Without a subpoena, voluntary compliance on the part of your Internet Service Provider, or additional records from a third party, information stored or retrieved for this purpose alone cannot usually be used to identify you.
Marketing
The technical storage or access is required to create user profiles to send advertising, or to track the user on a website or across several websites for similar marketing purposes.
Manage options Manage services Manage vendors Read more about these purposes
View preferences
{title} {title} {title}