
Dividends Make the Difference
The last few years have been all about big gains. 2022 is shaping up to be the year of the dividend. And I believe that dividends make the difference in portfolios.
Starting off I’ll show you why dividend strategies are catching on and what to look for. Then I’ll use the soon-to-be-released MAPsignals ETF scoring feature to find a dividend ETF that checks all the boxes.
So get this, when most of us think of stocks, the prospect of big gains comes to mind. But dividends play a surprisingly important role in how well equities perform over time.
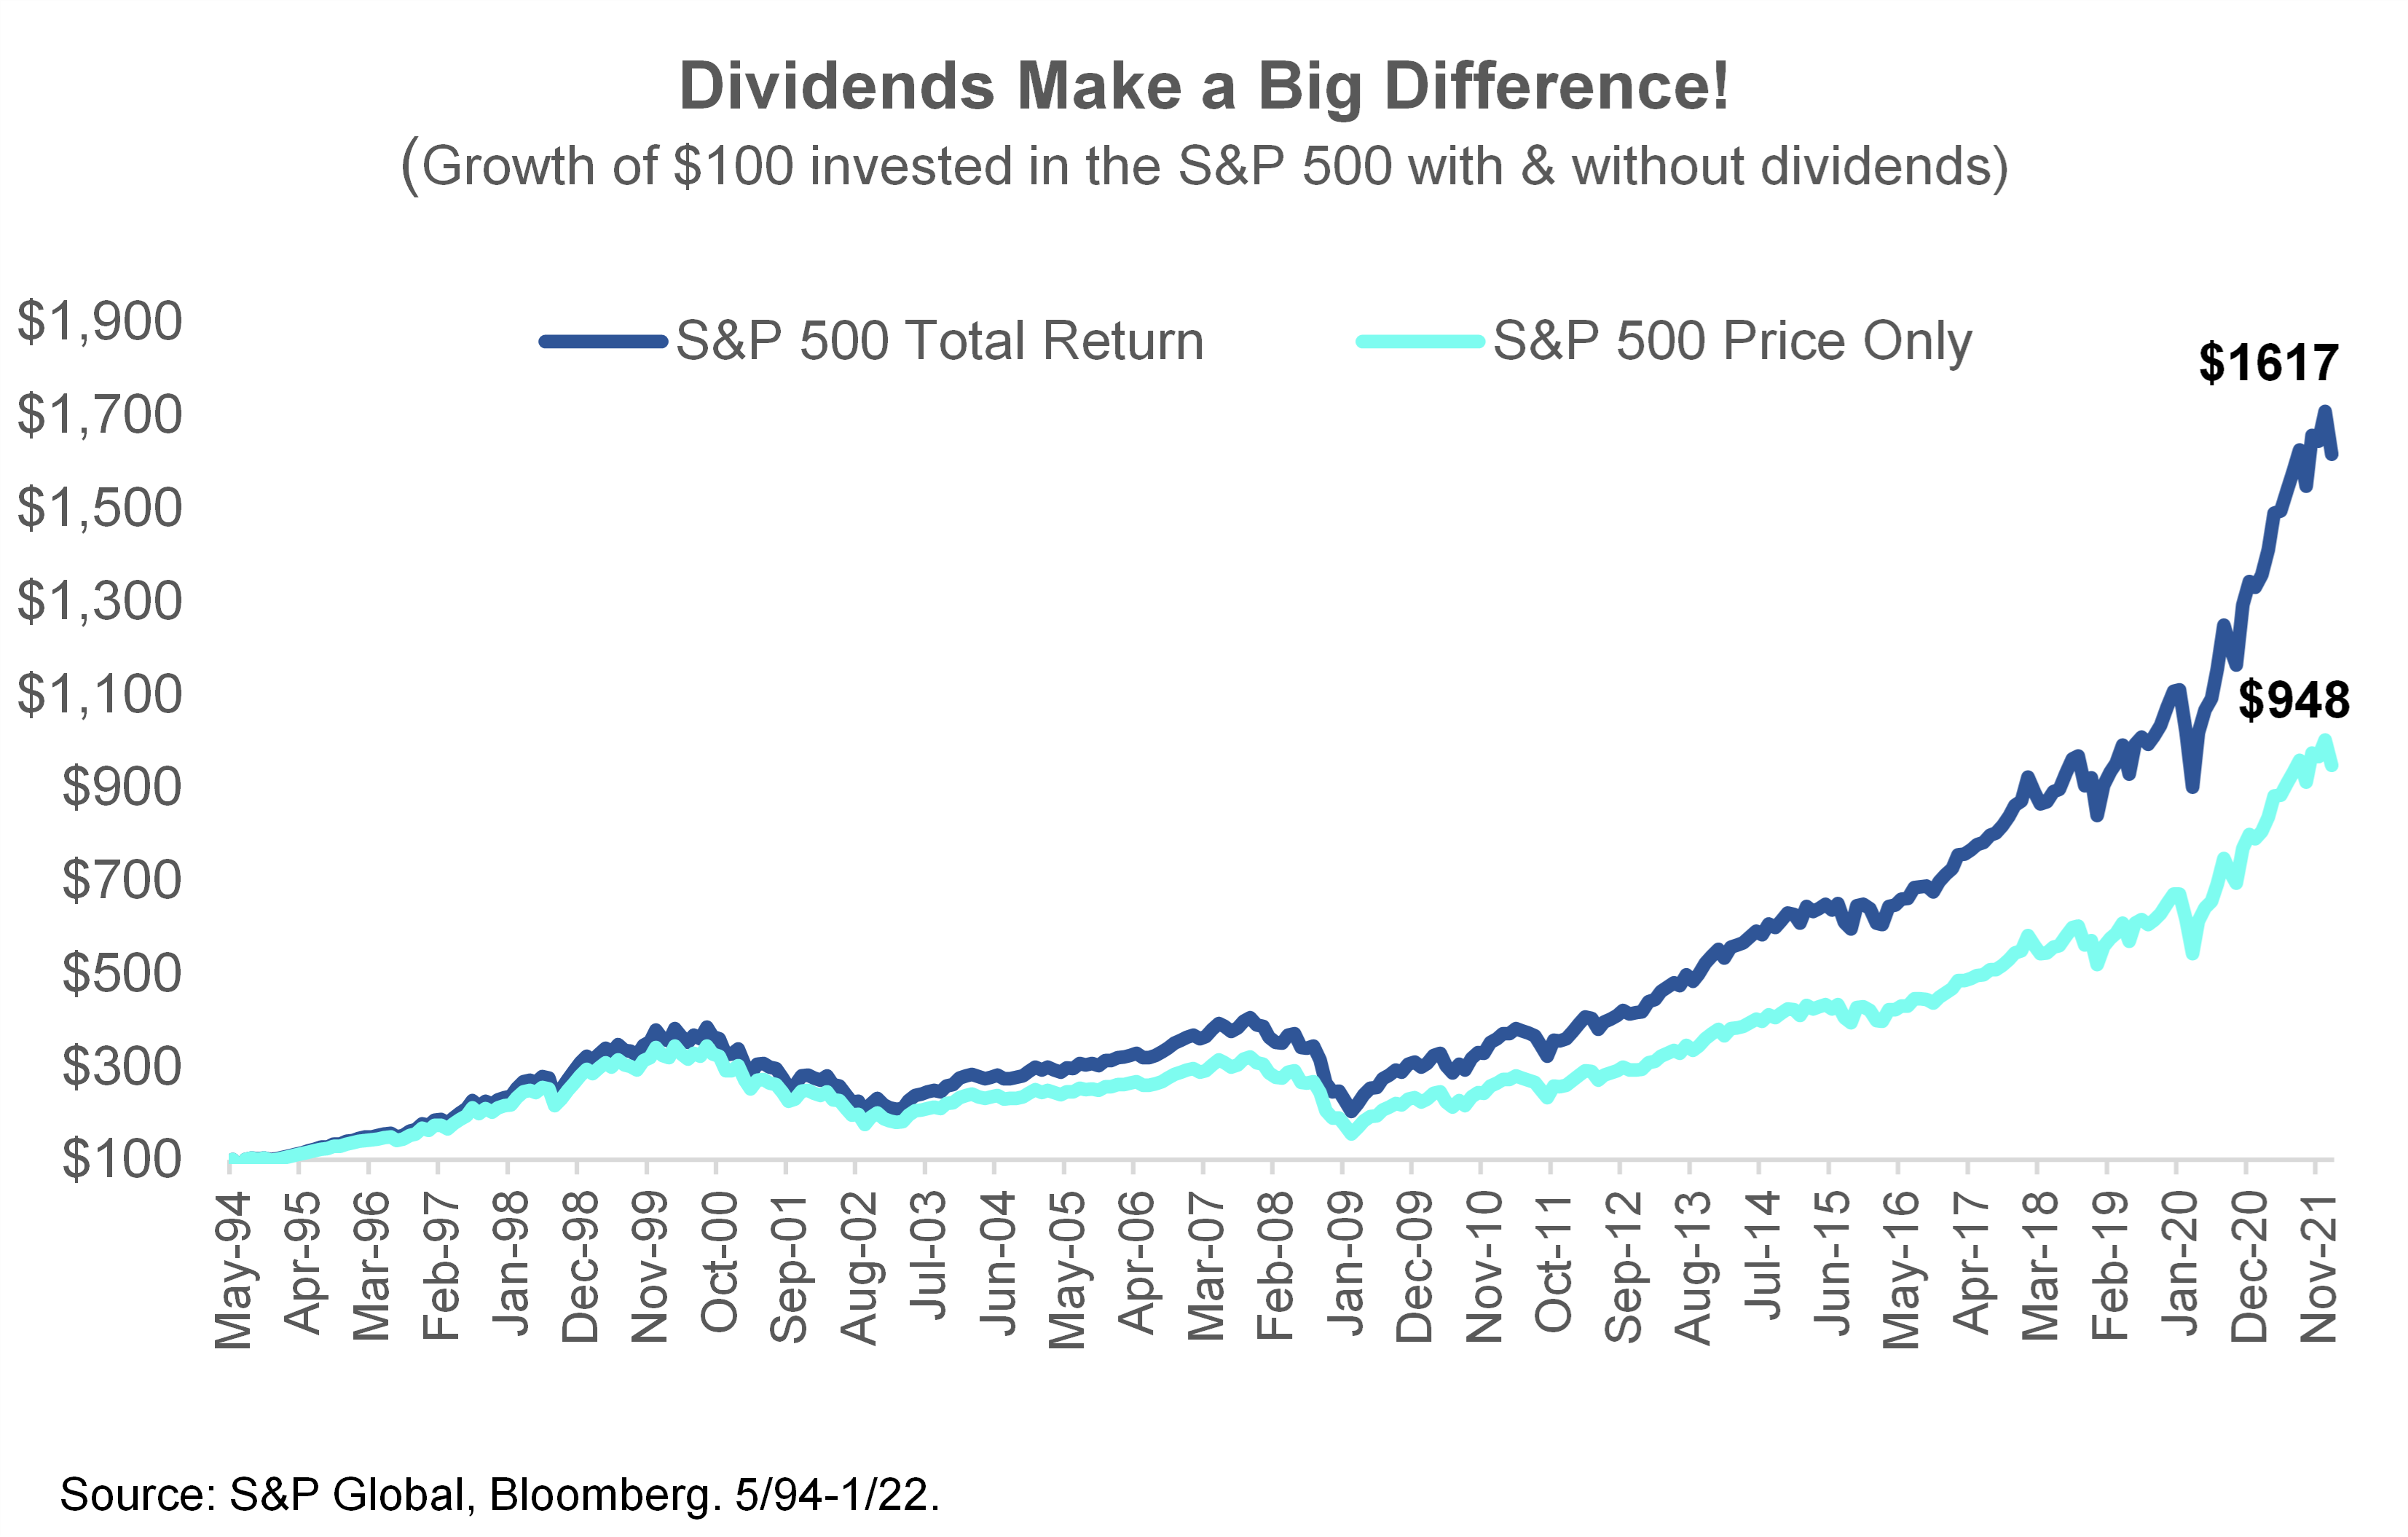
Albert Einstein once described compound interest as the “eighth wonder of the world.” He was 100% right! If you invested $100 in the S&P 500 in 1994, you’d have $948 today. Not bad, but if you reinvested the dividends, you’d have $1,617. That’s 70% more money! Dividends make the difference.
The good news is you don’t have to be a genius to benefit from the power of dividend compounding. You just need a little discipline and patience. Below you can see how reinvesting dividends has a been a no-brainer compared to not:
History shows why dividends make the difference. But let’s keep going and talk about the macro landscape.
The Macro Case for Dividends
Here’s why the current macro setup looks ideal for dividend investing:
- Dividends’ biggest contributions to returns come when volatility is high. A 3% yield matters a lot more when you’re up 6% than when you’re up 20%.
- Macro uncertainty always drives investors towards stability. Dividend paying blue chips with strong balance sheets fit the bill. They have a great track record of outperforming in volatile times.
- Years of strong economic growth and low borrowing costs have left companies flush with cash. In 2021, S&P 500 constituents paid a record $541B in dividends, up 176% from $196B in 2009.
- High inflation has investors scrambling for income. The 10-yr Treasury only yields 2%, well below its 4% long-term average. With inflation at 7%, buying Treasuries locks in a 5% annual loss!
- Investors are turning to stocks to plug the income gap. But with the S&P 500 only yielding 1.5%, buying an index fund isn’t the answer. Instead, investors are targeting high-quality blue chips with strong cash flows. Many “best of breed” companies yield 3%+ and consistently grow their dividends 5%-10% a year, doubling their payouts every decade.
Dividends Make the Difference, Watch the Dividend Payout Ratio
Lots of companies pay dividends. Focus on stocks with competitive yields that can grow their payouts over time. The best metric for gauging a company’s dividend growth potential is its dividend payout ratio – the percentage of yearly profits needed to pay the dividend.
- Anything under 50% shows the potential for healthy dividend growth. The S&P 500’s current payout ratio is only 39%, well below the 52% long-term average. Blue chips can keep their payouts growing at a good clip.
- A payout ratio above 70% is a red flag. It means a company is using most of its earnings to pay the dividend, leaving less to reinvest in the business. This makes consistently growing the dividend difficult and increases the odds of having to slash the payout.
Don’t reach for yield.
Too many income investors only focus on stocks with huge yields. That’s a mistake. Sure, yield is important, but sky-high payouts can be a red flag. Many stocks only sport jumbo yields after they’ve dropped sharply due to poor fundamentals. Dividend cuts usually follow.
- Look for a minimum yield threshold of 2.5%-3%.
- Don’t underestimate the importance of dividend growth. S&P 500 companies have grown their payouts 15% a year since 2009. That’s a triple!
So, now you may be wondering, “how to navigate the dividend landscape?” Today I’ll show you.
There are several well-established, dividend focused ETFs out there. Picking the right one can be tough. I screened the leading dividend ETFs across key fundamental and technical metrics, using the MAPsignals ranking process.
Below are the top 3 funds and their MAPsignals scores.

As you can see, VYM has a powerful fundamental and technical score compared to the others. Below are the bullets that jump out at me for this fund.
The Vanguard High Dividend ETF (VYM) checks all the boxes:
- 8% annual returns since 2006 inception with 10% less volatility than the S&P 500
- Healthy 2.8% dividend yield. 8% annual dividend growth since 2006
- 45% dividend payout ratio signals ample room for dividend growth
- The ETF boasts a score of 59 – VYM is holding up better than peers in a very volatile market
- Lowest expense ratio in the category – a rock-bottom 0.06%
- Big & liquid – $43B is assets with 2M shares of average daily trading volume
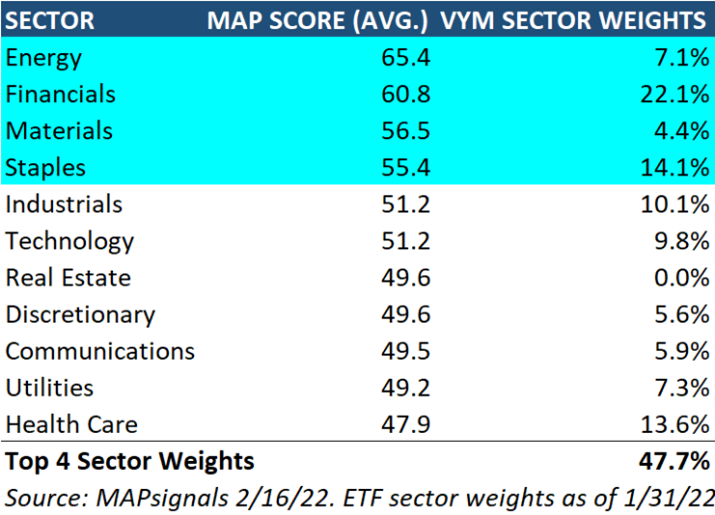
And while this is all dandy, the fund has a 48% weighting in strong scoring sectors: Energy, Financials, Materials, & Staples.
Take a look:
Bringing It All Together
2022 is shaping up to be a strong year for equity income investing. Dividends are catching on thanks to heightened market volatility, inflation worries, low bond yields and healthy corporate balance sheets.
The dividend “sweet spot” is stocks with 2.5%-3% yields and strong track records of dividend growth. VYM offers a convenient, low-cost way to get both. And our ranking process agrees.
Just sit back and let compounding do the rest. And remember, over the long-run, dividends make the difference.
Invest well,
-Alec
***And if you want more thoughts on the market each week, subscribe to our MAPsignals YouTube Channel to see our Weekly Market Update video series. In this episode: Weekly Market Update | Big Money Insights Ep. 1. Luke shares the MAPsignals weekly market update & breaks down the best stocks by sector.
Also, you can find our other videos here.