• Menu
  • Skip to right header navigation
  • Skip to main content
  • Skip to primary sidebar
  • Skip to footer

MAPsignals

We map big money.

  • Latest Insights
  • Power of MAP
    • MAP Products
    • MAP System
    • MAP White Papers
    • Videos & Interviews
  • Profit with MAP
  • About
    • About MAP
    • MAP Team
    • Authors
    • MAP System
    • MAP Products
    • Big Money Index
  • Members
    • Get Started With MAP
    • My MAP
    • Big Money Charts
    • MAP View
    • MAP View Options
    • MAP Top 20 Weekly
    • MAP 50
    • Member Updates
    • Platinum Updates
    • Members Only Posts
    • Performance
  • Portal

Duck Test Market

January 7, 2020 //  by Lucas Downey

The duck test goes like this – “if it looks like a duck, swims like a duck, and quacks like a duck, then it probably is a duck.”

Based on the duck test, our data says markets are overbought and due for a healthy pullback.

Mapsignals Performs A Duck Test Market

From Wikipedia, “If it looks like a duck, swims like a duck, and quacks like a duck, then it probably is a duck..”

duck test market

Investors seem to be greedy. That’s usually not the time to be buying stocks. Let’s perform the 3 part duck test to see if markets are overbought.

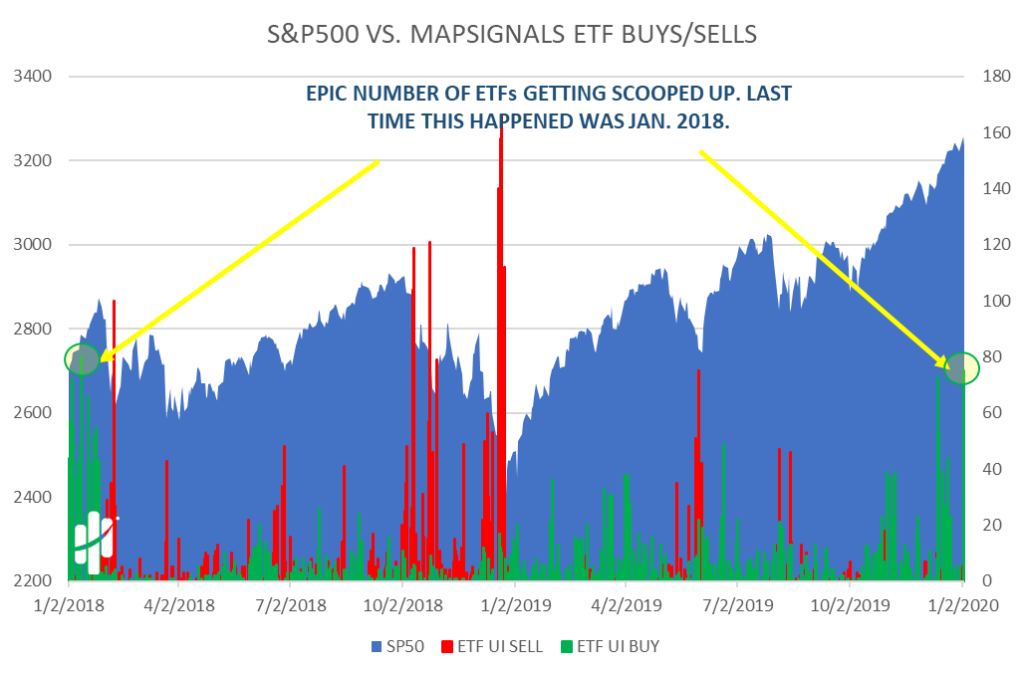
ETF Buying is Huge Right Now

We measure ETFs and look for big buying and selling. Recently, buying surged.

We’ve seen this before – it tends to preface lower market prices. Last time it happened was mid January of 2018. Just before a pullback.

It looks like a duck.

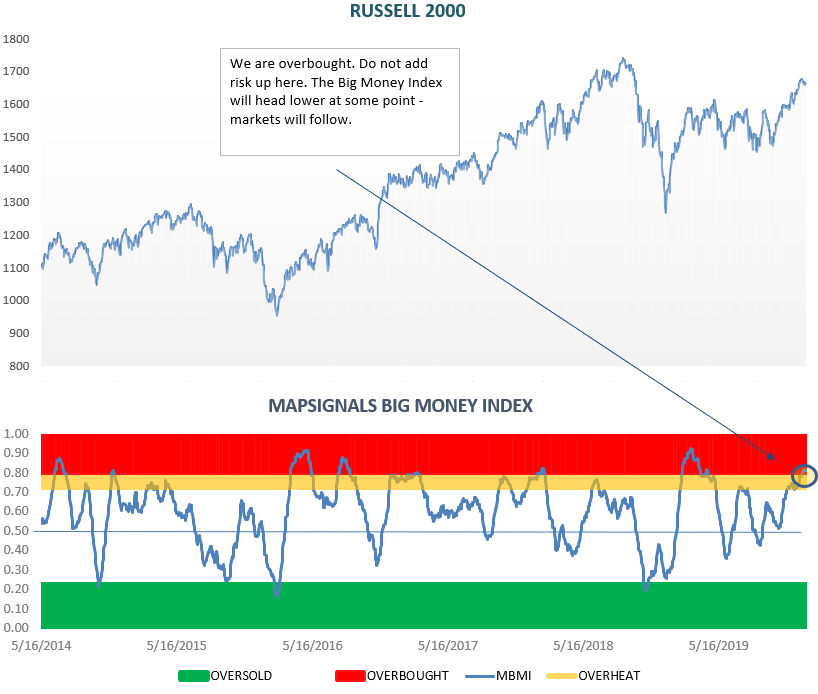
The Big Money Index is Overbought

We measure thousands of stocks each day looking for big money buying and selling. Recently, we broke into the red area…ie overbought.

That just means that buying is extreme compared to selling.

When the index begins to fall from the red area, markets fall.

Here is the Big Money Index.

It swims like a duck.

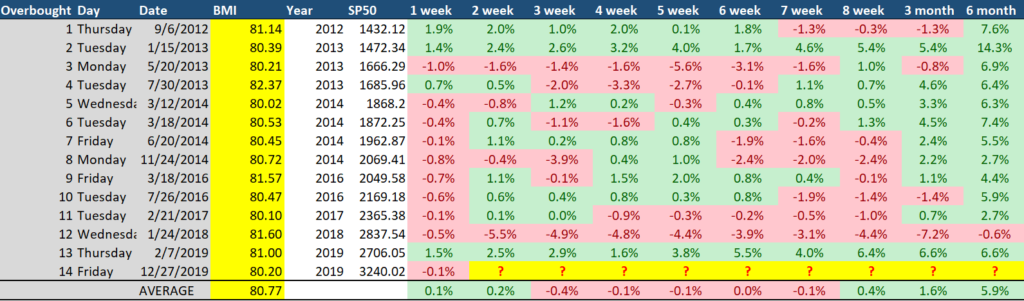
You can see the average returns after we reach these red areas. Out to 7 weeks is lackluster.

Keep in mind these periods are after 2012…an incredibly bullish 7+ years.

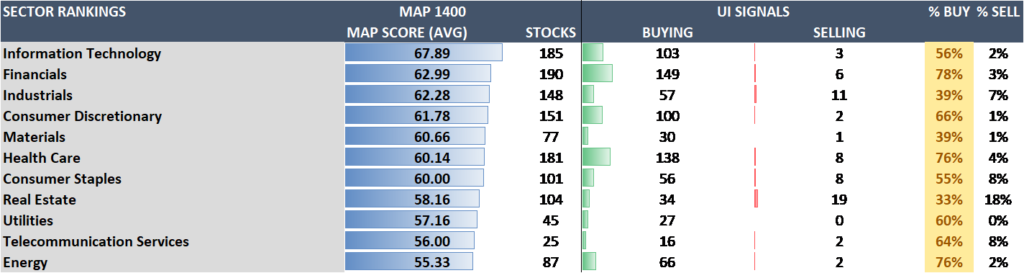
Buying In Stocks Was Off The Charts

Weeks ago there was a shock wave of buying in stocks.

It’s a rare event when all sectors see massive buying. In yellow below, you can see the % of the universe showing big volume buys.

Usually you see this type of out-sized activity when the market has a flush out…ie bottoms. It’s a cry of “uncle.”

It quacks like a duck.

Bottom line: we’ve seen signals like this before. Signs point to a healthy pullback. We’ll be getting our buy lists ready.

Lucas Downey
Lucas Downey

Lucas is co-founder of MAPsignals. His full bio can be found here.
Prior to MAP, he was Head of ETF Sales at Cantor Fitzgerald & SVP of Derivatives at Jefferies, LLC.

Spread the word!

Category: All, Big Money Insights Weekly, Special Reports

Previous Post: «most frequent 20 january 2020 Top 20 Stocks From 2nd Half 2019
Next Post: Surfing Waves »

Primary Sidebar

Get Big Money Insights for FREE

Want to know where the Big Money is headed?

Just enter your email address below. You'll get our FREE NEWSLETTER sent directly to your inbox.

We call it Big Money Insights... It’s your weekly sneak peek at the powerful market-moving forces that are hidden from 99% of investors.

"*" indicates required fields

This field is for validation purposes and should be left unchanged.

Categories

  • All
  • Big Money Insights Weekly
  • Big Money Series
  • Macro Insights
  • MAP In The Media
  • Members Only
  • Performance
  • Podcast
  • Special Reports
  • Stocks
  • Videos & Interviews
  • White Papers

Archives

  • February 2023
  • January 2023
  • December 2022
  • November 2022
  • October 2022
  • September 2022
  • August 2022
  • July 2022
  • June 2022
  • May 2022
  • April 2022
  • March 2022
  • February 2022
  • January 2022
  • December 2021
  • November 2021
  • October 2021
  • September 2021
  • August 2021
  • July 2021
  • June 2021
  • May 2021
  • April 2021
  • March 2021
  • February 2021
  • January 2021
  • December 2020
  • November 2020
  • October 2020
  • September 2020
  • August 2020
  • July 2020
  • June 2020
  • May 2020
  • April 2020
  • March 2020
  • February 2020
  • January 2020
  • December 2019
  • November 2019
  • October 2019
  • September 2019
  • August 2019
  • July 2019
  • June 2019
  • May 2019
  • April 2019
  • March 2019
  • February 2019
  • January 2019
  • December 2018
  • November 2018
  • October 2018
  • September 2018
  • August 2018

Follow us on Twitter

MAPsignals Follow 1,449 1,070

MAPsignals is a data platform that tracks institutional money flows in stocks and ETFs. Sign up for free insights here: https://t.co/SaAVHjKC9J

mapsignals
mapsignals avatar; MAPsignals @mapsignals ·
11h 1622987016957820928

One of my favorite #dividend #stocks having a day - Skyworks Solutions $SWKS - owned it for years

The $2B buyback is pretty significant given the market cap is sub $19B

#Semiconductors continue to see major inflows

Reply on Twitter 1622987016957820928 Retweet on Twitter 1622987016957820928 0 Like on Twitter 1622987016957820928 2 Twitter 1622987016957820928
Load More...

Footer

© 2021 Mapsignals.com

  • Home
  • Contact & Disclaimer
  • Privacy Policy
  • Terms & Conditions
  • Opt-out preferences
  • FAQ

Copyright © 2023 · Mai Law Pro on Genesis Framework · WordPress · Log in

✕
What Happened to Risk Assets White Paper is Here

Get your copy here and take a journey through our thoughts on margin and leverage.

Enter your email address below and you'll get our FREE NEWSLETTER sent directly to your inbox. 

 We call it Big Money Insights... It’s your weekly sneak peek at the powerful market-moving forces that are hidden from 99% of investors.