• Menu
  • Skip to right header navigation
  • Skip to main content
  • Skip to primary sidebar
  • Skip to footer

MAPsignals

We map big money.

  • Latest Insights
  • Power of MAP
    • MAP Products
    • MAP System
    • White Papers
    • Videos & Interviews
    • Big Money Podcast
  • Profit with MAP
  • About
    • About MAP
    • MAP Team
    • MAP System
    • MAP Products
    • Big Money Index
  • Members
    • Get Started With MAP
    • My MAP
    • MAP View
    • MAP Options
    • MAP Top 20 Weekly
    • MAP 50
    • Member Updates
    • Platinum Updates
    • Members Only Posts

Fishing For Buyers In A Seller’s Pond

June 5, 2019 //  by MAPsignals Staff//  1 Comment

“I’m catching a wiggle.” Think of when fishing in a pond and the line starts to wiggle. Is it a big fish? Or is it a smart minnow making off with your bait? Wiggles happen on Wall Street trading desks, too. You see, big traders are cautious…and rightly so. Any information that is leaked can and will tip their hand. So when someone is asking about a stock without saying if they are a buyer or seller, that’s a wiggle! It could be a big fish, or just an opportunistic bait seeker.

This morning our data reminded us of “catching a wiggle.” The market rallied hard yesterday after a nasty multi-week sell-off, but what we really saw under the surface was a decent amount of buying in stocks…something we haven’t seen in quite a while. Is it real buying? The short answer is probably. But instead of going on a hunch, we looked back at prior times when the setup looked similar. We need more than just a wiggle.

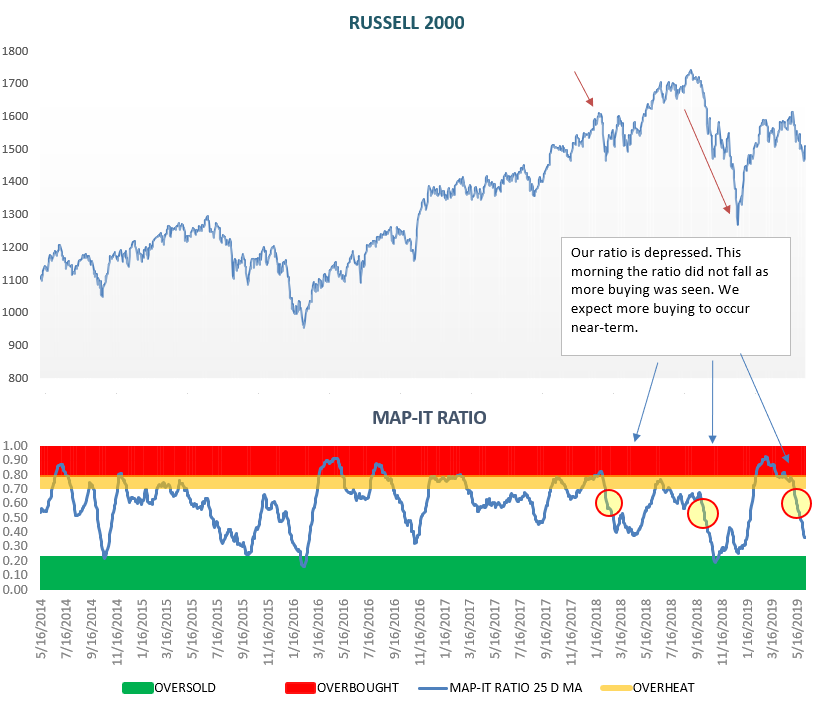
Here’s a snapshot of our ratio of buying to selling. It sits at 36% because sellers have been in control. We circled areas of declining ratio readings:

To drill down further, this morning we saw 4 things that caught our attention and look quite bullish:

  1. We logged more buy signals than sell signals in stocks.
  2. Over 50% of our stock universe (~1400) traded on unusual volume.
  3. A low percentage of our universe made buy/sell signals, indicating a reversion trade.
  4. Markets rallied hard yesterday.

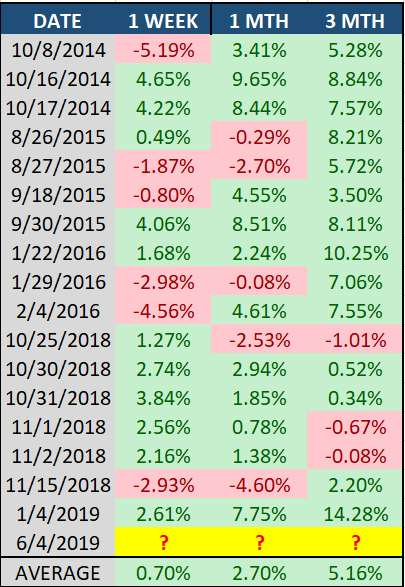
Below are the prior times when numbers 2 & 3 occurred when our ratio was very depressed (<40%) with forward returns for SPY (S&P 500 ETF):

Bottom line: when selling slows and buying grows, markets tend to rise. The best stocks out there rise the fastest. In this sea of information, we are constantly looking for outlier stocks. We believe the worst is likely behind us near-term. Once the ratio lifts, markets will likely follow.

Spread the word!

Category: All, Big Money Insights Weekly, Special Reports

Previous Post: « Brace for Impact
Next Post: 5 New Stocks Showing UI Buys »

Reader Interactions

Comments

  1. Emil B.

    June 6, 2019 at 9:24 am

    Nice

    Reply

Leave a Reply Cancel reply

Your email address will not be published. Required fields are marked *

Primary Sidebar

Get Big Money Insights for FREE

Want to know where the Big Money is headed?

Just enter your email address below. You'll get our FREE NEWSLETTER sent directly to your inbox. 

 We call it Big Money Insights... It’s your weekly sneak peek at the powerful market-moving forces that are hidden from 99% of investors.

Categories

  • All
  • Big Money Insights Weekly
  • Big Money Series
  • MAP 50
  • MAP In The Media
  • Members Only
  • Performance
  • Podcast
  • Special Reports
  • Stocks
  • Videos & Interviews
  • White Papers

Archives

  • February 2021
  • January 2021
  • December 2020
  • November 2020
  • October 2020
  • September 2020
  • August 2020
  • July 2020
  • June 2020
  • May 2020
  • April 2020
  • March 2020
  • February 2020
  • January 2020
  • December 2019
  • November 2019
  • October 2019
  • September 2019
  • August 2019
  • July 2019
  • June 2019
  • May 2019
  • April 2019
  • March 2019
  • February 2019
  • January 2019
  • December 2018
  • November 2018
  • October 2018
  • September 2018
  • August 2018

Footer

© 2020 Mapsignals.com

  • Home
  • Contact
  • Privacy Policy
  • Terms & Conditions
  • Cookie Policy (US)
  • FAQ

Copyright © 2021 · Mai Law Pro on Genesis Framework · WordPress · Log in