• Menu
  • Skip to right header navigation
  • Skip to main content
  • Skip to primary sidebar
  • Skip to footer

MAPsignals

We map big money.

  • Latest Insights
  • Power of MAP
    • MAP Products
    • MAP System
    • MAP White Papers
    • Videos & Interviews
  • Profit with MAP
  • About
    • About MAP
    • MAP Team
    • Authors
    • MAP System
    • MAP Products
    • Big Money Index
  • Members
    • Get Started With MAP
    • My MAP
    • Big Money Charts
    • MAP View
    • MAP View Options
    • MAP Top 20 Weekly
    • MAP 50
    • Member Updates
    • Platinum Updates
    • Members Only Posts
    • Performance
  • Portal

Get In There

March 4, 2020 //  by Lucas Downey//  1 Comment

You’ve seen those nail-biter games when everything comes down to a few plays.

It’s a win or lose situation.

So, what does a great coach do? He turns to his best player and says, “Get In There!”

I can envision coach Orgeron saying those 3 words in the championship game.

GET IN THERE

What Have We Been Doing?

We’ve been gettin’ in there, too. We’ve prepared for the pullback and started to go shopping…lazy bid style.

What’s a lazy bid? Oh, that’s when you put some low-ball bids out there… for great stocks. You do this when the market is down 3-4%.

To us, it’s win or lose. Long-term we know this is a winning strategy.

We aren’t playing for tomorrow, we’re playing for 6-12 months from now.

It’s not often that panic strikes the market with fire-sale prices.

Here’s what a fire-sale looks like when ETFs get dumped:

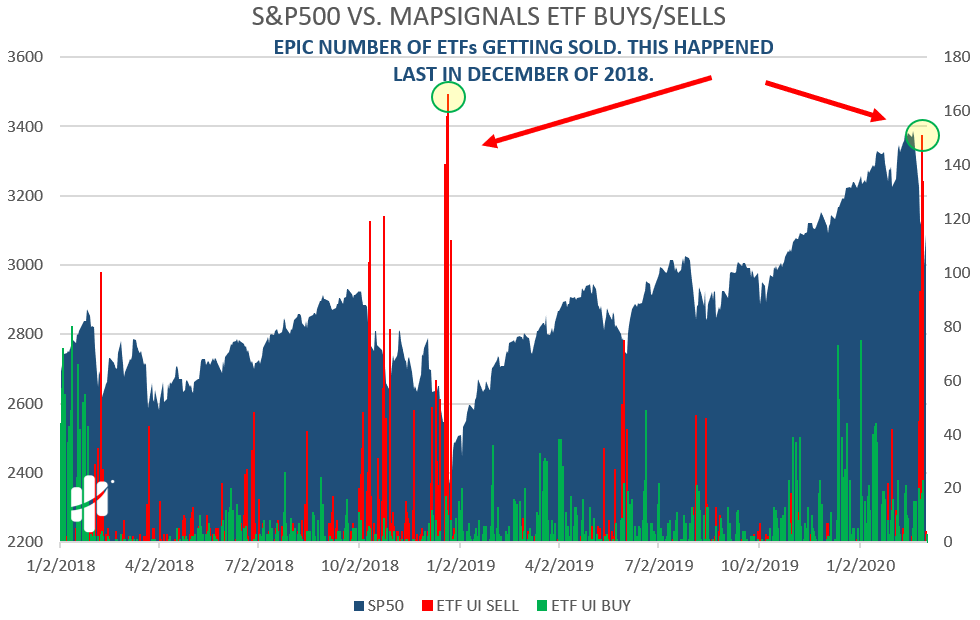
Check out what epic stock selling looks like:

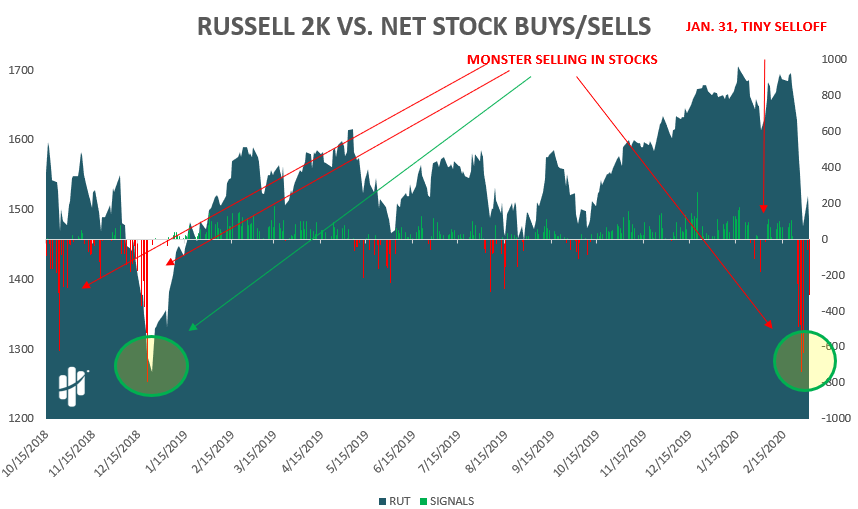
Anytime we see this level of selling, we like to “get in there.” We even sent out a members only blog post on Friday titled, Time To Go Fishing. It’s full of names we like.

What’s Next For Markets?

So, when will the selling be over? Great question!

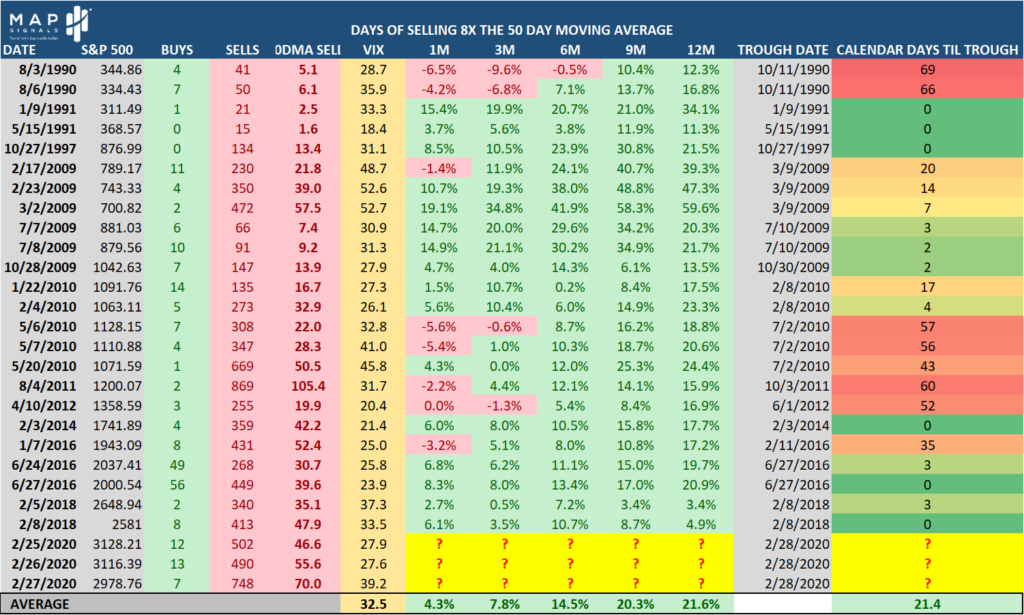
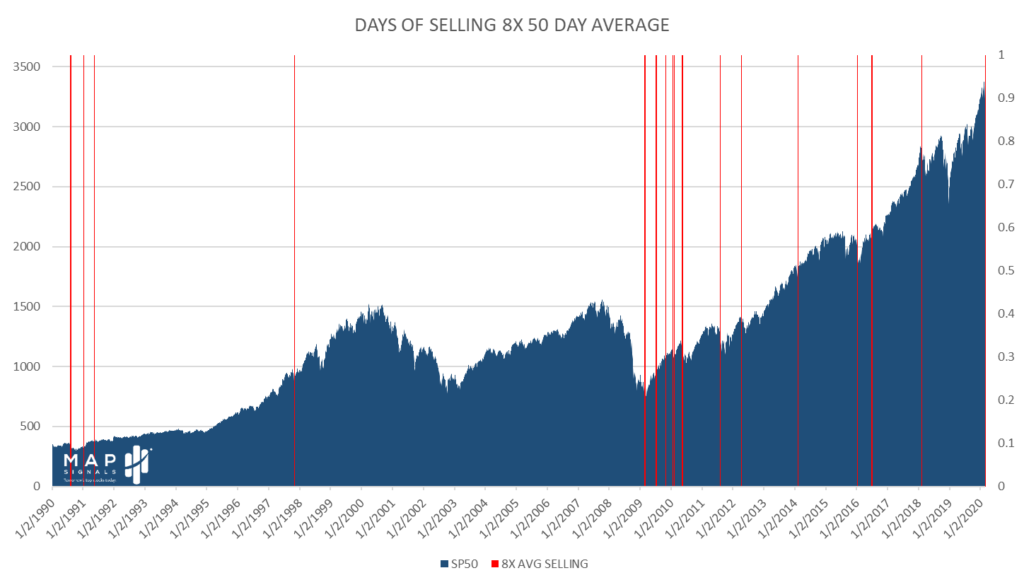
We looked back at prior times when huge selling gripped the market similar to now. We found 27 times when selling was 8 times larger than the 50 day moving average.

As for when to buy, the average trough in the market happened 21 calendar days later: three weeks. So, according to this data, three weeks from last Friday, we can expect the market to trough-out.

Here are the results:

Here’s a chart of those instances:

The bottom line is this. People miss out on big rallies in the market and then they pray for pullbacks.

When the pullbacks come, most will clam-up thinking that more downside is coming.

Fear and panic is not a strategy.

If you’re gonna win the game of investing, find the best players in the market and get in there.

Lucas Downey
Lucas Downey

Lucas is co-founder of MAPsignals. His full bio can be found here.
Prior to MAP, he was Head of ETF Sales at Cantor Fitzgerald & SVP of Derivatives at Jefferies, LLC.

Spread the word!

Category: All, Big Money Insights Weekly, Special Reports

Previous Post: « Big Money Series – Hedge Funds
Next Post: Time To Pop The Hood »

Reader Interactions

Comments

  1. Emmett

    March 4, 2020 at 3:04 pm

    Very much like the commentaries.

    Between yours and Louis Navellier great combination

    Reply

Leave a Reply Cancel reply

Your email address will not be published. Required fields are marked *

Primary Sidebar

Get Big Money Insights for FREE

Want to know where the Big Money is headed?

Just enter your email address below. You'll get our FREE NEWSLETTER sent directly to your inbox.

We call it Big Money Insights... It’s your weekly sneak peek at the powerful market-moving forces that are hidden from 99% of investors.

"*" indicates required fields

This field is for validation purposes and should be left unchanged.

Categories

  • All
  • Big Money Insights Weekly
  • Big Money Series
  • Macro Insights
  • MAP In The Media
  • Members Only
  • Performance
  • Podcast
  • Special Reports
  • Stocks
  • Videos & Interviews
  • White Papers

Archives

  • February 2023
  • January 2023
  • December 2022
  • November 2022
  • October 2022
  • September 2022
  • August 2022
  • July 2022
  • June 2022
  • May 2022
  • April 2022
  • March 2022
  • February 2022
  • January 2022
  • December 2021
  • November 2021
  • October 2021
  • September 2021
  • August 2021
  • July 2021
  • June 2021
  • May 2021
  • April 2021
  • March 2021
  • February 2021
  • January 2021
  • December 2020
  • November 2020
  • October 2020
  • September 2020
  • August 2020
  • July 2020
  • June 2020
  • May 2020
  • April 2020
  • March 2020
  • February 2020
  • January 2020
  • December 2019
  • November 2019
  • October 2019
  • September 2019
  • August 2019
  • July 2019
  • June 2019
  • May 2019
  • April 2019
  • March 2019
  • February 2019
  • January 2019
  • December 2018
  • November 2018
  • October 2018
  • September 2018
  • August 2018

Follow us on Twitter

MAPsignals Follow 1,434 1,061

MAPsignals is a data platform that tracks institutional money flows in stocks and ETFs. Sign up for free insights here: https://t.co/SaAVHjKC9J

mapsignals
mapsignals avatar; MAPsignals @mapsignals ·
47m 1621476848990359552

Pendulum has swung

Helene Meisler @hmeisler

Highest volume for the QQQs since 12/13

Reply on Twitter 1621476848990359552 Retweet on Twitter 1621476848990359552 0 Like on Twitter 1621476848990359552 0 Twitter 1621476848990359552
Load More...

Footer

© 2021 Mapsignals.com

  • Home
  • Contact & Disclaimer
  • Privacy Policy
  • Terms & Conditions
  • Opt-out preferences
  • FAQ

Copyright © 2023 · Mai Law Pro on Genesis Framework · WordPress · Log in

✕
What Happened to Risk Assets White Paper is Here

Get your copy here and take a journey through our thoughts on margin and leverage.

Enter your email address below and you'll get our FREE NEWSLETTER sent directly to your inbox. 

 We call it Big Money Insights... It’s your weekly sneak peek at the powerful market-moving forces that are hidden from 99% of investors.

MAPsignals
Manage Cookie Consent
We use cookies to optimize our website and our service.
Functional Always active
The technical storage or access is strictly necessary for the legitimate purpose of enabling the use of a specific service explicitly requested by the subscriber or user, or for the sole purpose of carrying out the transmission of a communication over an electronic communications network.
Preferences
The technical storage or access is necessary for the legitimate purpose of storing preferences that are not requested by the subscriber or user.
Statistics
The technical storage or access that is used exclusively for statistical purposes. The technical storage or access that is used exclusively for anonymous statistical purposes. Without a subpoena, voluntary compliance on the part of your Internet Service Provider, or additional records from a third party, information stored or retrieved for this purpose alone cannot usually be used to identify you.
Marketing
The technical storage or access is required to create user profiles to send advertising, or to track the user on a website or across several websites for similar marketing purposes.
Manage options Manage services Manage vendors Read more about these purposes
View preferences
{title} {title} {title}