Get Ready for a Monster Reversion Trade for the Ages
The appetite for stocks is off the charts.
…especially mega-cap tech names.
This has caused market breadth readings to plummet.
But don’t fret because now’s the time to get ready for a monster reversion trade for the Ages.
Let’s face it, if you’re not holding the handful of AI-fueled growth names right now, odds are your portfolio is underperforming.
The good news is that we’ve been all over this trade. Not only did we make the data-driven case that a major ultra-bullish signal is approaching just 6 weeks ago…we also teed up an evidence-rich study suggesting the NASDAQ was ready to explode.
But today I bring better news, this time for the rest of the market.
Turns out, one popular breadth reading is signaling a significant gap between the returns of cap-weighted stocks relative to the rest of the market.
It’s a brow-raising development that rarely comes along.
But here’s the hard-hitting truth: Those unpopular laggards will have their day again…and based on history, it’ll be here a lot sooner than the crowd realizes.
There’s an epic setup for stock pickers coming soon.
Before we get to that powerful study, let’s check in on the overall state of the market.
The Average Stock is Underperforming Major Indices
Money flows reveal the true health of the stock market. When a majority of equities are participating in a rally, breadth is said to be strong.
That is not the case recently as a handful of names are dragging major indexes higher.
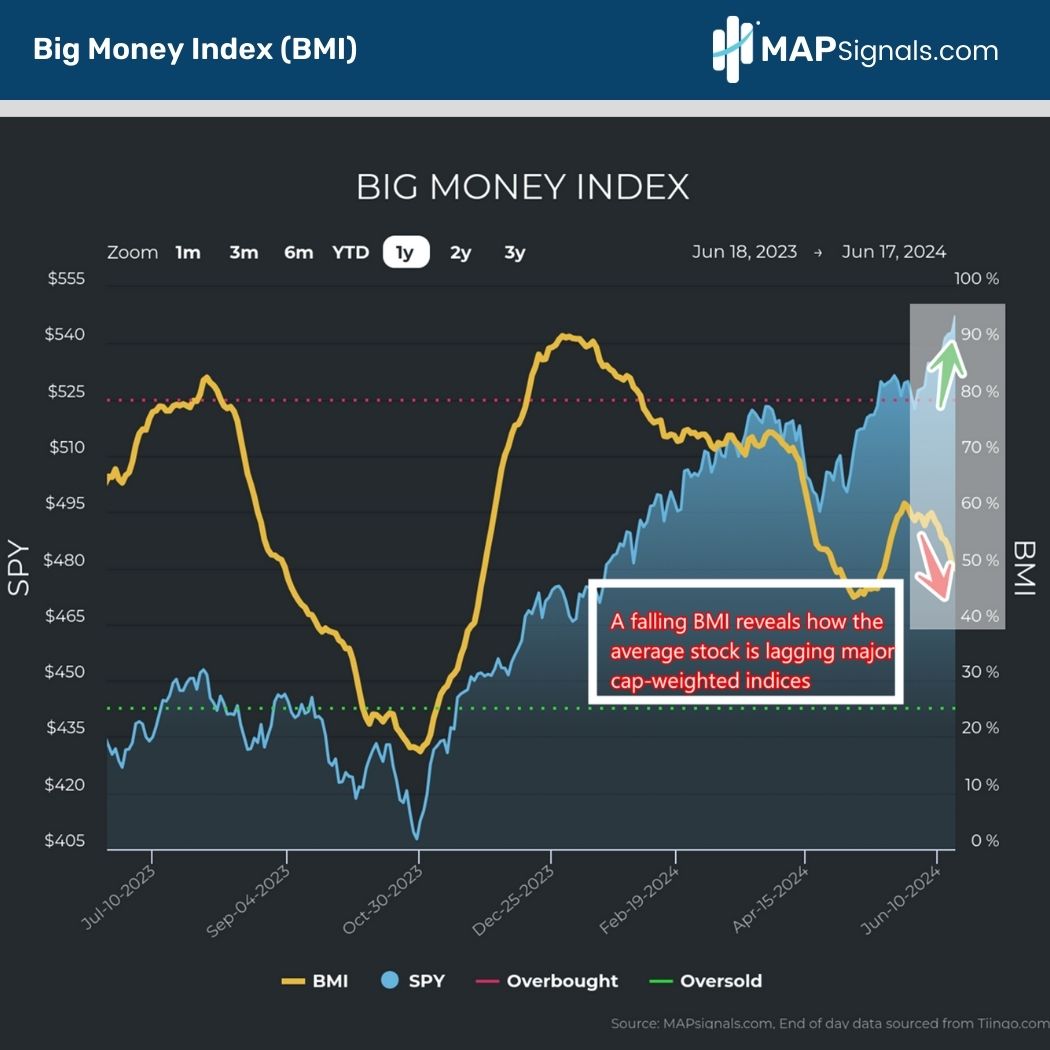
Case in point, our trusty Big Money Index (BMI) reveals this truth beautifully. If the BMI is falling, it indicates that the total number of stocks getting sold is higher than the number getting bought.
Said another way, the average stock is falling behind:
Now, we know this because at MAPsignals we can easily see the names getting accumulated each day.
As stated last week, massive money has been flowing into mega-cap semiconductors for months.
But there are other ways to visualize the dichotomy in equities. One look at a few different baskets of the S&P 500, points to the massive underperformance of the average stock.
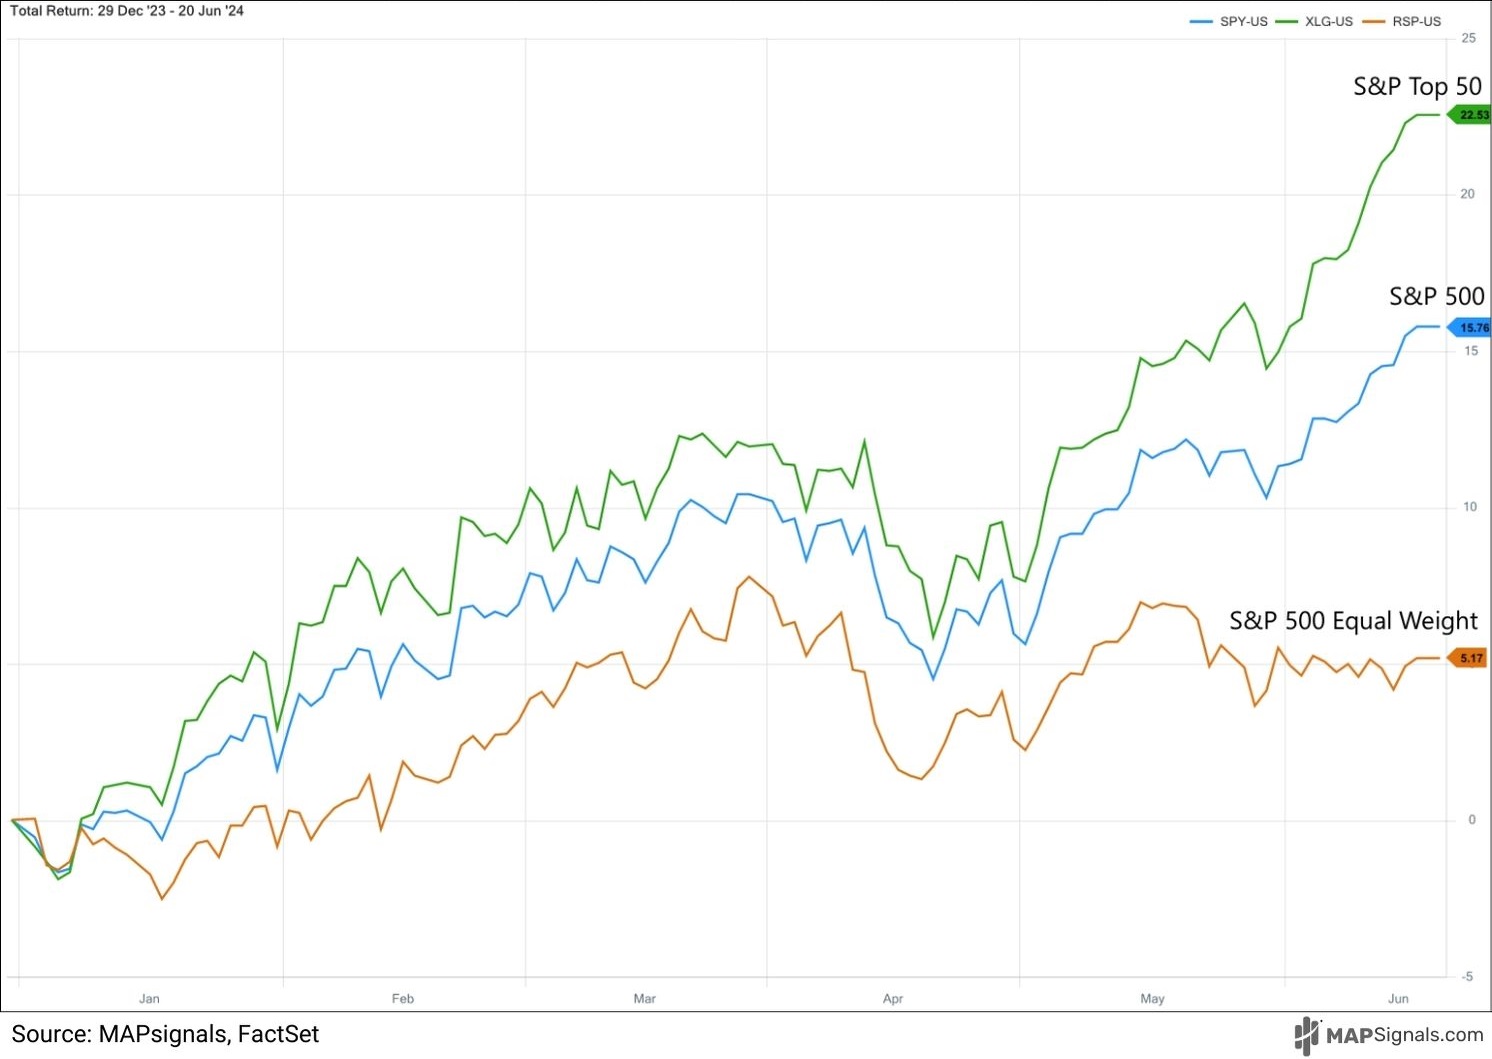
Below we can see how the top 50 stocks in the S&P 500 (XLG ETF) have gained +22.53% in 2024.
That easily beats the S&P 500’s (SPY ETF) jump of +15.76% and dramatically crushes the S&P 500 equal weight basket (RSP ETF) YTD performance of +5.17%:
But there’s one other way to note the major market dichotomy.
When you look at a ratio chart of the S&P 500 equal weight basket (RSP ETF) relative to the S&P 500 (SPY ETF), you’ll see that we’re sitting at the weakest breadth point since 2008.
Currently the RSP/SPY ratio sits at nearly 30%.
If you want to rattle the bear cages, show them this free-falling chart:
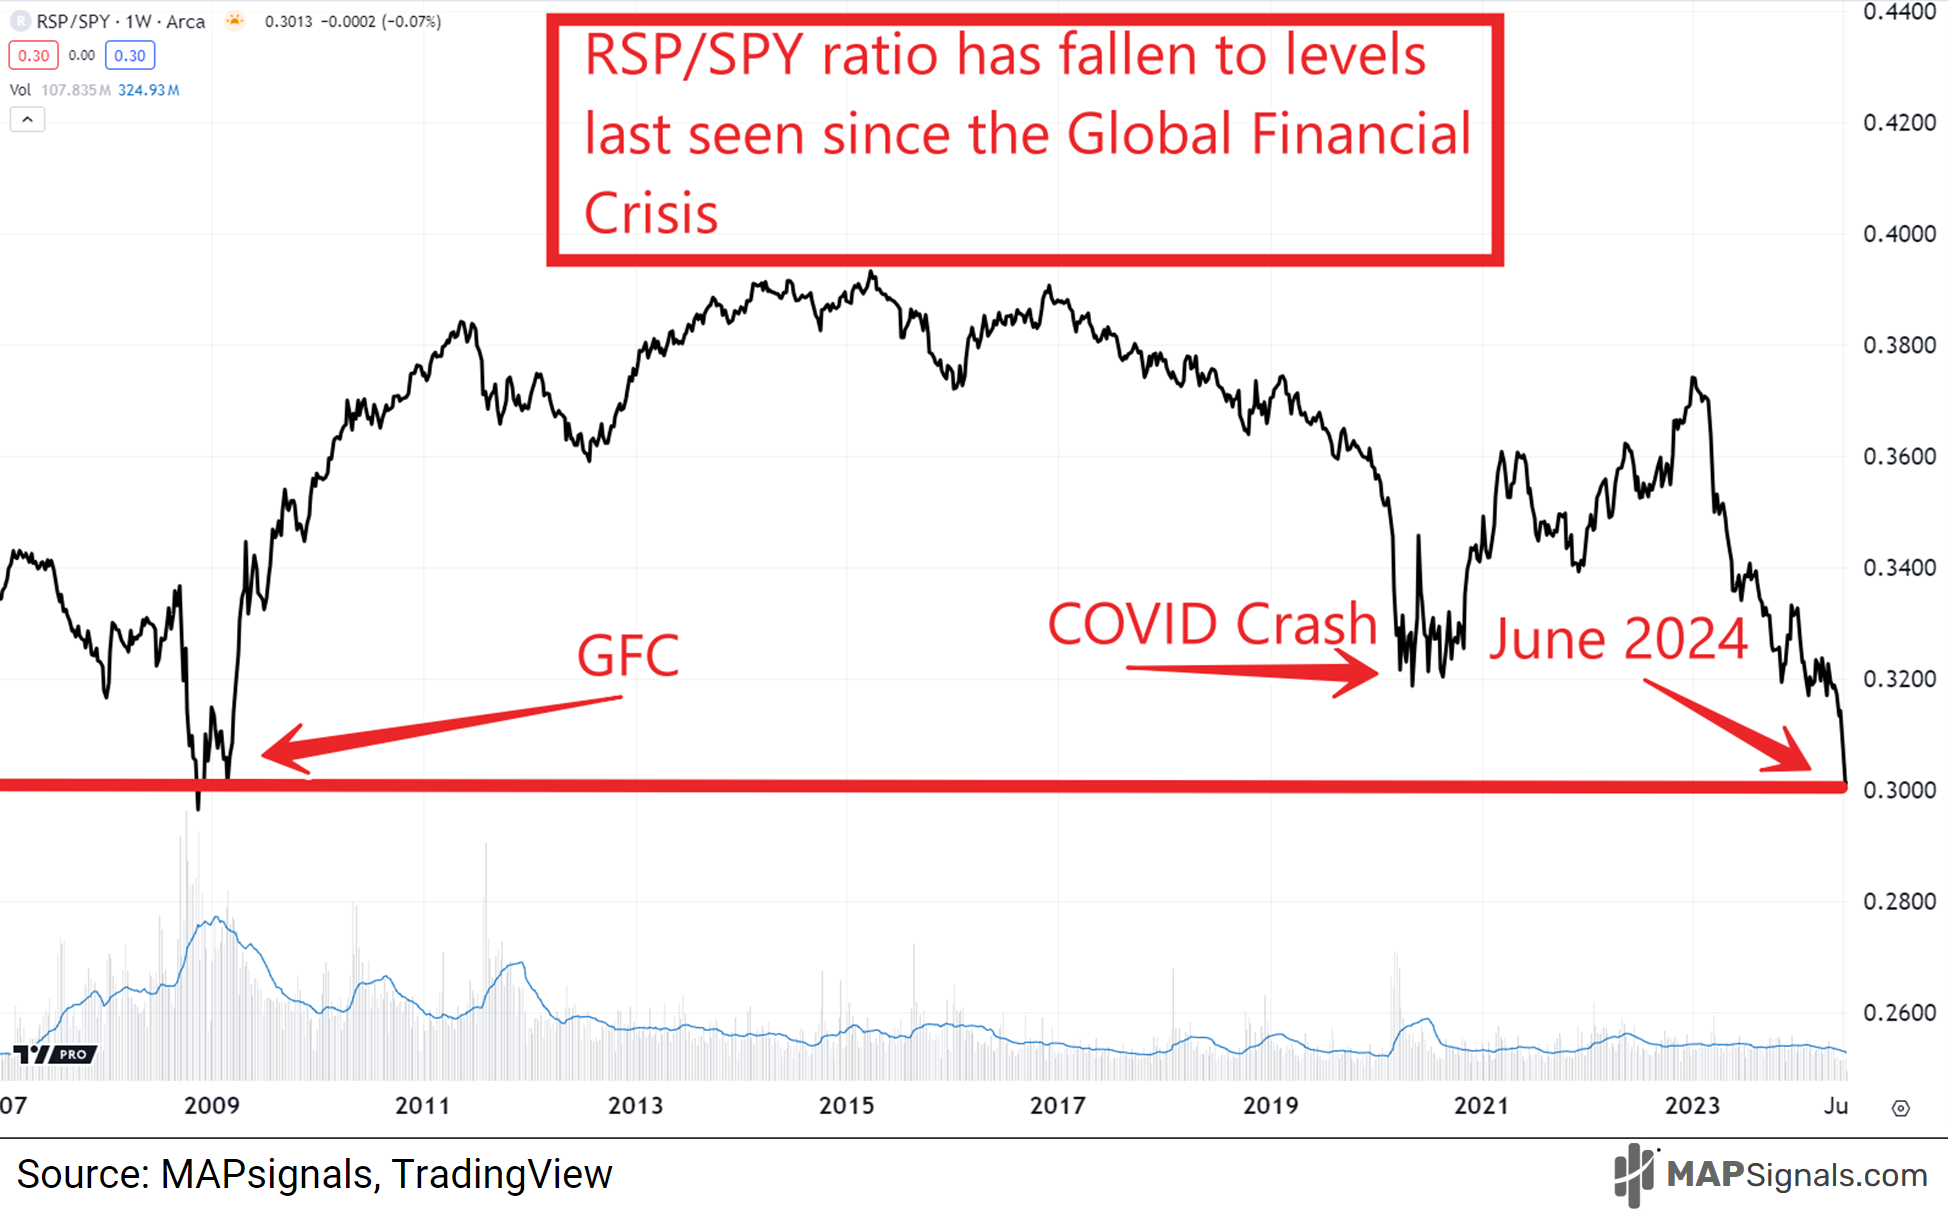
This ratio chart has gotten a lot of traction in the media lately as pundits proclaim this relative weakness is uber bearish for markets.
Afterall, the last few times we approached these levels was ugly periods for markets: 30% ratio reading in the depths of 2008 and 2009, a 32% reading during the COVID crash of 2020, and the 30% readings found today.
I’ll be honest, I almost fell for the bait.
That is, until I studied history. And she had one message that you need to hear: Get ready for a monster reversion trade for the ages!
Get Ready for a Monster Reversion Trade for the Ages
MAPsignals is all about bringing you evidence-based research that flies in the face of the talking-heads in the media.
Before you bailout on your underperforming stocks, have a look at the following pieces of evidence suggesting you should sit tight.
And if you’re bold, start buying the beaten down dogs…
I went back and singled out all days when the RSP/SPY ratio fell below 32%. Basically, I needed to understand what we should expect for stocks going forward.
As a reminder, the 32% threshold amounts to 201 trading dates that triggered during the Global Financial Crisis lows, the COVID crash lows, and the relative lows seen recently.
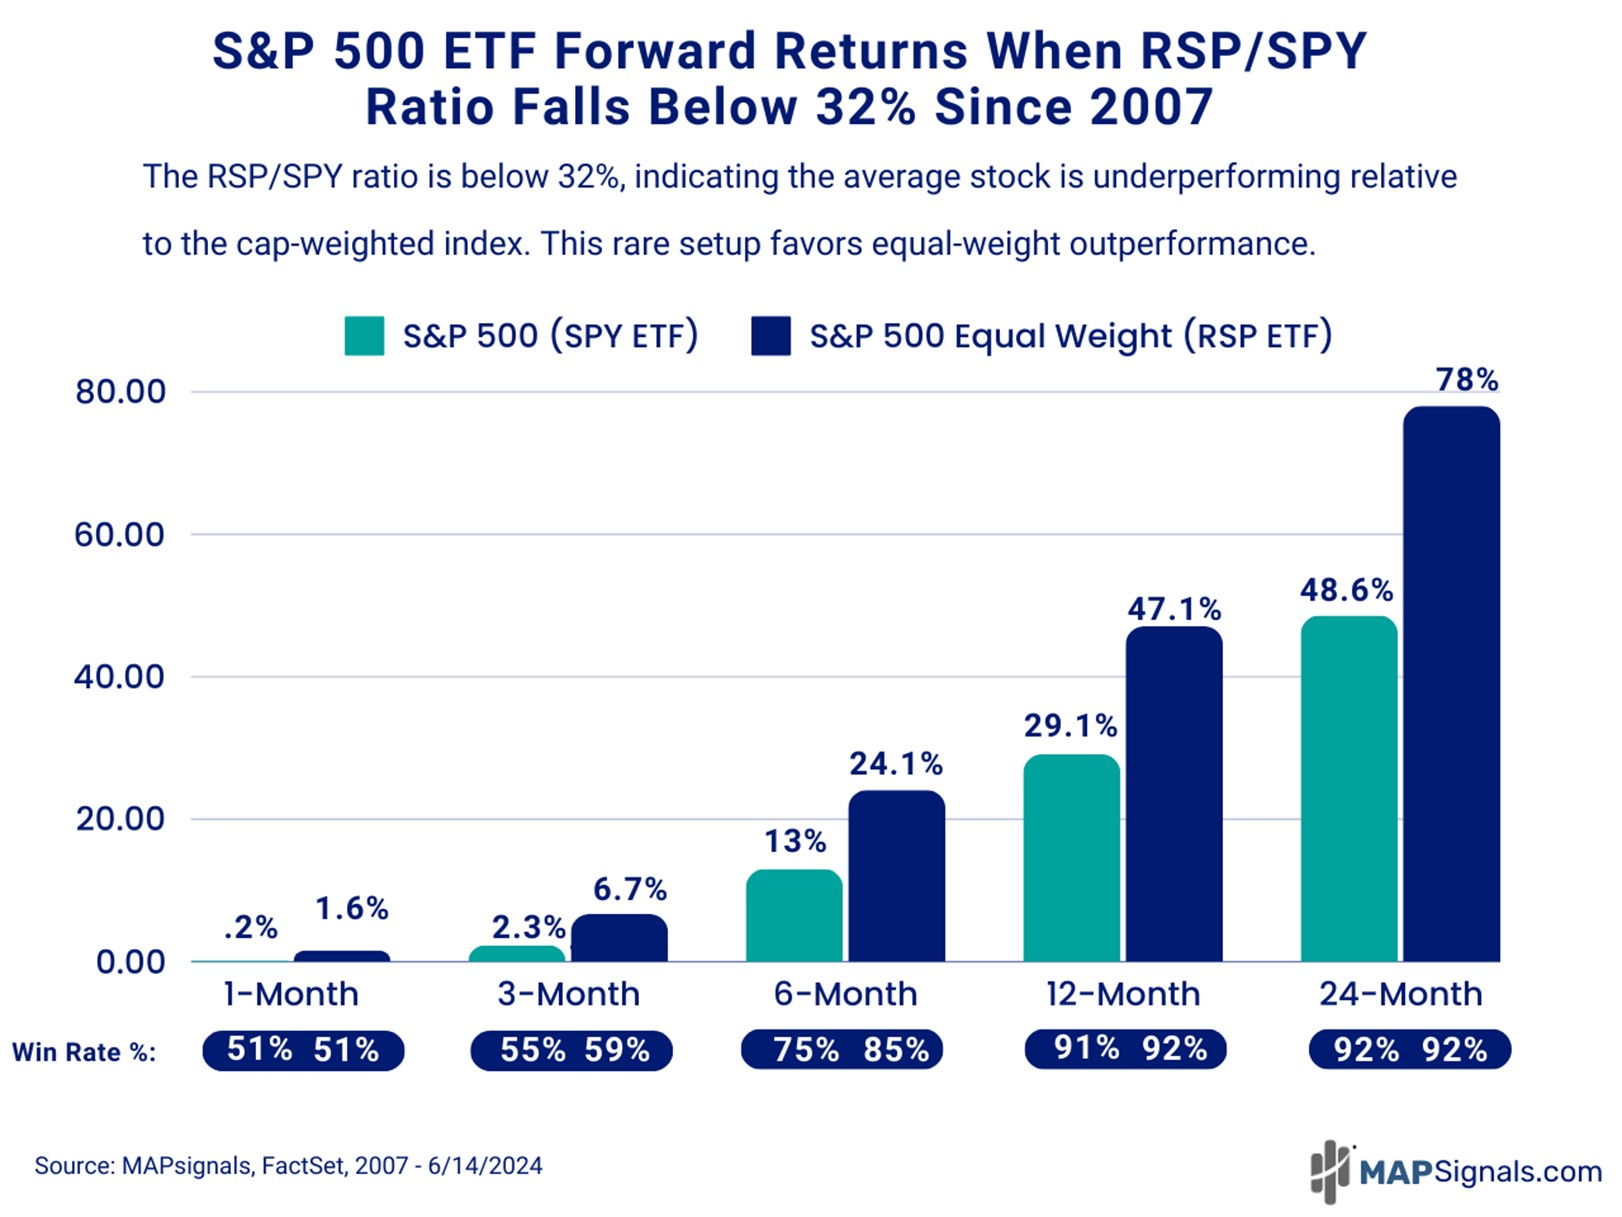
Here’s what happened next. The S&P 500 (SPY ETF) did just fine. But the S&P 500 Equal Weight Fund (RSP ETF) was spectacular.
When the RSP/SPY ratio fell to 32% or lower since 2007:
- 6-months later the S&P 500 jumped 13% while the S&P 500 Equal Weight basket soared 24.1%
- 12-months later clocked gains of 29.1% for SPY and 47.1% gains for RSP
- 24-months after saw SPY jump 48.6% and RSP catapult 78%
This is why you need to get ready for a monster reversion trade for the ages.
Normally, I’d stop here and call it a day. BUT there’s more to this story.
It gets better…a lot better.
When you single out RSP/SPY ratio readings of 31% or lower, the opportunity only increases.
Folks, magnitude is important!
Here is the chart of the week that you should share with your friends!
Whenever the RSP/SPY ratio falls to 31% or lower since 2007:
- 3-months later RSP rips 7.4%, easily outpacing SPY’s 1.6% pump
- 6-months later RSP jumps 29.7% vs SPY’s 16% performance
- 12-months out, RSP jolts 57% compared to SPY’s 35.8% rally
- 24-months later, RSP is up an incredible 92% – crushing SPY’s 57.6% gains
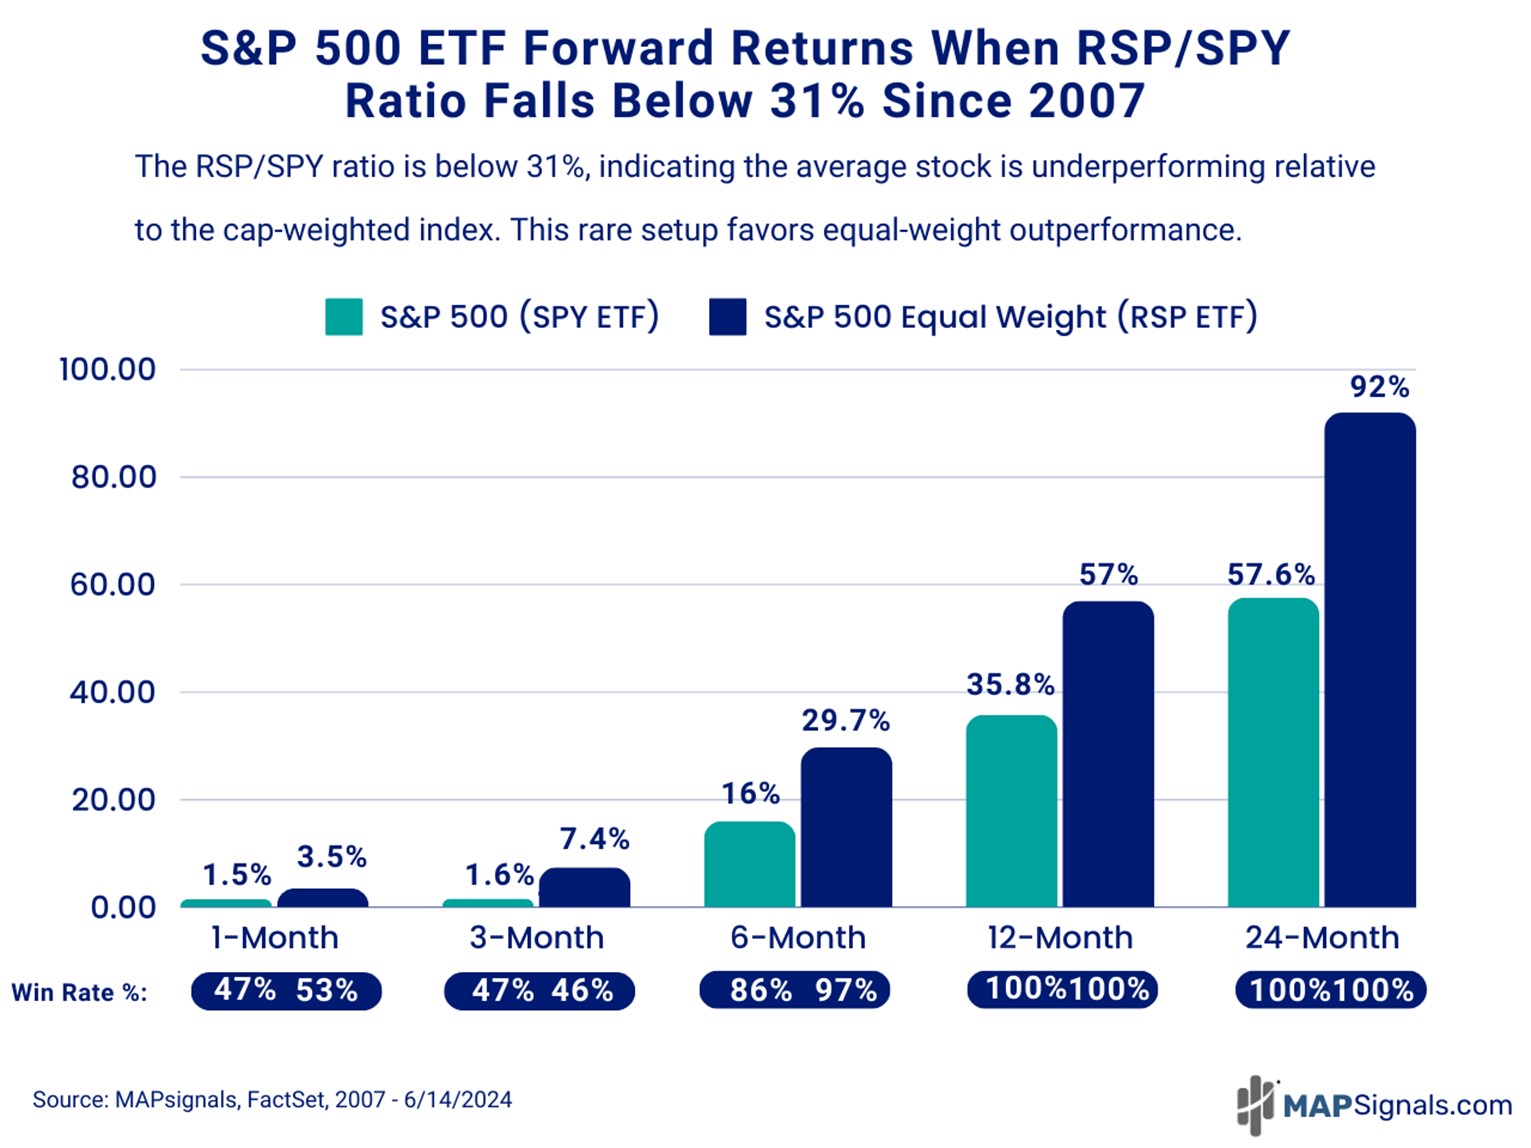
Keep in mind a startling fact. RSP/SPY ratio readings of 31% or lower have resulted in 100%-win rates in both the S&P 500 and S&P 500 Equal Weight indexes a year and 2 years later.
This signal reinforces what we said last week: Now’s the best time in history to a be stock picker.
Get ready for a monster reversion trade for the ages…
Using a MAP will help you spot tomorrow’s biggest opportunity.
Here’s the bottom line: The stock market rally can keep going. Better yet, all stocks should begin to participate in the coming months…and years.
Market breadth readings indicate an undeniable truth: most stocks in the S&P 500 are vastly underperforming a handful of mega-cap behemoths.
Since 2007, this trend has rarely lasted long. More importantly, the setup is incredibly bullish for the under-loved stocks in the market.
If history is a guide, we will be looking at a monster reversion trade where the equal weighted S&P will play catch up to the market bellwethers.
Once this powerful trend begins, you can bet that MAPsignals unique data will be all over it…highlighting tomorrow’s winners today.
Just like we did with Super Micro Computer (SMCI) and e.l.f. Beauty (ELF) 2 years ago…and NVIDIA (NVDA) back in 2015…and countless others.
If you’re looking for cutting-edge hedge fund quality research, get started with a MAP PRO subscription and see for yourself the power of institutional money flows.
Don’t wait for the media to blow the bull whistle…you’ll miss the train.
Money flows will signal the green light.
There’s never been a better time in history to own a stock market MAP!
LASTLY, join us live at the MoneyShow Masters Symposium in Las Vegas as we dive into our 2024 Election Year Playbook.