• Menu
  • Skip to right header navigation
  • Skip to main content
  • Skip to primary sidebar
  • Skip to footer

MAPsignals

We map big money.

  • Latest Insights
  • Power of MAP
    • MAP Products
    • MAP System
    • White Papers
    • Videos & Interviews
  • Profit with MAP
  • About
    • About MAP
    • MAP Team
    • Authors
    • MAP System
    • MAP Products
    • Big Money Index
  • Members
    • Get Started With MAP
    • My MAP
    • Big Money Charts
    • MAP View
    • MAP View Options
    • MAP Top 20 Weekly
    • MAP 50
    • Member Updates
    • Platinum Updates
    • Members Only Posts
    • Performance
  • Portal

Get Ready For Summer Volatility

July 8, 2021 //  by Lucas Downey//  6 Comments

July and August normally means school’s out and it’s time for fun in the sun.

To traders, it means get ready for summer volatility.

get ready for summer volatility

Face it: we’re mid-summer and most of us are focused on relaxing. And while the world is finally reopening from the pandemic, taking a relaxing break makes a lot of sense right now.

Kids go to camp and Wall Street traders tee up their mandatory 2-week vacations. And before traders check out, it’s normal for them to button up risk while they’re out. Their mindset is to flatten out their books and chill.

When traders drop stocks for rosé – fun in the sun means liquidity dries up. They say when the cat’s away the mice will play: with less traders trading, stocks get whippy. High-frequency traders and algorithms take advantage of lower liquidity to push stocks around. Volatility usually increases.

That’s precisely what we’ve come to expect for summer months.

A good friend always says that they should just close the markets in August and reopen in September. And for good reason: Typically, the summer months, especially August, are volatile.

History says to expect a bumpy patch near-term. Our data is starting to shift too. Until last week, bulls were in full force as buyers led the charge. But recently that tone has shifted.

Some of our indicators are suddenly telling us to get ready for summer volatility. But we should also have a plan. Short-term it will likely be bumpy. But, don’t get too bearish, because as I’ll show you, a green zone will come too.

That’s where the opportunity is.

So let’s first check in on our changing data.

Big Money Index Get Ready For Summer Volatility

Up until this week, our data has been bullish. That means buyers were plentiful. But, suddenly that’s changing.

Tuesday and Wednesday saw a notable pick-up in selling, putting pressure on the Big Money Index:

big money index

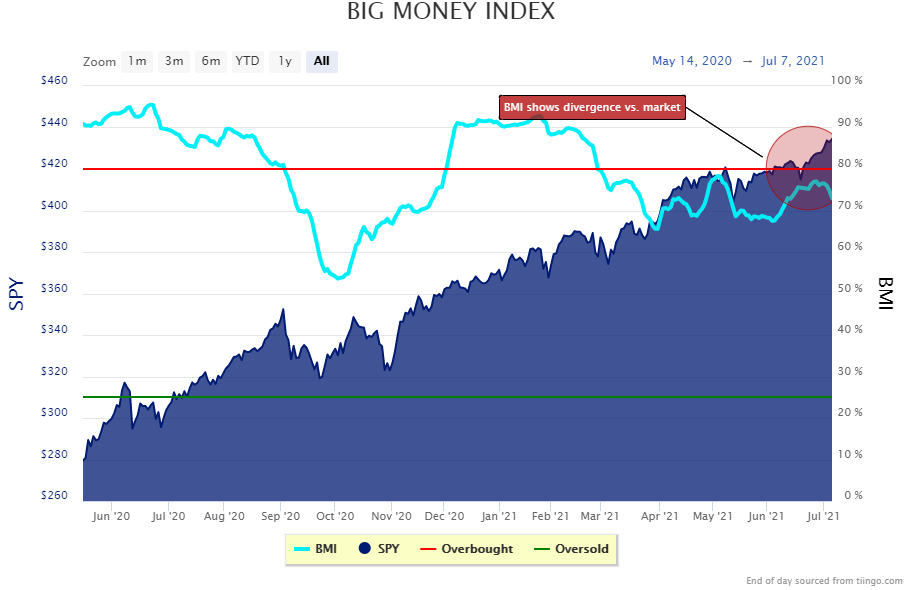
Circled to the right, you can see  a divergence happening in our data. Selling is increasing as the market makes new all-time highs. This points to weakening breadth while leadership is thinning.

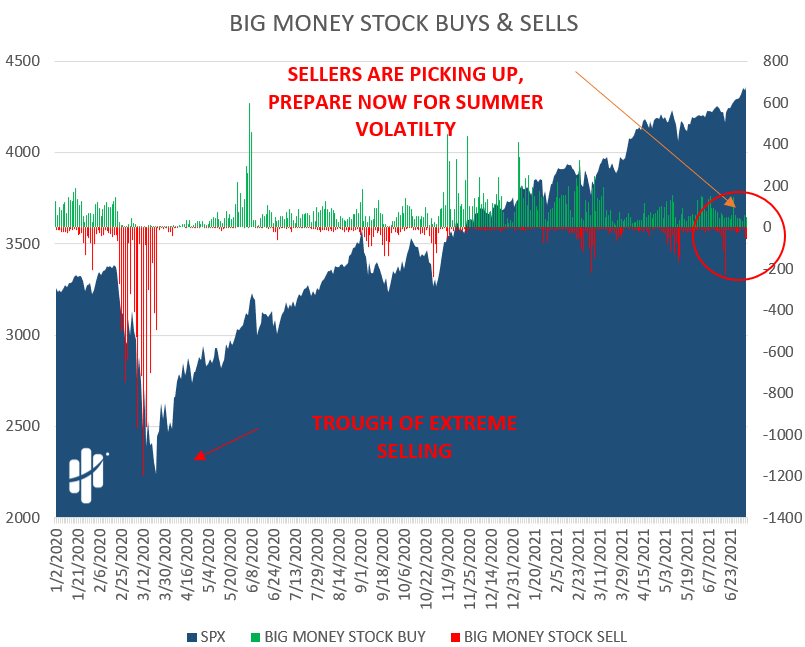
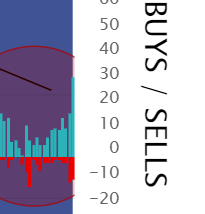
And you can see this same pattern under the surface of the BMI. The number of stocks firing sell signals is increasing:

Selling in stocks is increasing

Here’s a closer look:

stock selling close up

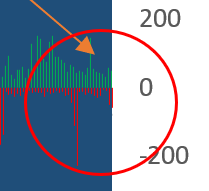
You can see the obvious uptick in red over the last 2 days, but also notice the decline in green too. Those shorter green bars show less stocks getting bought compared to a few weeks ago.

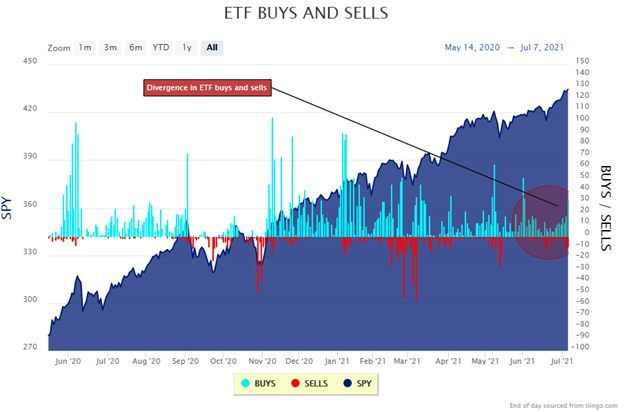
We notice the same type of action in ETFs too. Yesterday had quite a bit of buying, but also an uptick in selling. This divergence is also telling us to get ready for summer volatility:

etf selling is picking up

Here’s a zoom-in:

etf zoom in

ETFs that saw buying were bonds, technology, & healthcare. The ones getting sold were banks & Chinese stocks.

So, from a data standpoint, the message is to get ready for more rips and dips.

And history agrees.

July And August Are Historically Volatile Months For Stocks

It’s one thing when data suggests near-term pressure, it’s another altogether when history says to expect it too.

This morning I ran some numbers and found since 1996, the S&P 500 (SPY ETF) tends to produce mediocre results in July & August:

july and august stocks are muted

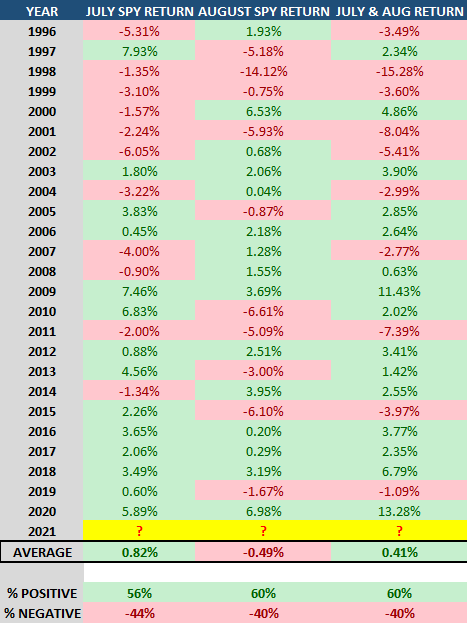
As seen above, July is a positive month a little better than half of the time, while August averages a negative expectancy. The two months together don’t look exciting with a market average of just +.41% return. This fits with our narrative to get ready for summer volatility.

But that’s only half the story. Remember earlier when I told you there’s a green zone coming?

What I also found in this study is what comes after the summer is JUICE.

For the past 25 years, September – December is incredibly green:

september through december are strong for stocks

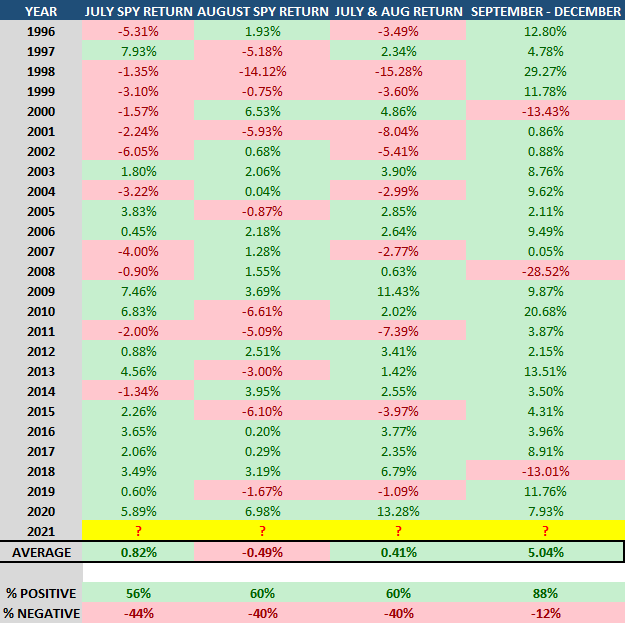
Based on this table, history shows us that the 4 months of September – December have a historical average of just over 5%. That’s 11X greater than the +.41% expectancy of the combined July and August months. Obviously this isn’t an apples to apples comparison, but it does suggest something…

Heading into year-end usually means rocket launch time. That’s mega juice!

So, let’s tie this all together.

Here’s the bottom line: Stock and ETF selling is increasing, putting pressure on the Big Money Index. If the BMI falls further, we expect that stocks will follow. And history shows that July and August are lackluster for market returns.

Get ready for summer volatility. But also prepare for what comes next: July and August lead into a historically green time of year: September – December.

If you’re an active trader, consider trimming non-core positions.

If you’re like us, start making your outlier shopping list. Sometimes Christmas comes in July.

Lucas Downey
Lucas Downey

Lucas is co-founder of MAPsignals. His full bio can be found here.
Prior to MAP, he was Head of ETF Sales at Cantor Fitzgerald & SVP of Derivatives at Jefferies, LLC.

Spread the word!

Category: All, Big Money Insights Weekly

Previous Post: «stocks are setting up for more highs Stocks Are Setting Up For More Highs
Next Post: Best Growth Stocks for August 2021 best growth stocks for august 2021»

Reader Interactions

Comments

  1. Joe

    July 8, 2021 at 1:46 pm

    Accurate and precise stock market almanac is definitely a sought after treasure, however, we prefer to sell it to the gullible than buy the seasonal masterpiece.

    Expect bumpy rides and consider getting vaccinated provided you still have a thumping, beating heart. Seemingly the easy cherry picking season has passed.

    For the bold, courageous and mavericks, it would be prudent to accept that the game is apparently aligned with the Virtu and Citadels of the world. Au revoir!

    Reply
    • MAPsignals Staff

      July 8, 2021 at 2:54 pm

      Now don’t get too bearish! This is one of the biggest bull markets of our lifetimes! Fortunes have been made to the patient.

      Reply
  2. Greg

    July 8, 2021 at 7:29 pm

    Hello, Can you comment on QFIN and if you are still bullish or with the impact on Chinese stocks, are you selling?

    Thank you; enjoy the emails.

    Reply
    • MAPsignals Staff

      July 8, 2021 at 7:43 pm

      Usually once a year there’s a China scare that wallops the space. Some good names are getting dragged down unfairly.

      On the trading desk we used to sell first and ask questions later. That’s what’s happening now as weak hands hit bids. Selling begets more selling and so on.

      We still like the name long-term and we hold some personal names feeling the heat. As far as our core long-term holdings, we have zero interest in selling those. Eventually the fear settles down and the cream rises to the top.

      Reply
  3. iancuj

    July 10, 2021 at 4:26 pm

    Hi! Have you try to use an 20EMA instead of 25SMA? EMA will catch movements faster. And I quite did not grasp it why you use an 25SMA instead of the standard 20SMA.
    Thank you for everything!

    Reply
    • MAPsignals Staff

      July 11, 2021 at 2:16 pm

      Hey Ian –

      Yes we tried many different moving averages. We found that 25 acted the best. The 25dma allowed for less bounce-outs than the shorter moving averages.

      That being said, being able to change the MAs is a good idea for those with shorter time frames.

      Reply

Leave a Reply Cancel reply

Your email address will not be published. Required fields are marked *

Primary Sidebar

Get Big Money Insights for FREE

Want to know where the Big Money is headed?

Just enter your email address below. You'll get our FREE NEWSLETTER sent directly to your inbox.

We call it Big Money Insights... It’s your weekly sneak peek at the powerful market-moving forces that are hidden from 99% of investors.

"*" indicates required fields

This field is for validation purposes and should be left unchanged.

Categories

  • All
  • Big Money Insights Weekly
  • Big Money Series
  • Macro Insights
  • MAP In The Media
  • Members Only
  • Performance
  • Podcast
  • Special Reports
  • Stocks
  • Videos & Interviews
  • White Papers

Archives

  • June 2022
  • May 2022
  • April 2022
  • March 2022
  • February 2022
  • January 2022
  • December 2021
  • November 2021
  • October 2021
  • September 2021
  • August 2021
  • July 2021
  • June 2021
  • May 2021
  • April 2021
  • March 2021
  • February 2021
  • January 2021
  • December 2020
  • November 2020
  • October 2020
  • September 2020
  • August 2020
  • July 2020
  • June 2020
  • May 2020
  • April 2020
  • March 2020
  • February 2020
  • January 2020
  • December 2019
  • November 2019
  • October 2019
  • September 2019
  • August 2019
  • July 2019
  • June 2019
  • May 2019
  • April 2019
  • March 2019
  • February 2019
  • January 2019
  • December 2018
  • November 2018
  • October 2018
  • September 2018
  • August 2018

Follow us on Twitter

MAPsignals Follow 619 842

MAPsignals is a data platform that tracks institutional money flows in and out of the market.

mapsignals
mapsignals avatar; MAPsignals @mapsignals ·
30 Jun 1542518642461384709

The first half of 2022 is in the books.

The #bearmarket has sent #stocks tumbling.

Today, @LukeDowney reviews how sectors performed YTD and highlights two #sectors primed for upside. $XLY $XLK

Read here: https://mapsignals.com/map-blog/two-sectors-are-primed-for-upside/

Image for the Tweet beginning: The first half of 2022 Twitter feed image.
Reply on Twitter 1542518642461384709 Retweet on Twitter 1542518642461384709 0 Like on Twitter 1542518642461384709 1 Twitter 1542518642461384709
Load More...

Subscribe To Our YouTube Channel

MAPsignals

MAPsignals
#Capitulation #BearMarket2022 #StockMarketSelloff
Stock market capitulation is here. In this video, Luke dives into what capitulation is and what it means for stocks. Check out our latest blog post: https://mapsignals.com/map-blog/

What does capitulation mean for markets? It is when there's no leadership and investors throw in the towel. You've heard the saying, "sell first, ask question later?" That's how Wall Street thinks.

But these rare moments often lead to bargains for stocks. Capitulation can often lead to bottoms being formed in stocks.

As Lucas Downey shows, these moments are usually when investors should focus on quality companies in this bear market environment. Long-term is the best mindset in a bear market.

The best stock market analysis we've found is following the Big Money. MAPsignals doesn't argue with data.

Learn more at www.MAPsignals.com
Remember this is not personal investment advice of any kind. This video is for entertainment purposes only. Our focus is to help investors make sense of markets with data.

Our disclaimer can be found here: https://mapsignals.com/contact/

Music by Karl Casey @ White Bat Audio
Stock Market Capitulation is Here | Bear Market 2022
YouTube Video UC4nueJix0bSLmZyilUuCVrQ_xzXHj_aJvss
Load More... Subscribe

Footer

© 2021 Mapsignals.com

  • Home
  • Contact & Disclaimer
  • Privacy Policy
  • Terms & Conditions
  • Cookie Policy (US)
  • FAQ

Copyright © 2022 · Mai Law Pro on Genesis Framework · WordPress · Log in

✕
What Happened to Risk Assets White Paper is Here

Get your copy here and take a journey through our thoughts on margin and leverage.

Enter your email address below and you'll get our FREE NEWSLETTER sent directly to your inbox. 

 We call it Big Money Insights... It’s your weekly sneak peek at the powerful market-moving forces that are hidden from 99% of investors.

Manage Cookie Consent
We use cookies to optimize our website and our service.
Functional Always active
The technical storage or access is strictly necessary for the legitimate purpose of enabling the use of a specific service explicitly requested by the subscriber or user, or for the sole purpose of carrying out the transmission of a communication over an electronic communications network.
Preferences
The technical storage or access is necessary for the legitimate purpose of storing preferences that are not requested by the subscriber or user.
Statistics
The technical storage or access that is used exclusively for statistical purposes. The technical storage or access that is used exclusively for anonymous statistical purposes. Without a subpoena, voluntary compliance on the part of your Internet Service Provider, or additional records from a third party, information stored or retrieved for this purpose alone cannot usually be used to identify you.
Marketing
The technical storage or access is required to create user profiles to send advertising, or to track the user on a website or across several websites for similar marketing purposes.
Manage options Manage services Manage vendors Read more about these purposes
View preferences
{title} {title} {title}