
Hidden Bullish Breadth in Technology Stocks
Trading should be simple.
Follow trusty time-tested indicators and call it a day.
Markets are making new highs, stunning the crowd.
One big reason is the hidden bullish breadth in technology stocks.
Let’s rewind the tape. Just 2 short months ago, stocks were sold with abandon. Fed speak caused many investors to 2nd guess the merry-go-round path of interest rates.
Our data signaled a massive buy signal that rarely comes along.
Capitulation is one of the best times to strap on the helmet…and get in there. When the crowd is cryin’…start buyin’.
Today, we’ll size up the money flows picture and illustrate the powerful hidden breadth in technology stocks.
We’ll even showcase new charts…then highlight 2 names loved by institutions.
Stocks Climb the Wall of Worry as the Big Money Index Breaks Out
I could list countless reasons to be fearful. 3 of the biggest headlines revolve around trade wars, interest rates, and inflation.
Truthfully the list goes on and on.
I can list 1 simple reason to be constructive: Money Flows.
That’s right, when you’ve handled institutional orders on Wall Street, you learn that one power law rules all other – supply and demand.
When demand increases, fighting that trend is losing battle.
Don’t follow fear-driven headlines. Follow the money flows with the Big Money Index (BMI). It’s at a 2-month high, indicating healthy risk-on action:
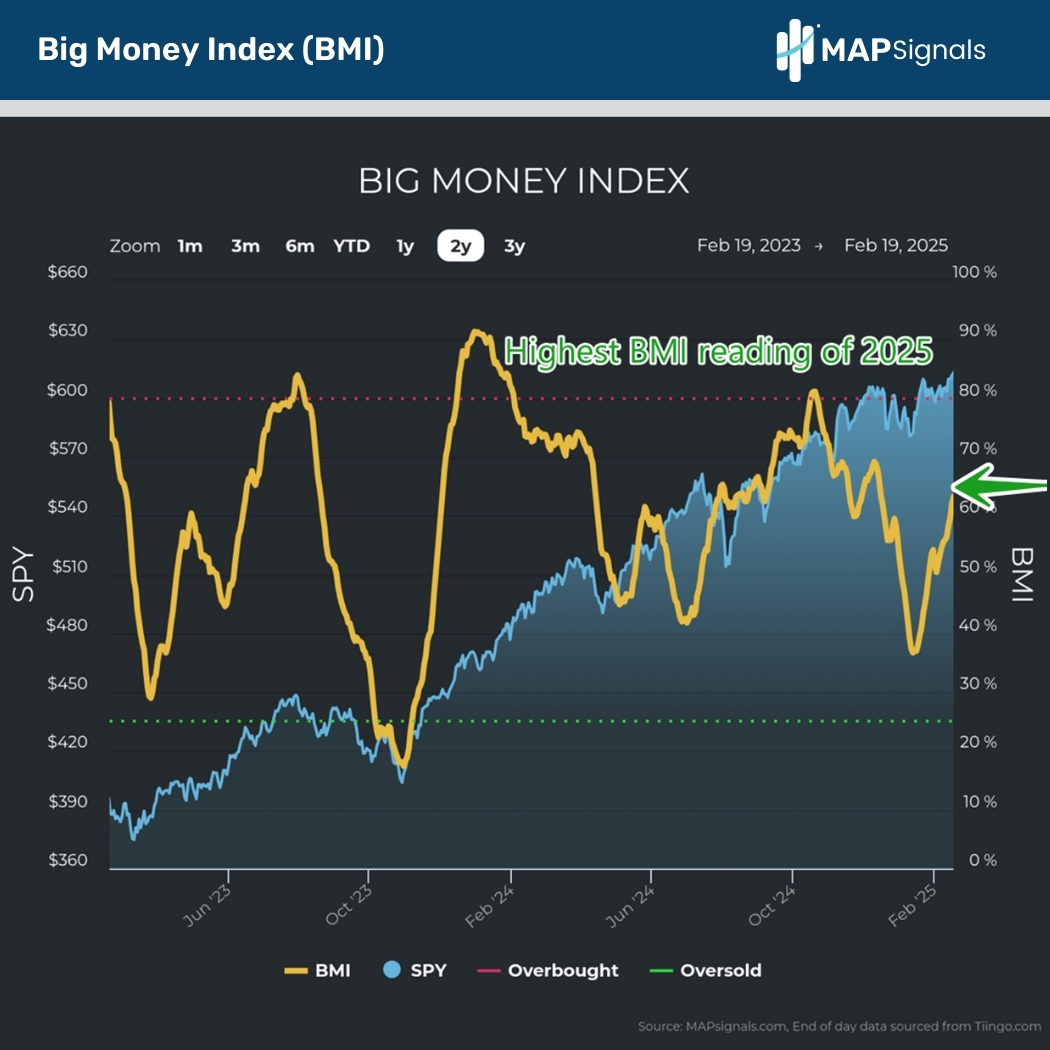
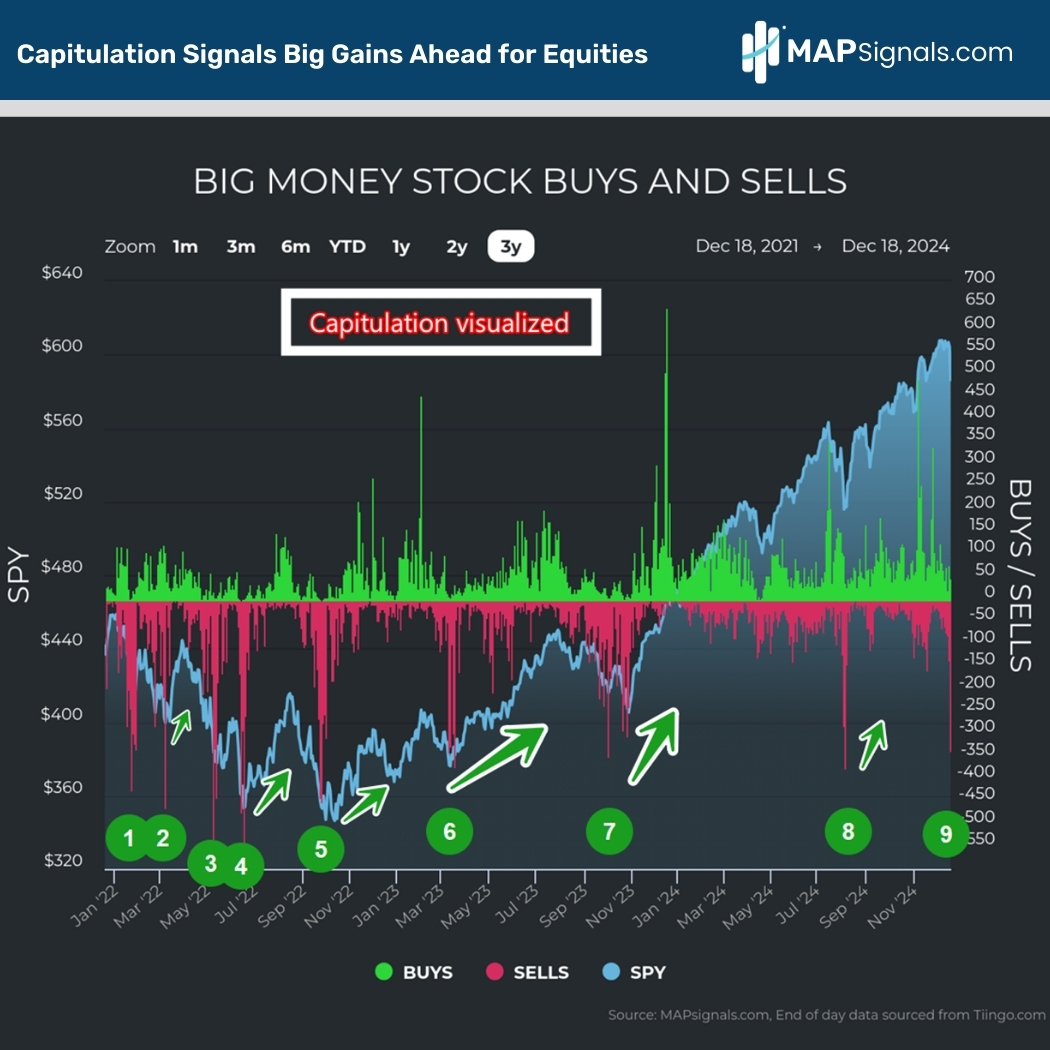
This steady 2-month climb sprouted from a painful selloff that hit in December. Here’s the capitulation event we showed back on December 18th when 334 stocks were liquidated.
Note how prior capitulation days offered a nice buy window:
We were so confident that stocks would bounce back, we added a signal study spotlighting what happens post these forced-selling events.
A month later, all S&P indices are up on average:
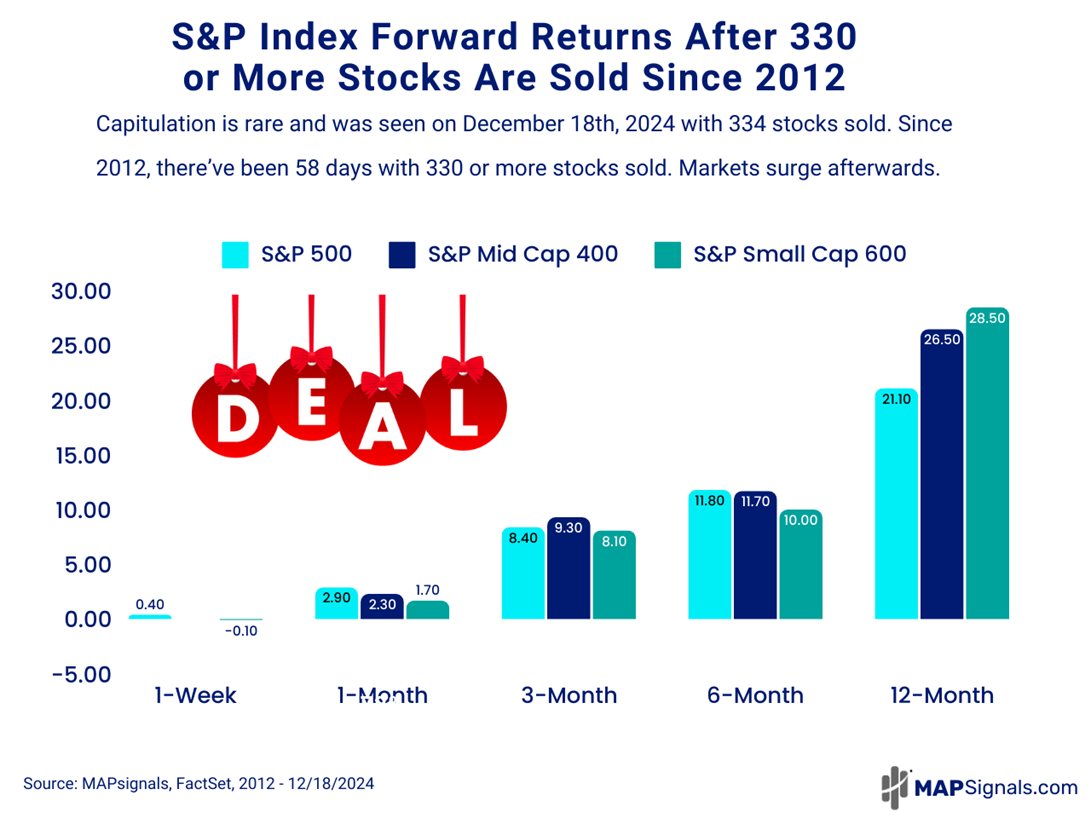
How did we do? Well, the S&P 500 is up 4.84% and Mid-caps jumped 3.09% since that bear-beating post. Even small-caps are up a modest 1.25%.
But inside all these benchmarks is the hidden fact that Technology stocks are riding a wave of continuous inflows.
Hidden Bullish Breadth in Technology Stocks
When the money flow backdrop is strong, dive below the surface. Unlock the hidden catalyst.
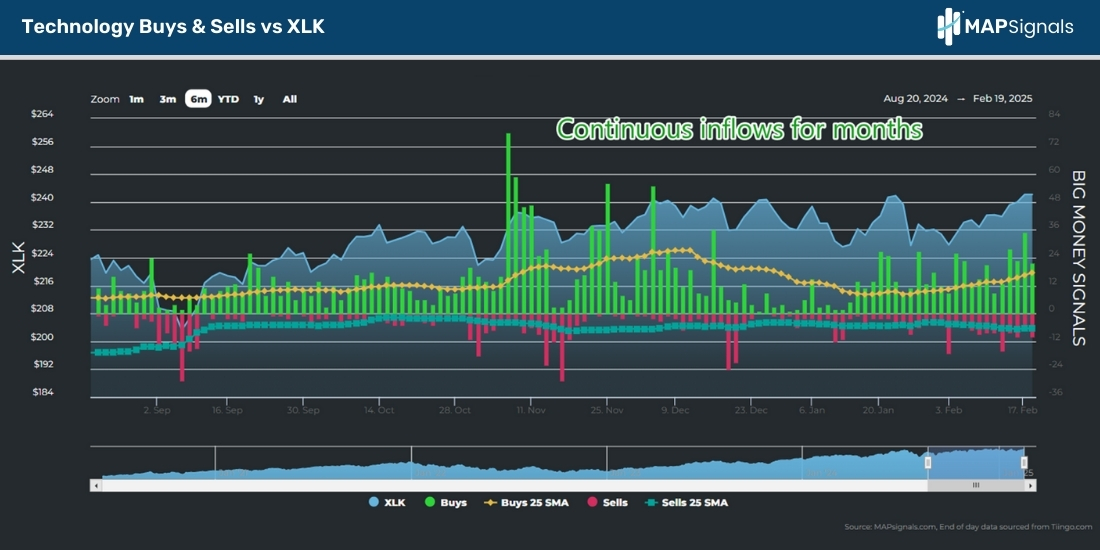
Below is a snapshot of our inflows and outflows in our Technology stock universe. I want to draw your attention to 2 facts:
- First, note how mid-December saw red bars indicating selling
- Second and most important, see how those red bars vanished, indicating that buy demand swooped in to tame the selloff
We have the Technology Select Sector SPDR Fund (XLK) as a benchmark to show correlation:
Why money flows are so important is because it can often give a differing picture than other popular breadth indicators.
A case in point is the following graphic.
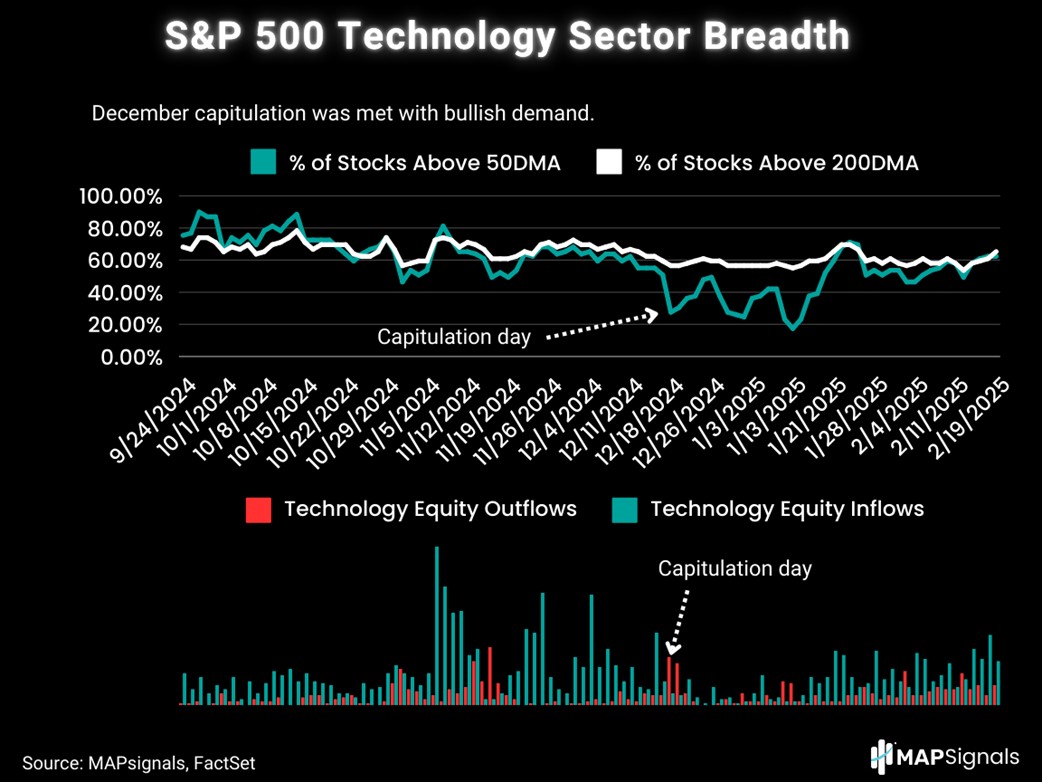
Here I’ve plotted on top the 50dma and 200dma of the constituents of the S&P 500 Technology sector.
It reveals how the 50dma breadth was declining and stayed muted for over a month beginning near the capitulation event in December.
What the MAPsignals data on bottom spotlights is that capitulation came and vanished days later. Buy pressure met the outflows, creating a bottoming signal.
A vanishing of selling…is bullish.
This is the hidden bullish breadth in Technology stocks:
Looking back, it can be difficult to forecast the future. That said, we were convinced the evidence painted a very constructive picture.
One that rarely comes along.
Here are the 2 top-ranked Technology stocks we showcased on our weekly Top 20 report during the capitulation event.