• Menu
  • Skip to right header navigation
  • Skip to main content
  • Skip to primary sidebar
  • Skip to footer

MAPsignals

We map big money.

  • Latest Insights
  • Power of MAP
    • MAP Products
    • MAP System
    • MAP White Papers
    • Videos & Interviews
  • Profit with MAP
  • About
    • About MAP
    • MAP Team
    • Authors
    • MAP System
    • MAP Products
    • Big Money Index
  • Members
    • Get Started With MAP
    • My MAP
    • Big Money Charts
    • MAP View
    • MAP View Options
    • MAP Top 20 Weekly
    • MAP 50
    • Member Updates
    • Platinum Updates
    • Members Only Posts
    • Performance
  • Portal

Holding Aces

April 2, 2020 //  by Lucas Downey//  7 Comments

In heads-up Hold’em, pocket aces have an 81% chance to win the hand.

Can you still lose with pocket aces? Yes.

Right now our data is showing positive signs.

There are good bets, bad bets, winning bets, and losing bets. Making good bets is how you win big over the long-run.

Signs point to pocket aces for Mapsignals – ie, a good bet.

holding aces

Extreme Oversold Periods Like Now

It’s super rare to see this much selling.

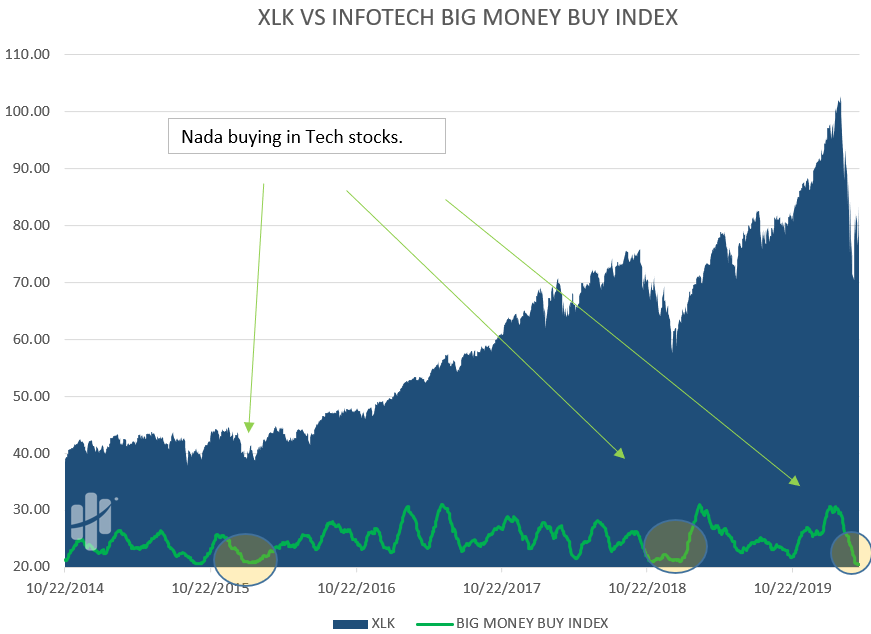
Have a look at our Big Money Index. It tracks big money moving in and out of stocks.

If it’s heading lower, big selling is happening. If it’s heading up, big buyers are showing up.

Last week clocked a 9% reading…that folks, is incredibly rare.

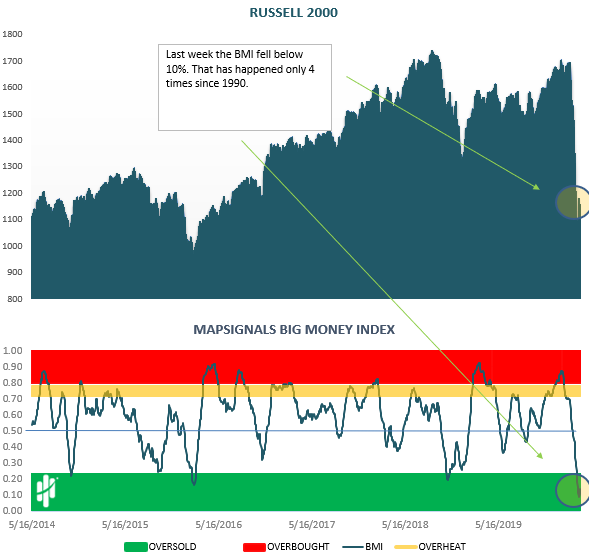
It’s so rare in fact, it’s only happened 4 times since 1990!

Each instance occurred in a bear market, like now.

Below are the 4 times, since 1990, when our Big Money Index fell below 10%.

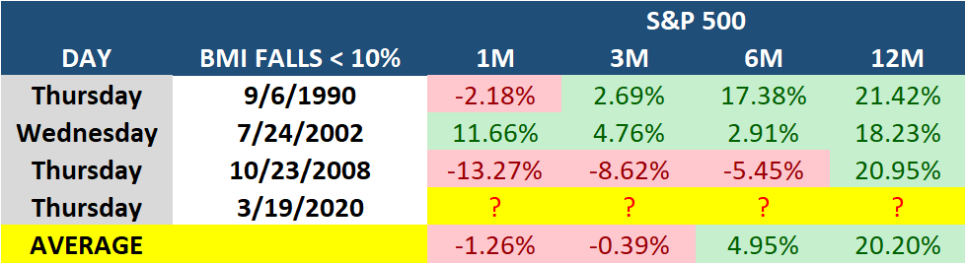
All prior periods were very dark times for the market.

Many of you remember the Global Financial Crisis – that’s the last time we saw this kind of selling.

But, take a look at the 12 month forward returns – that’s juice…ie, good bet.

The Phases Of Big Money

The Big Money flows in waves.

There are 4 phases we see consistently:

  1. Huge buying and very little selling – (think FOMO)
  2. Buying slows and selling picks up – (usually near a peak)
  3. Buying slows further and selling begins to take over – (a pullback has begun)
  4. Buying is gone, and sellers are in control – (think bear markets and scary headlines)

Have a look:

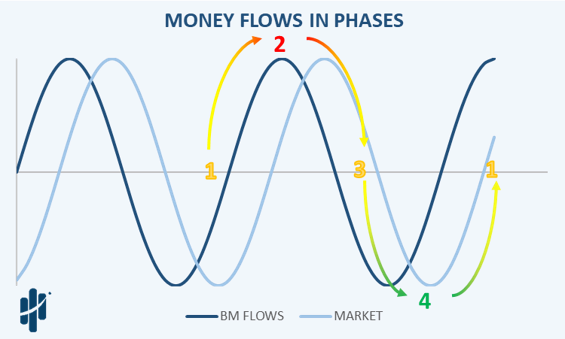
We are in phase 4. These are the times to shop for great companies on sale…ie, good bet.

Big Selling In Stocks Is Slowing

Every day we look under the hood of the market.

We measure big money moving in and out of thousands of stocks.

To get a pulse on the market, we group the buys and sells by sector.

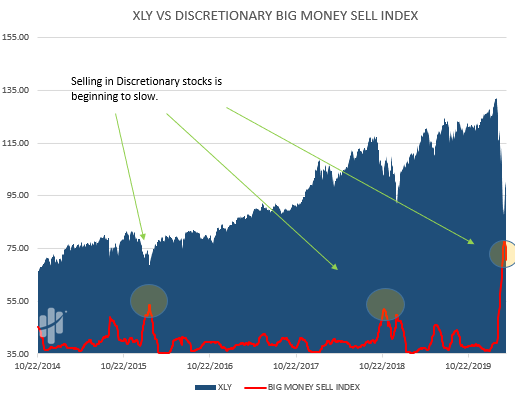
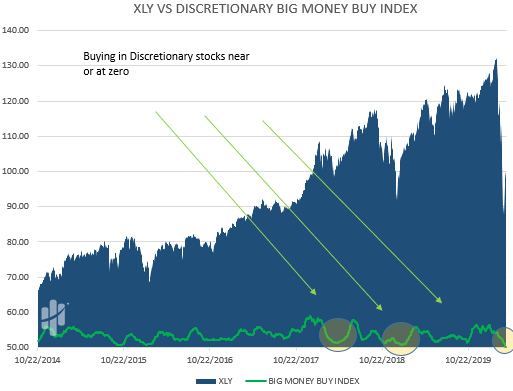
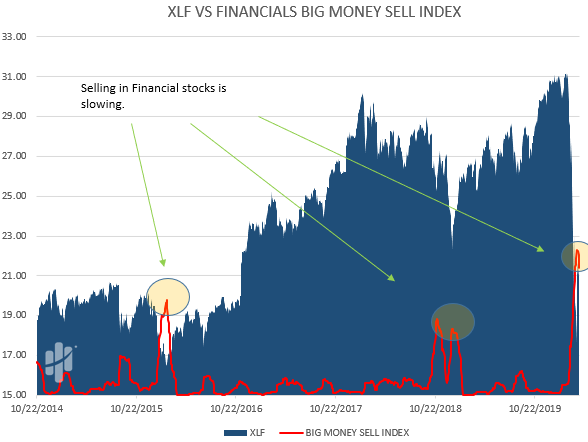
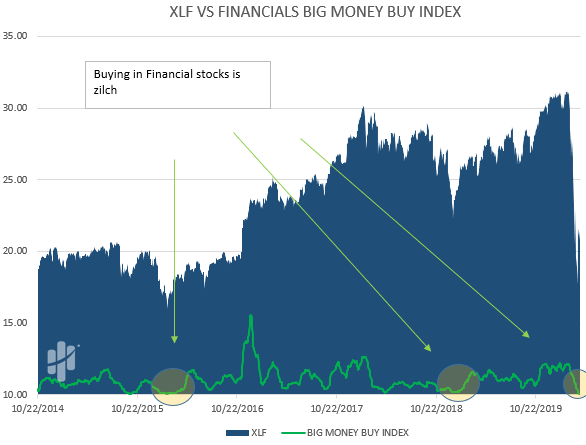
If the red line is increasing, selling is increasing. If the green line is increasing, buying is increasing.

Look at how selling is slowing and buying is near zero. Click the images to zoom in.

Here’s discretionary:

Now, financials:

Energy:

Technology:

Bottom line: it’s a scary world out there. Headlines are horrible.

However, if we take a step back and look at things through the lens of data, we see pocket aces.

It’s not about winning every hand, it’s about making good bets.

If you bet when the odds are in your favor, long-term you will win.

Lucas Downey
Lucas Downey

Lucas is co-founder of MAPsignals. His full bio can be found here.
Prior to MAP, he was Head of ETF Sales at Cantor Fitzgerald & SVP of Derivatives at Jefferies, LLC.

Spread the word!

Category: All, Big Money Insights Weekly, Special Reports

Previous Post: « Big Money Series – Index Additions
Next Post: Climate Change Market »

Reader Interactions

Comments

  1. Emil

    April 2, 2020 at 2:26 pm

    THis is all well and good, but we may climb higher, and then contract again becuase people are going to be risk-averse – let’s not belittle, could be scary still

    Reply
    • Mapsignals

      April 2, 2020 at 3:19 pm

      Hey Emil –

      You are absolutely correct. We could contract.

      Clearly, times are very rough for many people.

      We just look at the market from the lens of our data.

      There are prior periods of hardship that we can look back on for limited guidance.

      The glass is half full from our vantage point.

      Reply
  2. Petru

    April 2, 2020 at 3:23 pm

    Sure, if you look at stocks as being represented by the value they had in the past years compared to now then yes it’s a great time to buy.

    However, I can see a lot of optimism in the US markets when discussing the threat of the virus, the social and economical implications. Currently, here in Europe, the amount of death, fear and pain that’s ravaging countries is going to have a major impact on consumer behaviour over the long term, no amount of fiscal relief (or stimulus) will change that, companies are built by people and they’re going to underperform after this. Let’s not forget that the economy is now global.

    I’m definitely not grabbing any stock for the time being. I hope the virus will treat the US lighter than the EU.

    Reply
  3. Raj

    April 2, 2020 at 3:37 pm

    What about the bear market rally trap? Many are expecting a retest of the lows….

    With Q1 results/guidance coming out this month, that seems to be a real possibility. So, shouldn’t we be waiting to see if they will be further carnage through May? Or is the data suggesting to start getting back into the market regardless, albeit at a gradual pace…

    Reply
    • Mapsignals

      April 2, 2020 at 4:13 pm

      Many are calling for a bear trap and a retest of the lows.

      Our goal is to look out past the near-term and see if the setup is favorable.

      Based on the data we have, it is favorable.

      Even if we retest lows, our strategy would not change.

      This post is not an all-clear signal, but it is shedding light on a potential shift in the data…a positive shift.

      While we are in a bear market we will continue to pick our spots and buy quality names.

      If we are the only positive data-point out there in a sea of red, we’ll own it!

      Reply
  4. mik

    April 2, 2020 at 4:37 pm

    Based on your ave return over time data, it seems waiting till 3 months after is the preferred strategy as the ave returns are still neg at month 3?

    Reply
    • Mapsignals

      April 2, 2020 at 8:07 pm

      That’s right. We expect decent volatility over the next few weeks to months.

      There’s even the potential for a retest of the March lows.

      But, the good news is that there is light at the end of the tunnel.

      Reply

Leave a Reply Cancel reply

Your email address will not be published. Required fields are marked *

Primary Sidebar

Get Big Money Insights for FREE

Want to know where the Big Money is headed?

Just enter your email address below. You'll get our FREE NEWSLETTER sent directly to your inbox.

We call it Big Money Insights... It’s your weekly sneak peek at the powerful market-moving forces that are hidden from 99% of investors.

"*" indicates required fields

This field is for validation purposes and should be left unchanged.

Categories

  • All
  • Big Money Insights Weekly
  • Big Money Series
  • Macro Insights
  • MAP In The Media
  • Members Only
  • Performance
  • Podcast
  • Special Reports
  • Stocks
  • Videos & Interviews
  • White Papers

Archives

  • February 2023
  • January 2023
  • December 2022
  • November 2022
  • October 2022
  • September 2022
  • August 2022
  • July 2022
  • June 2022
  • May 2022
  • April 2022
  • March 2022
  • February 2022
  • January 2022
  • December 2021
  • November 2021
  • October 2021
  • September 2021
  • August 2021
  • July 2021
  • June 2021
  • May 2021
  • April 2021
  • March 2021
  • February 2021
  • January 2021
  • December 2020
  • November 2020
  • October 2020
  • September 2020
  • August 2020
  • July 2020
  • June 2020
  • May 2020
  • April 2020
  • March 2020
  • February 2020
  • January 2020
  • December 2019
  • November 2019
  • October 2019
  • September 2019
  • August 2019
  • July 2019
  • June 2019
  • May 2019
  • April 2019
  • March 2019
  • February 2019
  • January 2019
  • December 2018
  • November 2018
  • October 2018
  • September 2018
  • August 2018

Follow us on Twitter

MAPsignals Follow 1,434 1,061

MAPsignals is a data platform that tracks institutional money flows in stocks and ETFs. Sign up for free insights here: https://t.co/SaAVHjKC9J

mapsignals
mapsignals avatar; MAPsignals @mapsignals ·
48m 1621476848990359552

Pendulum has swung

Helene Meisler @hmeisler

Highest volume for the QQQs since 12/13

Reply on Twitter 1621476848990359552 Retweet on Twitter 1621476848990359552 0 Like on Twitter 1621476848990359552 0 Twitter 1621476848990359552
Load More...

Footer

© 2021 Mapsignals.com

  • Home
  • Contact & Disclaimer
  • Privacy Policy
  • Terms & Conditions
  • Opt-out preferences
  • FAQ

Copyright © 2023 · Mai Law Pro on Genesis Framework · WordPress · Log in

✕
What Happened to Risk Assets White Paper is Here

Get your copy here and take a journey through our thoughts on margin and leverage.

Enter your email address below and you'll get our FREE NEWSLETTER sent directly to your inbox. 

 We call it Big Money Insights... It’s your weekly sneak peek at the powerful market-moving forces that are hidden from 99% of investors.

MAPsignals
Manage Cookie Consent
We use cookies to optimize our website and our service.
Functional Always active
The technical storage or access is strictly necessary for the legitimate purpose of enabling the use of a specific service explicitly requested by the subscriber or user, or for the sole purpose of carrying out the transmission of a communication over an electronic communications network.
Preferences
The technical storage or access is necessary for the legitimate purpose of storing preferences that are not requested by the subscriber or user.
Statistics
The technical storage or access that is used exclusively for statistical purposes. The technical storage or access that is used exclusively for anonymous statistical purposes. Without a subpoena, voluntary compliance on the part of your Internet Service Provider, or additional records from a third party, information stored or retrieved for this purpose alone cannot usually be used to identify you.
Marketing
The technical storage or access is required to create user profiles to send advertising, or to track the user on a website or across several websites for similar marketing purposes.
Manage options Manage services Manage vendors Read more about these purposes
View preferences
{title} {title} {title}