
How to Buy Low at All-Time Highs
Indices keep climbing. After posting a 26% total return last year, the S&P 500 is up another 20% YTD.
As this bull market has blossomed, leadership has really broadened out.
Here’s how to buy low at all-time highs.
This rally’s proven it’s not a one trick pony.
After underperforming in the first half, the S&P 500 Equal Weight Index rose 9.1% in Q3, easily besting the tech-heavy S&P 500’s 5.5% advance.
Whenever one sector cools off, another steps up to power the market’s next leg higher. This bullish rotational action keeps happening again and again.
We know it’s tempting to think that there’s nothing left to buy. All the good news must already be priced in by now, right?
Judging from Wall Street’s latest worry list, you’d certainly think so. It’s even longer than usual.
Popular scare stories include the recent flare-up in the Middle East, to the pace of Fed rate cuts, recession fears, high valuations, election uncertainty, and October’s weak seasonal track record.
The notion that “all the good news is already priced into stocks” sounds catchy but doesn’t really hold up.
Today we’ll show you five underappreciated, bullish macro tailwinds that signal new all-time highs loom.
Then we’ll show you three lagging sectors that offer the best bang for your buck as this broadening bull market just keeps on charging.
Five Catalysts for Further Highs in Stocks
Let’s start with the recent spike in geopolitical risk in the Middle East. Most people think geopolitical flare ups are an obvious reason to sell stocks. This is understandable but ill-advised.
History shows major geopolitical scares typically don’t hold stocks back for more than a few weeks.
Iran bombed Israel on April 15. On April 29, we published Don’t Overreact to Geopolitical Headlines. After a brief sell-off, the S&P 500 was 3.6% higher a month later and 9.9% higher 3 months later.
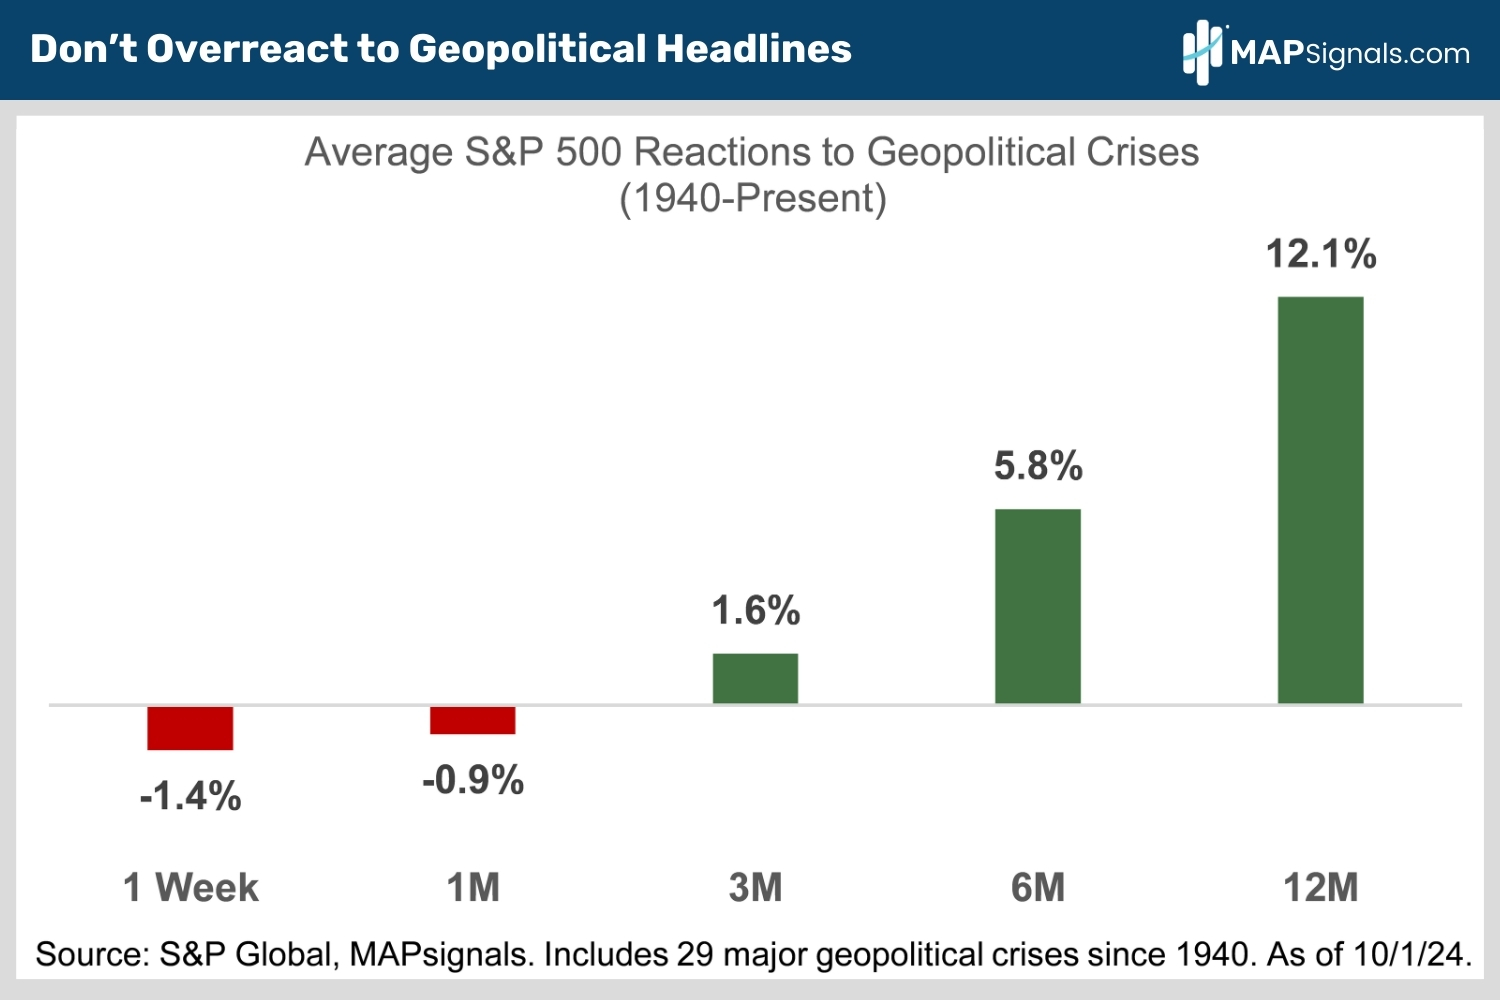
We’ve analyzed 29 geopolitical events since 1940, ranging from wars to terrorist attacks to pandemics.
While the S&P 500 has averaged short-term losses of 1.4% and 0.9%, respectively, a week and a month after major geopolitical events, it hasn’t paid to cash out.
On average, the S&P 500 was up 1.6% three months after geopolitical events. Even better, the index chalks up 5.8% and 12.1% gains after six and 12 months, respectively, both of which are way above average.
Our #1 reason stocks can keep rallying is that geopolitical risk is highly unlikely to hold stocks back for long.
OK let’s shift gears and uncover other underappreciated macro equity tailwinds.
We know stocks follow earnings. Both keep hitting new all-time highs.
Lower short-term rates (controlled by the Fed) aren’t the only reason corporate profits are ramping.
A trifecta of under-acknowledged macro themes is also boosting earnings. These include dollar weakness and sharp falls in both energy prices and long-term interest rates (chart).
Note the 1Y returns for each of these benchmarks:
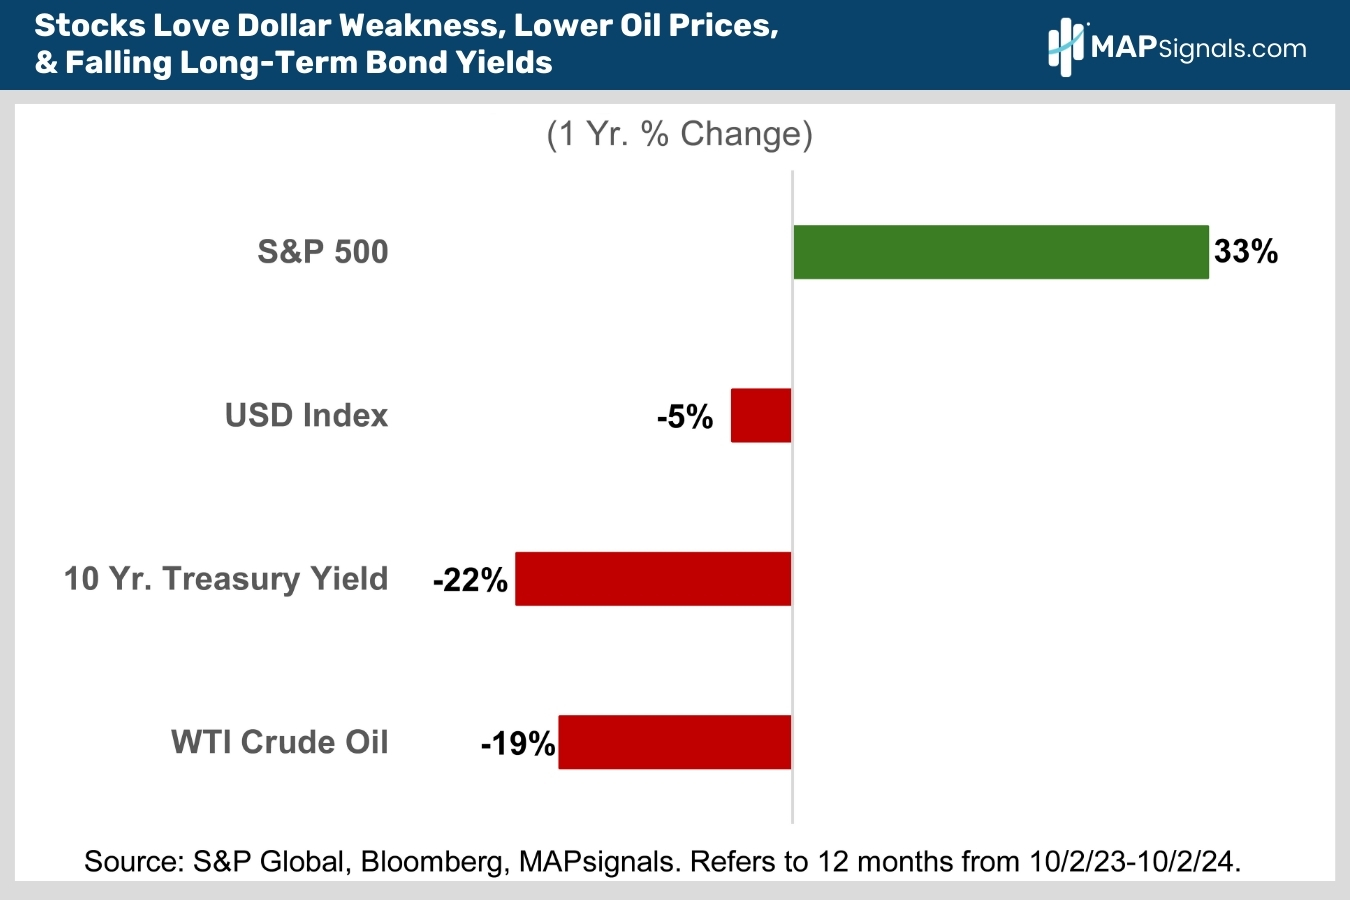
Let’s unpack why these three macro dynamics are positive for stocks.
We’ll start with the big drawdowns in long-term interest rates and oil prices – these are the 2nd and 3rd catalysts this bull market has further to run.
Many investors dismiss the bullish stimulative benefits of lower oil prices and long-term rates arguing their declines are harbingers of economic weakness.
While it’s true rates and oil usually decline in recessions, that’s not why they’re falling now.
Low oil prices are a function of excess supply, from the US, the world’s biggest oil producer, and OPEC+. Global demand has been very steady. Even geopolitical risk hasn’t been enough to keep crude from falling.
As for the collapse in long-term bond yields, that’s been a function of falling inflation, not weak economic growth. The latest Atlanta Fed GDP Now Q3 real GDP forecast stands at a healthy 3.1%. It’s been in the 2-3% range for months.
The reality is sharp drops in oil and long-term rates are a net positive for the economy, earnings and stocks.
And history says their stimulative benefits aren’t yet fully priced into stocks.
Check out this next chart.
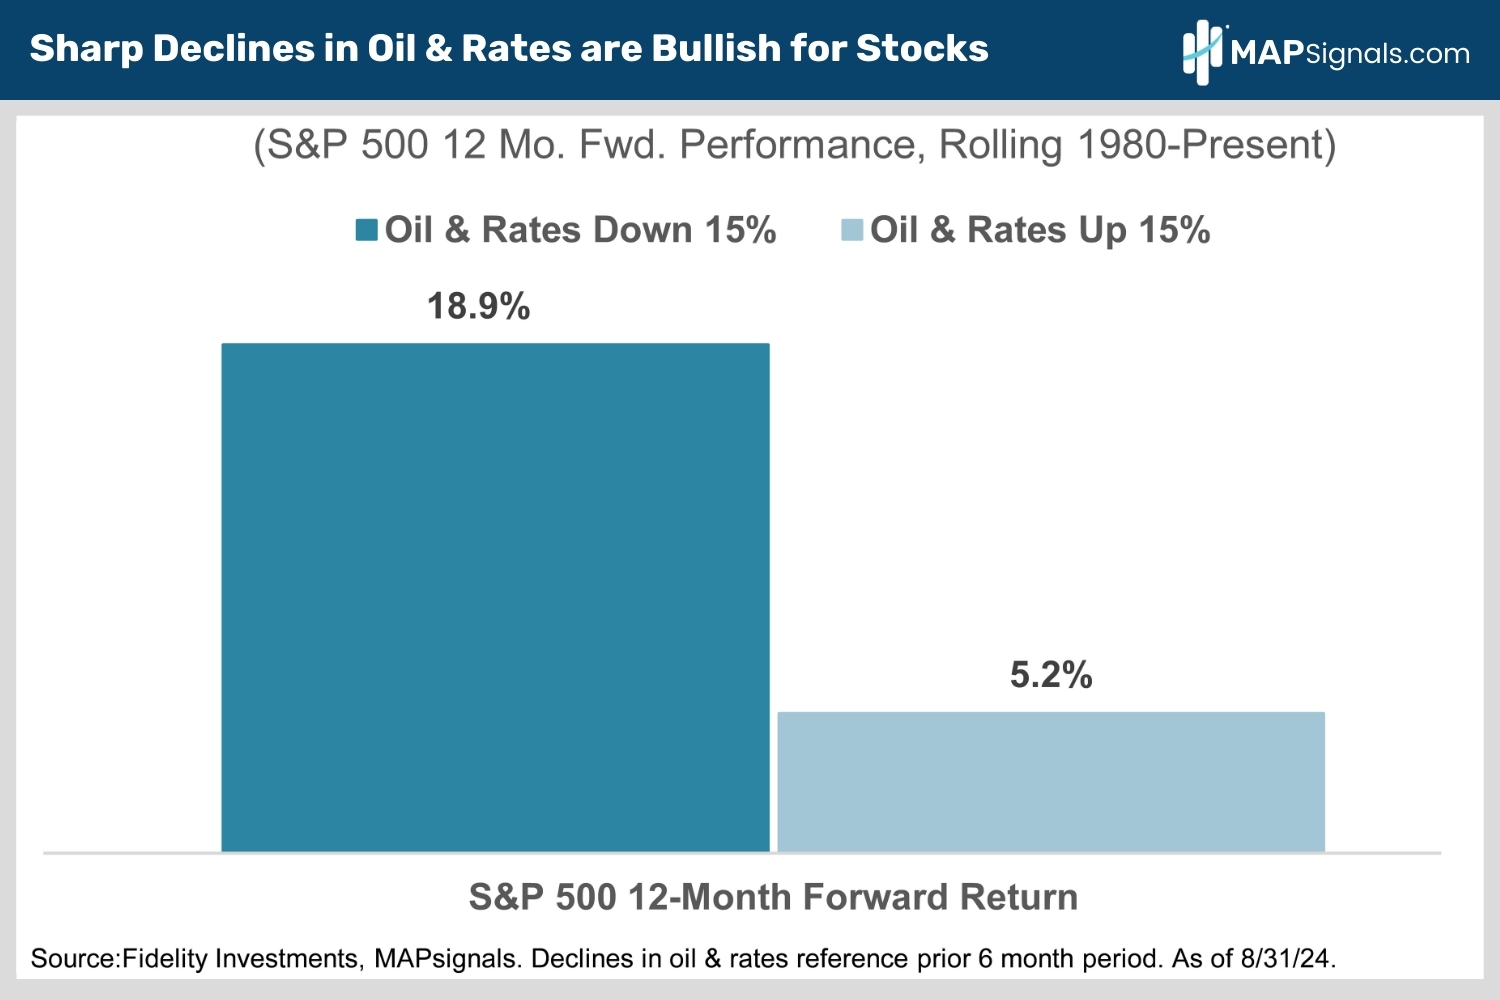
Since 1980, the S&P 500 has averaged an 18.9% gain in the 12 months following 15%+ declines in oil prices and 10-year Treasury yields (chart).
This is in stark contrast to the 5.2% subdued returns for large caps when oil and rates have both gained 15%+:
Can this bullish situation get better? YES.
The 4th underappreciated macro catalyst this bull market isn’t over is persistent dollar weakness.
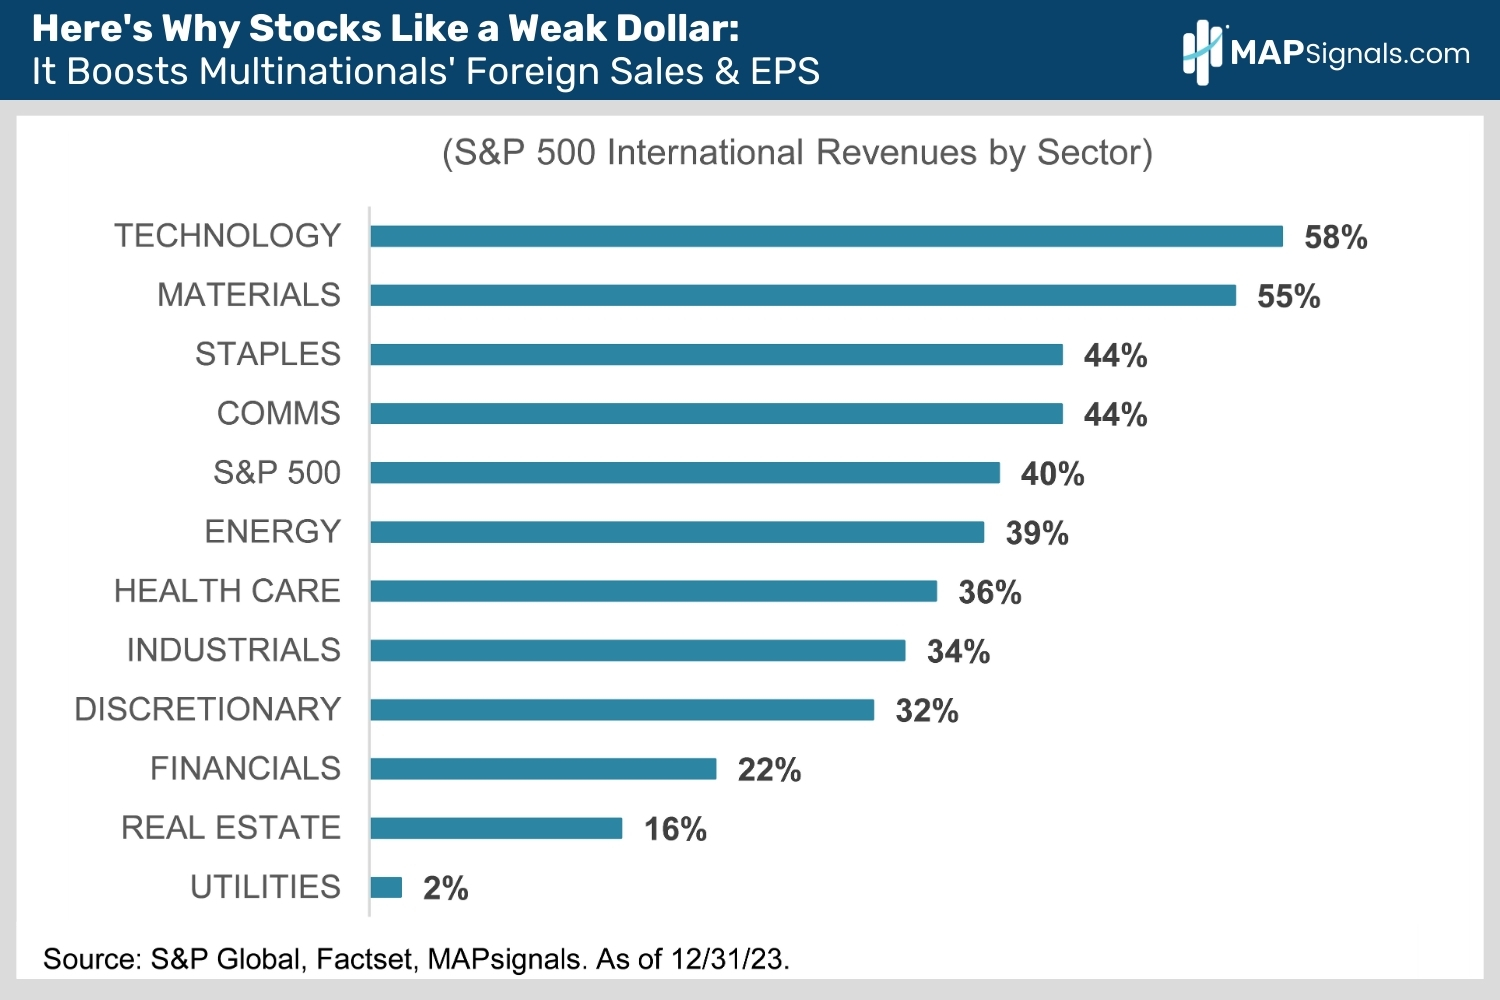
S&P 500 companies generate roughly 40% of their sales overseas, led by the tech and materials sectors with a whopping 58% and 56% respective international sales tallies (chart).
When the dollar falls, overseas sales and EPS are worth more when translated back into US dollars.
It’s no surprise the S&P 500 bull market started exactly when the greenback’s last bull market ended in October 2022. The Dollar Index is down 11% since with half that decline coming in the past 12 months.
Expect the dollar to remain soft as the Fed continues cutting rates, making greenbacks less attractive to global investors.
While other big central banks like the ECB, BOE and Bank of China are easing too, they started sooner and so have fewer rate cuts left to do.
Here’s the percentage of international revenues by S&P 500 sector:
Reason #5 this bull market isn’t over is investor positioning. At MAPsignals we’ve learned that positioning is key to stock performance. The big money watches it like a hawk.
It’s a contrarian indicator. When everyone’s bullish on something it’s time to lighten up because there’s no one left to buy. On the flip side, when everyone’s scared to death, it’s time to back up the truck.
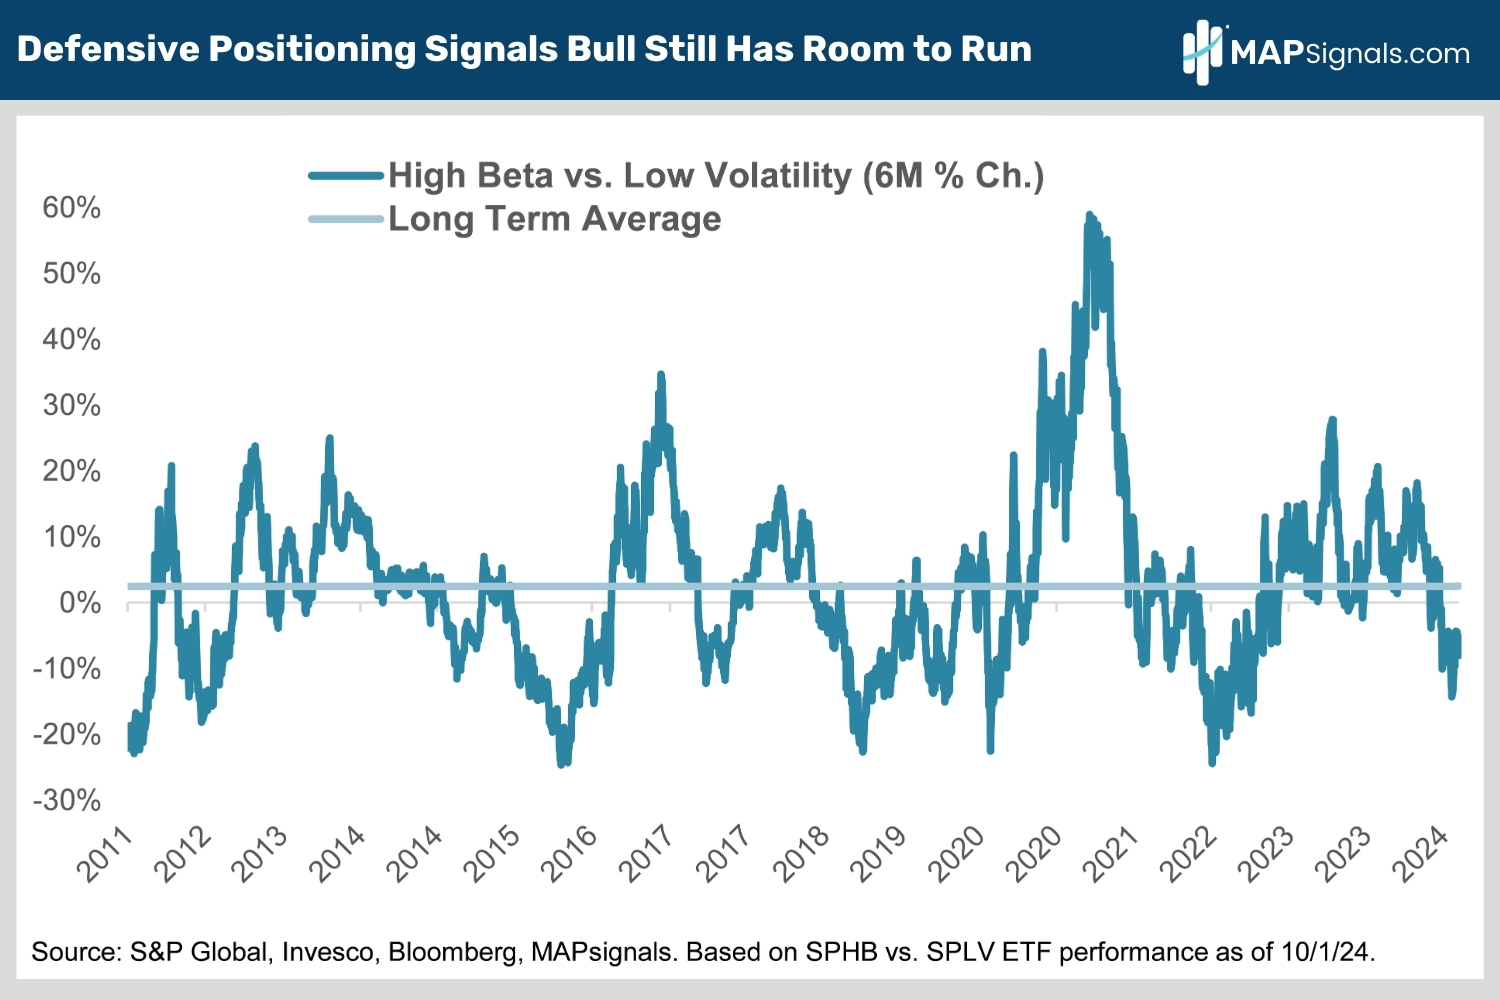
Right now, the market’s huge run up and Wall Street’s long worry list, has investors hedging their bets. They’re crowding into low volatility stocks which are overrepresented in counter-cyclical sectors like utilities, staples, telecom and defensive corners of real estate.
Check out this chart.
High beta stocks normally outperform low volatility stocks by 2.5% in any given 6-month period because they tend to have faster long-term growth prospects vs low volatility names.
But right now, the opposite is happening. Low volatility stocks have outperformed high beta stocks by 8% over the past 6 months.
That’s a whopping 10.5% better than average (chart) and shows the crowd is cautious.
This defensive investor positioning is a bullish signal for the overall stock market.
When bull markets end, investors are tripping over each other and reaching for risk. The opposite is true today.
The crowd is nervous and positioned for bad news. They’ll be most surprised by better than feared news-flow and will be forced to chase stocks higher as that happens.
Defensive positioning signals the pain trade for stocks is higher.
Below shows how we are in the lower threshold tilted in favor of low vol equities. It’s paid to add risk when folks are crowding into safety areas:
Now, where can investors find appealing valuations?
Stay with me.
How to Buy Low at All-Time Highs
We’ve made the bullish macro case for stocks. Now let’s tackle portfolio construction.
The constant rotations markets have experienced this year is proof that hunting for underappreciated values is being rewarded.
With that in mind, we screened the market to see where investors can get the most bang for their buck.
The PE to growth (PE/G) ratio measures value for money. The PE/G ratio = 12MF PE / Forward EPS growth.
The holy grail is finding a sector with accelerating EPS growth and a forward P/E below its 12MF EPS growth rate. That produces a PEG ratio under 1.
It’s hard not to consistently outperform over the next 12 months when you buy sectors with PEGs <1.
Here’s why: Investors think the forward EPS forecasts are too high so they refuse to pay up, keeping valuations low.
But as the macro and sector news-flow continue to clear a low bar, coming in better than feared, the sector takes off as the crowd starts to believe the forward EPS are more realistic.
This dynamic generates significant alpha as the sector is re-rated higher.
The challenge in practice is that low PE/G ratios aren’t easy to find two years into a bull market.
The S&P 500 is up roughly 64% since its October 2022 intra-day bear market low of 3491.
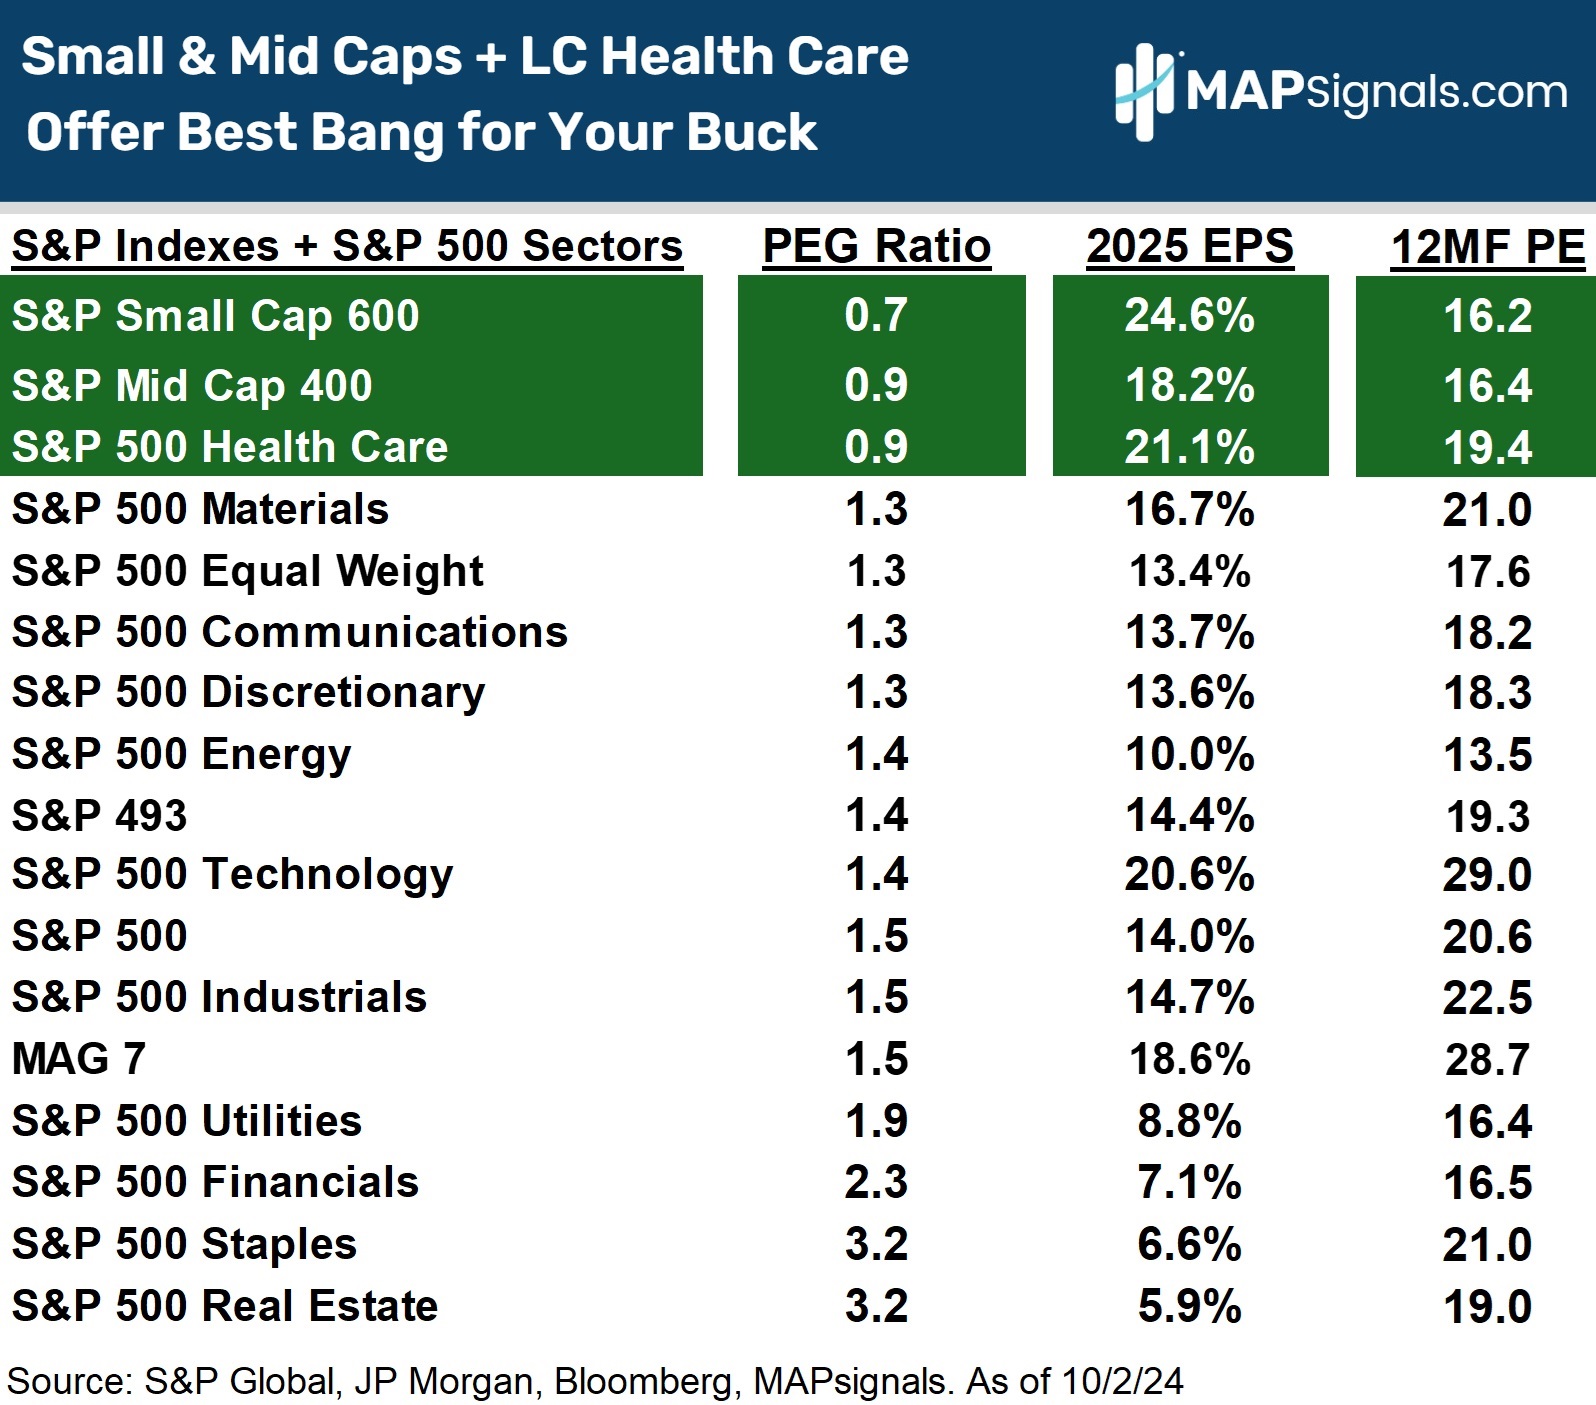
Our analysis revealed only 3 sectors trading at a forward PE to growth ratio of less than 1.
Check out the table below.
The S&P Small Cap 600, the S&P Mid Cap 400 and the S&P 500 Health Care sector made the cut.
Sentiment surveys show most investors are still heavily underweight on all three.
Remember, you want to be where the puck is going, not where it is now.
As we constantly prove over and over again, there’s always opportunity under the surface. Plenty of small, mid, and healthcare names litter our Top 20 list.
When value areas are under institutional sponsorship, that’s a winning ticket.
Bringing It All Together
Stocks have had an amazing run. Resist the natural urge to sell. Equities will be even higher by year-end.
The notion that “all the good news is already priced into stocks” sounds catchy but doesn’t really hold up.
Fed easing isn’t the only reason to like stocks. A bullish trifecta of less discussed, macro tailwinds including weakness in the dollar, oil and long-term rates will also keep boosting the economy, earnings and equities.
Defensive investor positioning is yet another underappreciated bullish signal for the stock market. When bull markets end, investors are all bulled up and reaching for risk. The opposite is true today.
Lastly, history shows major geopolitical scares typically don’t hold stocks back for more than a few weeks.
The S&P Small Cap 600, the S&P Mid Cap 400 and the S&P 500 Health Care sector offer the best bang for your buck 2 years into this bull market with PEG ratios under 1.
If you want to find specific small cap, mid cap and all cap health care stocks ramping with Big Money support, get started with a MAPsignals PRO subscription. It’ll get you access to our portal that updates every morning, showcasing the exact tickers getting bought and their scores.
MAP your own stocks and ETFs. AND you’ll get our prized Top 20 list in your inbox every Tuesday!
There are plenty of winning stocks to pick up on sale before the next leg higher. If you’re a Registered Investment Advisor (RIA) or are a serious investor, use a MAP to find them!
Invest well,
-Alec
***ALSO, in an effort to liven up this content, we’ve created an AI-driven podcast based on this insights piece. You can find the episode here on Spotify or find it on all major podcast platforms including Apple & Google.