
How To Buy The Dip
If you want to make gains fast, learn how to buy the dip.
And the way we do it is by looking at unique data.
That’s right. Many investors pray for pullbacks. But therein lies the challenge. First, how do you know which dip to buy? Second, which stocks do you buy?
That’s what we’ll cover today. We’ll look at which data we use for clues that a likely bounce is around the corner. Then we’ll go over the stocks to pay attention to when the dip signal hits.
And before we get into all that, let’s first acknowledge a historical fact: September is usually a red month for stocks. Don’t believe me? Check this out.
Below are the average returns for September – December for major averages going back to 1990:
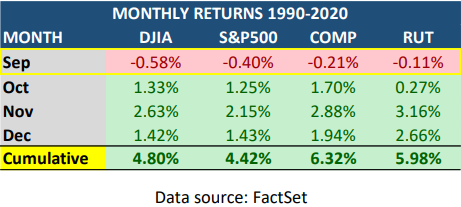
And while that can spell trouble for the uninformed, having a plan ahead of time will help when red comes. Because when you look past September, you realize something. Juice tends to flow into stocks.
I’ve removed September…now look:
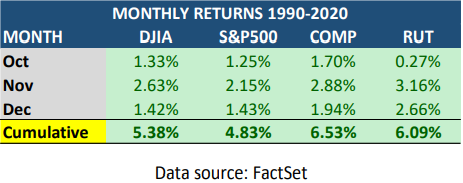
Holy moly that’s some green!
So, now that we have the setup, let’s go over how to buy the dip.
Big Money Index How To Buy The Dip
Here’s where our data shines. I’m going to walk you through 3 automated charts available to subscribers. They can be found here.
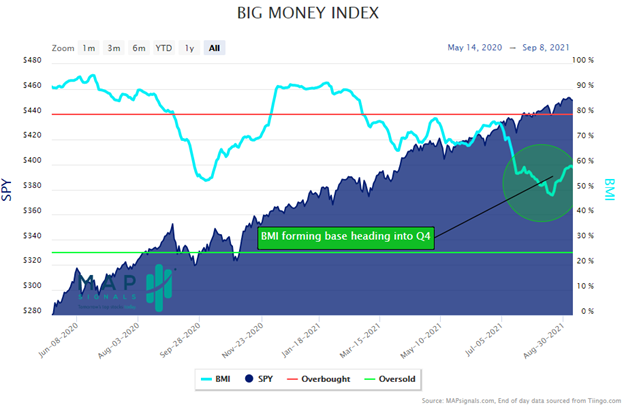
Our Big Money Index tells us the overall flow of Big Money in stocks. When it ramps, stocks tend to fly. When it lags, markets usually fall.
Right now, it’s forming a nice base with upward momentum:
While the S&P 500 and NASDAQ are at highs, small-caps have been slowly improving. Many groups that were crushed are now perking higher: Chinese ADRs, Discretionary, etc.
On the margin that’s medium-term bullish. When selling slows, stocks can rally. Many high-quality earnings-rich stocks are cruising higher. Looking below you can see how buying has ramped recently:
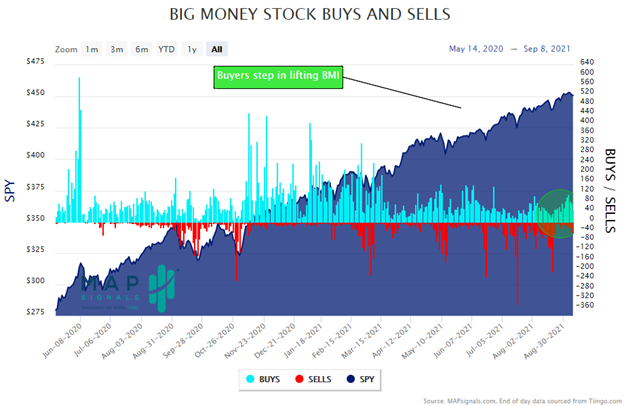
That’s exactly why the BMI keeps lifting. But let’s keep in mind it’s September. That means we should expect red in the coming weeks.
Want to know how to buy the dip? Watch this. Below I’ve outlined all big sell days over the past year…notice anything?
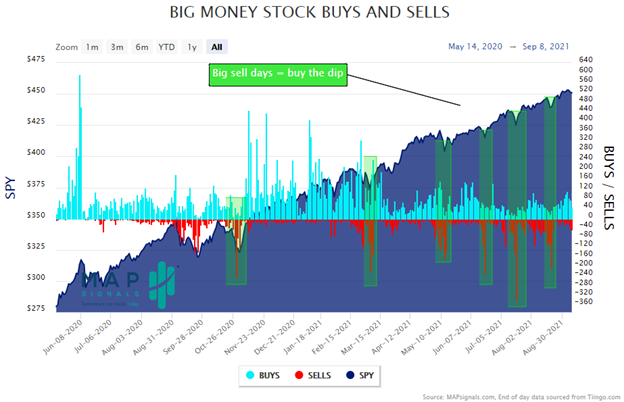
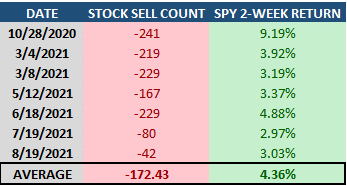
Like clockwork, those big red sticks mark the low for the market. Here’s the 2-week forward return for SPY after each of those red days:
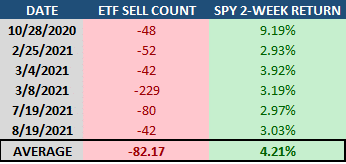
That’s how to buy the dip! Mega-juice comes after pain. But let’s keep going. We see the same thing with ETFs. Look how ETF dumps means market jumps:
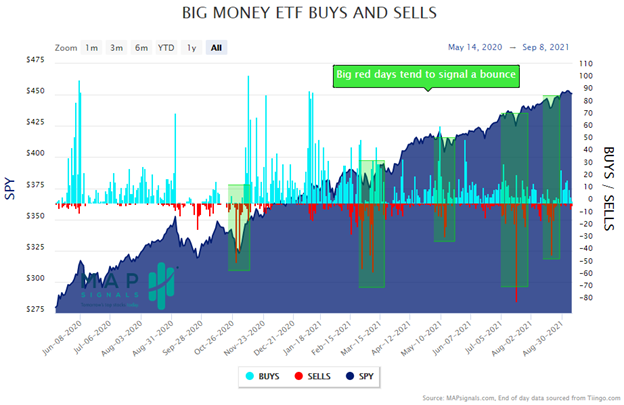
Want to know how to buy the dip? This is a great place to start. Check out the forward 2-week performance after each of these ugly days:
That’s a signal if we’ve ever saw one. If September brings market pain, we’ll be using the Big Money for our gain…and you can too!
Now, that we know how to buy the dip, let’s now shift our focus to stocks.
How to Buy the Dip
Data helps us find dips to buy. It also helps us find amazing stocks.
Inside all of these charts are individual stocks getting bought and sold. We score them and rank them from best to worst.
The best stocks have growing sales and earnings and a lot of Big Money buying. Each week we showcase the 20 best stocks getting the Big Money love. This report is available to Platinum members here.
When markets hit rough waters, this is a great report to look for value. But going deeper, we take 6-months of all top stocks and make a monthly MAP 50 report.
This is a popular report because it compiles the 50 stocks seeing the most Big Money over 6 months. It’s a great list of stocks to investigate when markets are hitting the skids.
Here’s a snapshot of last month’s August report. You can see that July’s 50 stocks had a strong performance:
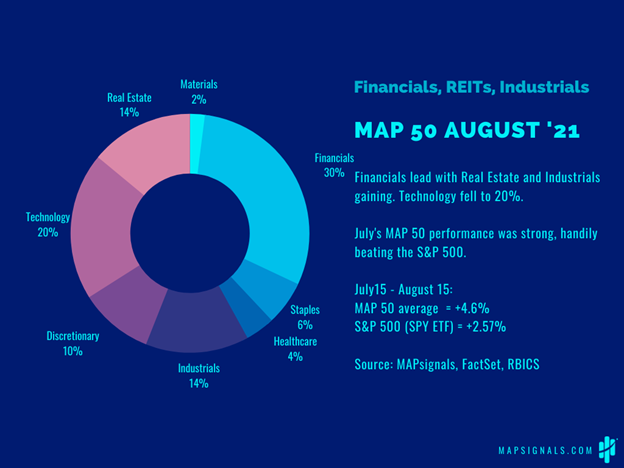
Keep in mind, these reports are released around the 15th of every month. July’s report came near one of those big stock and ETF sell days…and look how the average gain for each of the stocks easily beat the market.
July’s 50 stocks averaged a gain of +4.6% vs. +2.57% for the SPY.
September’s MAP 50 will be released next week. If you’re a dip buyer, consider it for your process.
Let’s wrap this up.
Here’s the bottom line: September can be a downer for stocks. But, our data has powerful information. Big sell days usually bring monster rallies. Will that happen in the future? We’ll see.
The key is to be prepared. Make a plan.
When our data flashes red, bounces tend to come soon after. But you gotta bet on the right stocks. And that folks, is how to buy the dip.
***As a bonus, check out our latest video: Best Growth Stocks for October 2021. Luke finds the juice. You can see our soon-coming app for subscribers too.
Make sure to like and subscribe to our YouTube channel!