• Menu
  • Skip to right header navigation
  • Skip to main content
  • Skip to primary sidebar
  • Skip to footer

MAPsignals

We map big money.

  • Latest Insights
  • Power of MAP
    • MAP Products
    • MAP System
    • MAP White Papers
    • Videos & Interviews
  • Profit with MAP
  • About
    • About MAP
    • MAP Team
    • Authors
    • MAP System
    • MAP Products
    • Big Money Index
  • Members
    • Get Started With MAP
    • My MAP
    • Big Money Charts
    • MAP View
    • MAP View Options
    • MAP Top 20 Weekly
    • MAP 50
    • Member Updates
    • Platinum Updates
    • Members Only Posts
    • Performance
  • Portal

How To Find Outlier Stocks

October 14, 2021 //  by Lucas Downey//  2 Comments

Stocks go up. Stocks go down.

But outlier stocks go way up. Here’s how to find outlier stocks.

HOW TO FIND OUTLIER STOCKS

Have you ever noticed that a handful of stocks seemingly head higher year after year? You know, the Apples (AAPL) and Amazons (AMZN) of the world.

That’s what we witnessed years ago sitting on Wall Street trading desks. Like clockwork, a small percentage of stocks kept running year after year. And these weren’t junky stocks built on hype. No, these were incredible businesses with amazing products and services.

We recall watching companies routinely blow out numbers, only to juice higher. We wanted to own those kinds of stocks.

Then something happened to help us on that journey. We began to pay attention to how the Big Money players invested. We saw with our own eyes, how they’d constantly invest in the same kinds of companies…the great ones.

When you see it firsthand, it changes your perspective. It changed us. Handling big stock orders gave insights into how the big boys and girls traded. Fast forward a few years and MAPsignals was created.

The foundation of what we do is grounded in that unique experience. Our data seeks out unusual trading in stocks.

But we don’t stop there. Years of analyzing the best stocks taught us to focus on companies growing their revenues and earnings. Why? Because that’s how to find outlier stocks.

When we marry Big Money trading together with great fundamentals, magic happens. Our data laser-focuses in on a few companies.

This is important because right now markets are jostling day by day. On the surface it looks like stocks aren’t going anywhere. But our data tells a different story.

It shows mega buying in high-quality small-caps. That’s been our message for weeks, and why we said to buy growth stocks now.

Many of these stocks are likely going to be the next crop of outliers. More on that in a bit. Let’s now check in on some market data.

Big Money Index is Ready To Soar

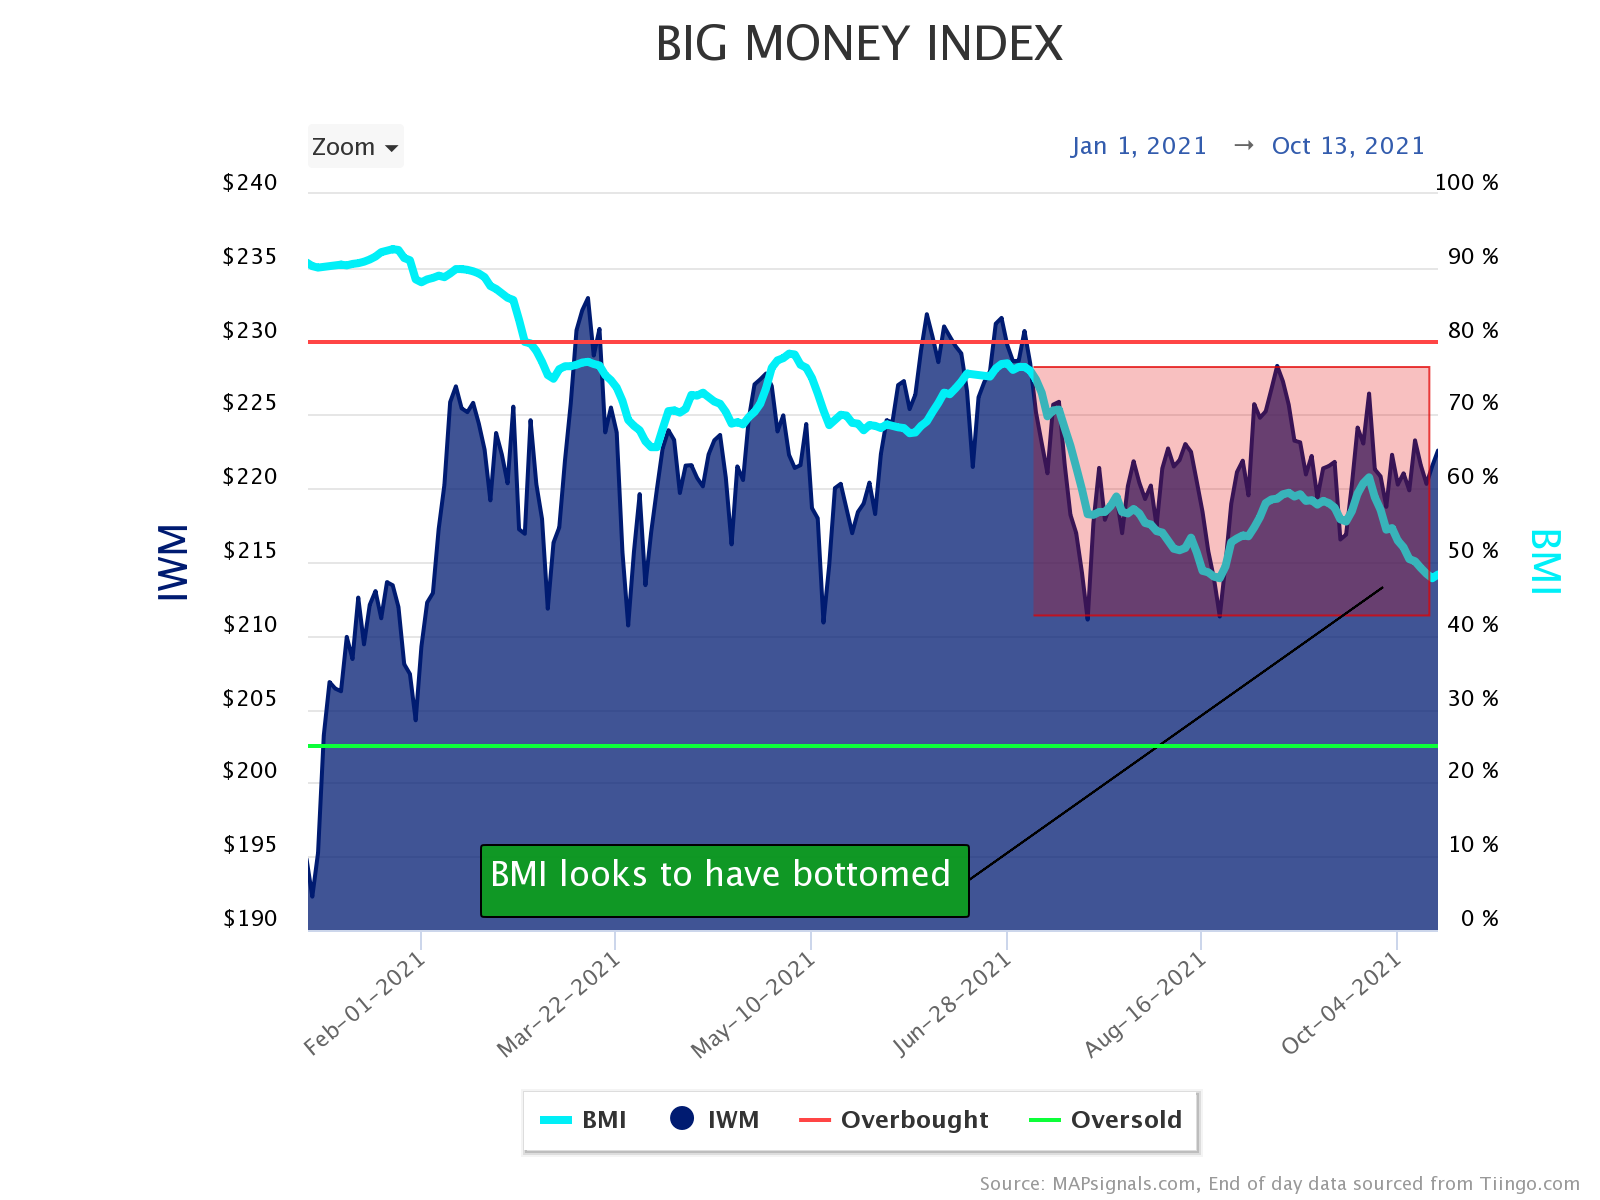
It’s been chop city for stocks. One look at the Big Money Index will tell you that.

Below I’ve outlined the trendless nature of the BMI the last few months. In fact, it reached its August low yesterday.

That’s the negative news. The more important message is that this morning showed a very bullish signal: High-quality small-cap stocks are getting bought. That’s incredibly bullish for markets:

big-money-index

And going a step deeper, we can see the daily action supports this narrative. Selling in stocks is slowing. Buying in stocks is growing. Remember, these are the signals that make up the BMI.

Look how the red bars (sellers) have been getting shorter. That tells us that supply is being met with demand. And when that happens…JUICE flows into stocks!

big money buy and sell signals

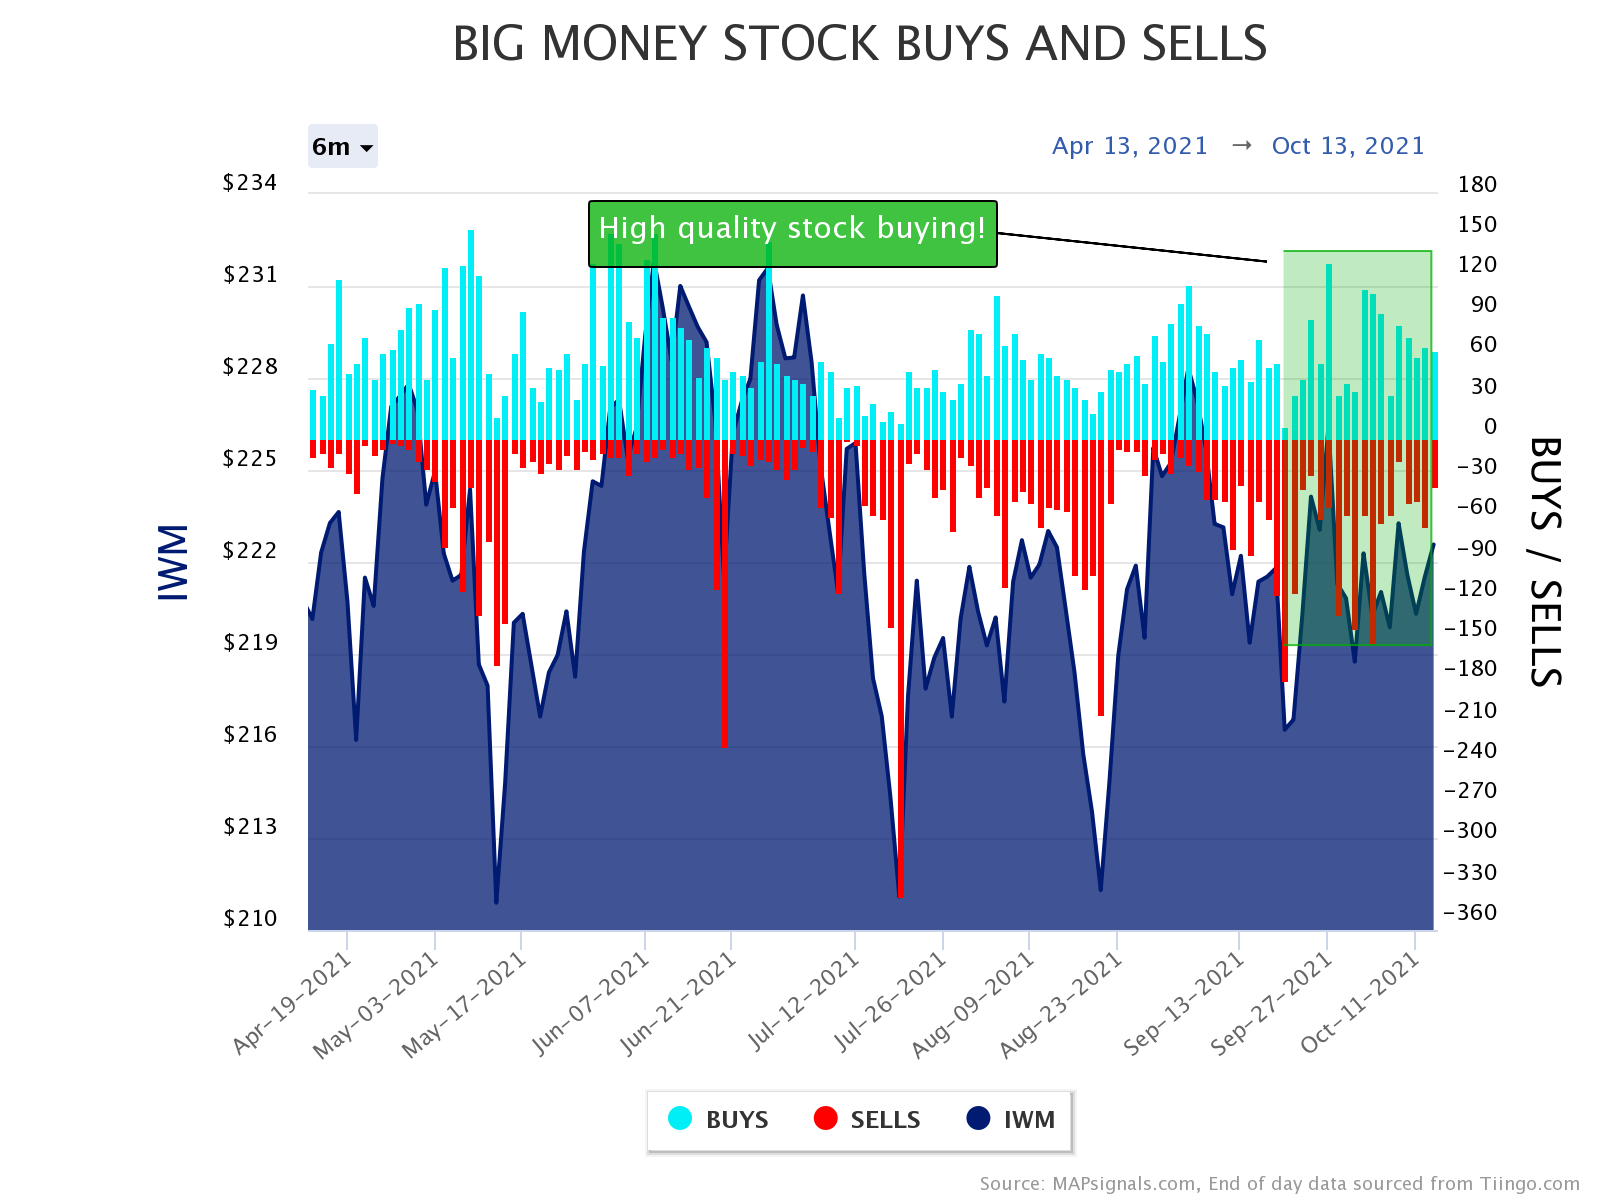
But the quality of stocks getting bought is what’s important. We believe many of the stocks getting scooped up right now are future outliers.

So now let’s shift our focus there. Nothing gets us more excited than sharing how to find outlier stocks.

How To Find Outlier Stocks

Outlier stocks are the ones that make massive gains. Usually, they are the companies with awesome products, leadership, and growth.

That’s where we spend our entire focus. So, each week we profile the Top 20 stocks getting bought by the Big Money. All-star stocks are found on this list.

And what we’ve found is the best stocks keep getting bought week after week, month after month, and year after year. To highlight these Big Money favorites, we created our popular MAP 50 report, which comes out monthly on the 15th.

This report showcases the 50 stocks getting the most Big Money love over the past 6 months. Why do we do that? Because outlier stocks tend to keep getting bought…

Let me show you what I mean. Below is the performance of our May MAP 50 report held through yesterday:

MAP 50 May 2021

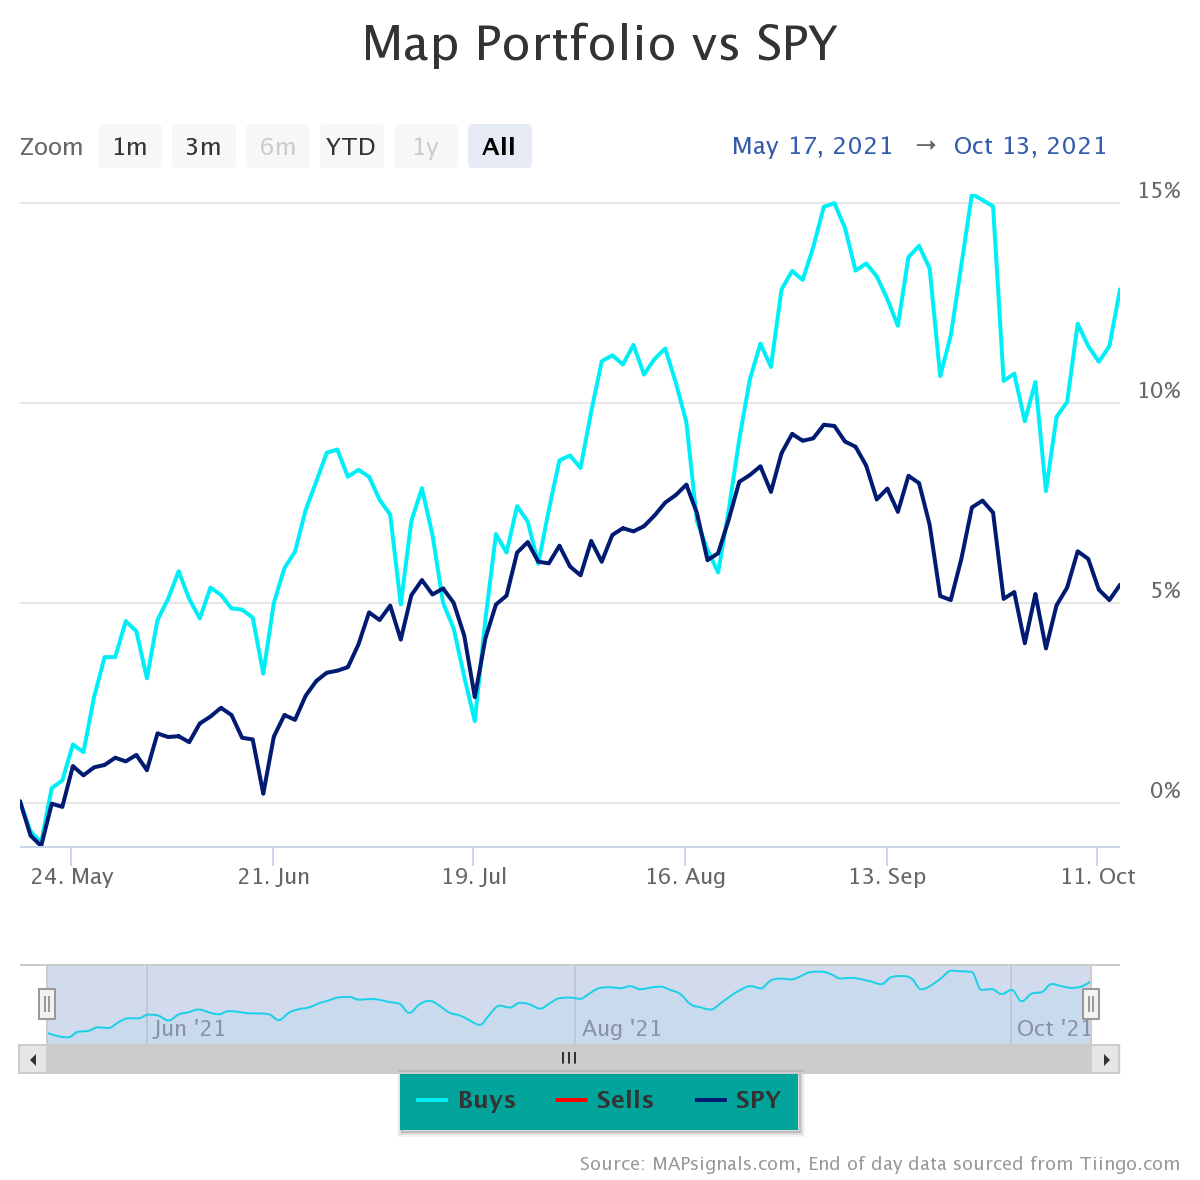
Those 50 stocks more than doubled the S&P 500 (SPY ETF), with the MAP portfolio gaining 12.82% vs a strong SPY return of +5.42%.

That’s awesome performance, but there’s more!

Below is the performance of the top 10 stocks from the same report (removing the bottom 40):

map 50 MAY 2021 top 10

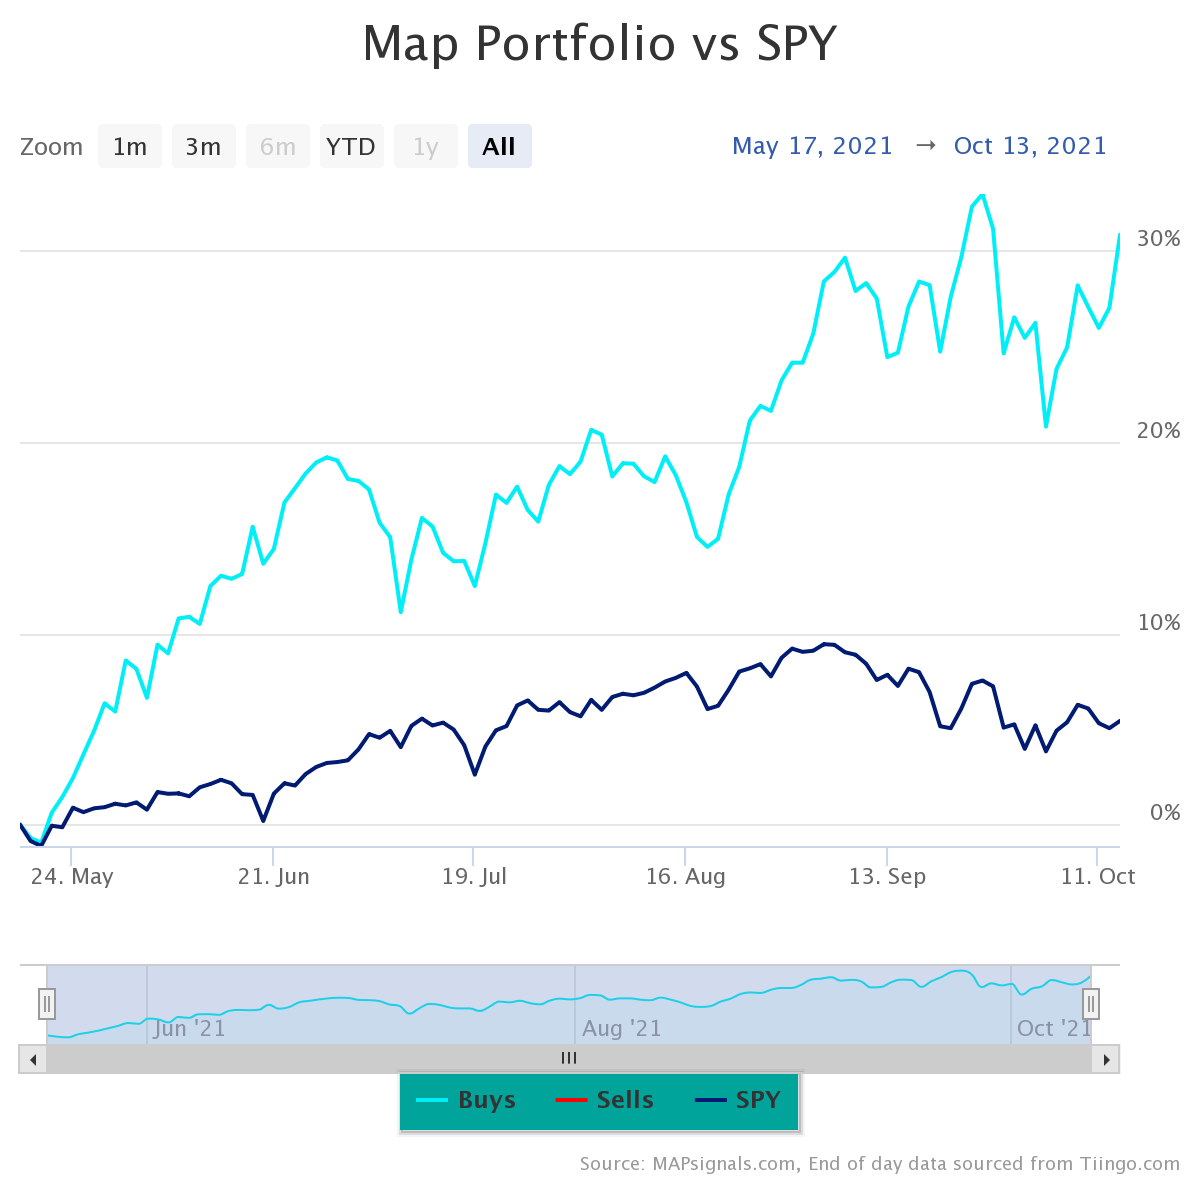
Now, that’s major outperformance. Those 10 stocks gained an average of +30.84% vs. SPY’s +5.42%. That’s the power of outlier stocks.

And the Big Money process doesn’t just focus on what’s getting bought. Remember, we track selling too. Looking at the same time frame as above, I’ve included the performance of the 10 stocks getting sold the most.

Have a look:

MAP top 10 bottom 10

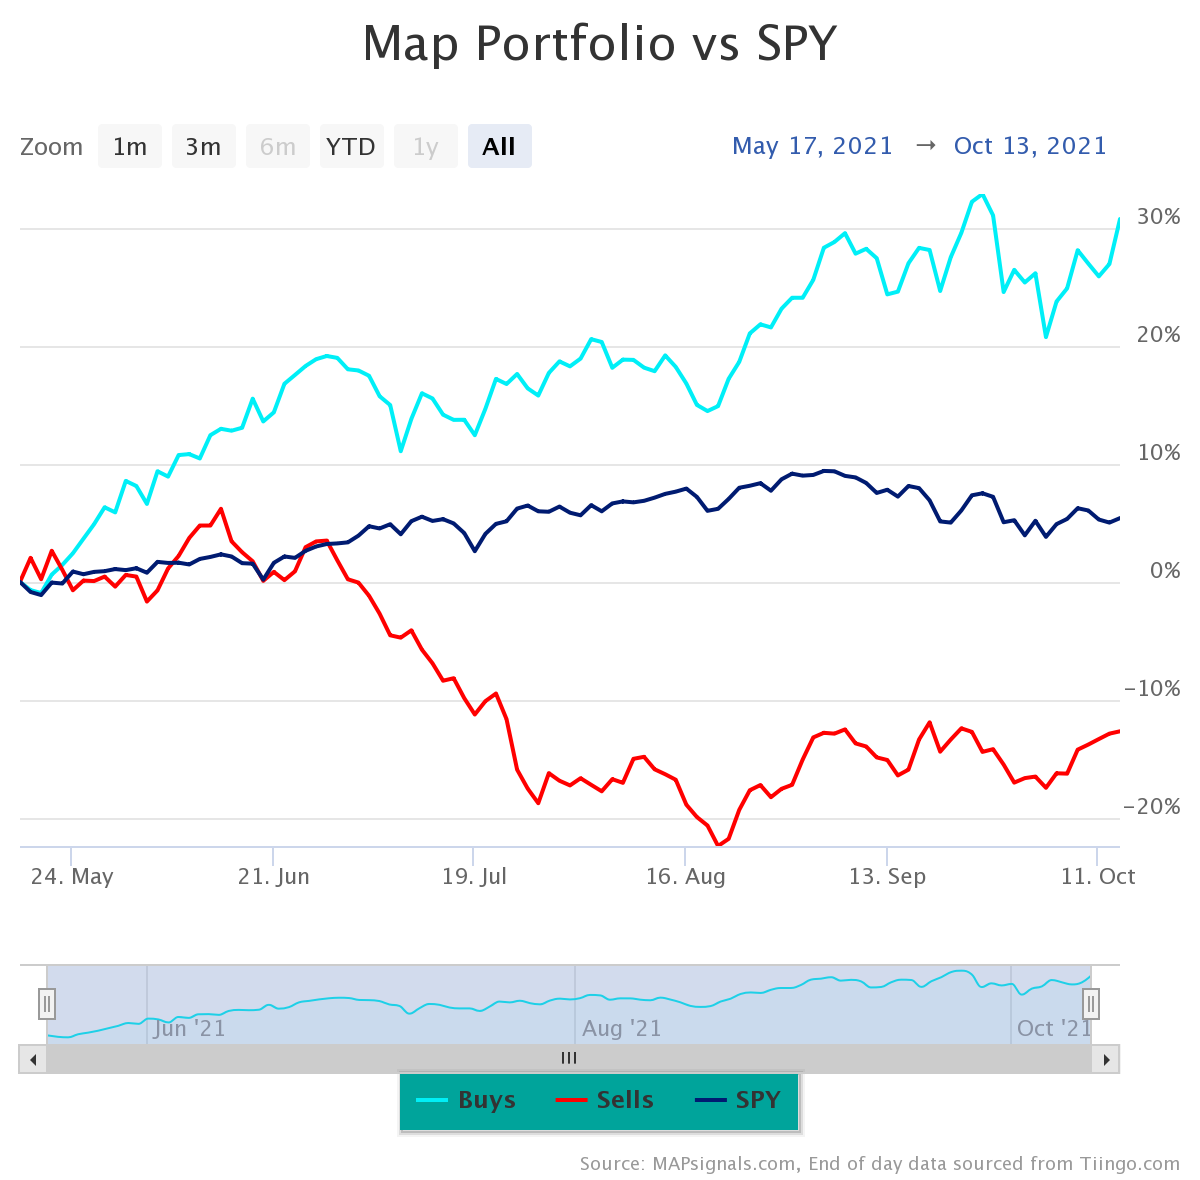
The red line is showing the performance of our worst ranked stocks. They fell an average of 12.70%.

That folks, is the power of Big Money.

Following the Big Money reveals trends. So, if you ask us how to find outlier stocks…we’ll simply say, “Follow the Big Money, baby!”

And based on the recent buying happening, signs are pointing to more upside. If you’re looking to get access to tomorrow’s MAP 50 report, get started here.

Here’s the bottom line: It only takes a few outlier stocks to transform a portfolio. The latest Big Money data is signaling that high-quality stocks are getting bought. We believe the next crop of outliers is in our data right now.

Follow the juice!

***And as a bonus, check out our latest video: How Big Investors Trade Stocks. In it, Luke and Jason chat about their Wall Street experiences that led them to create MAPsignals.

Make sure to like and subscribe to our YouTube channel!

Lucas Downey
Lucas Downey

Lucas is co-founder of MAPsignals. His full bio can be found here.
Prior to MAP, he was Head of ETF Sales at Cantor Fitzgerald & SVP of Derivatives at Jefferies, LLC.

Spread the word!

Category: All, Big Money Insights Weekly

Previous Post: «HOW BIG INVESTORS TRADE STOCKS How Big Investors Trade Stocks
Next Post: How Big Money Investors Trade ETF Blocks How Big Investors Trade ETF Blocks»

Reader Interactions

Comments

  1. James

    October 15, 2021 at 12:33 pm

    Can I create my own portfolio based on the MAP Signal report using your portfolio portal? What is the typical annualized return on a long-short portfolio?

    Reply
    • MAPsignals Staff

      October 15, 2021 at 6:09 pm

      Hey James – that functionality is going to come eventually.

      Right now, the portfolio builder is solely focused on our strongest Top 20 signals. We will need to do a study on the typical annualized returns. But, we do know that bottom 10 stocks tend to underperform for 3 months on average. And the Top 20s tend to do best for 9m+ on a risk adjusted basis.

      Reply

Leave a Reply Cancel reply

Your email address will not be published. Required fields are marked *

Primary Sidebar

Get Big Money Insights for FREE

Want to know where the Big Money is headed?

Just enter your email address below. You'll get our FREE NEWSLETTER sent directly to your inbox.

We call it Big Money Insights... It’s your weekly sneak peek at the powerful market-moving forces that are hidden from 99% of investors.

"*" indicates required fields

This field is for validation purposes and should be left unchanged.

Categories

  • All
  • Big Money Insights Weekly
  • Big Money Series
  • Macro Insights
  • MAP In The Media
  • Members Only
  • Performance
  • Podcast
  • Special Reports
  • Stocks
  • Videos & Interviews
  • White Papers

Archives

  • February 2023
  • January 2023
  • December 2022
  • November 2022
  • October 2022
  • September 2022
  • August 2022
  • July 2022
  • June 2022
  • May 2022
  • April 2022
  • March 2022
  • February 2022
  • January 2022
  • December 2021
  • November 2021
  • October 2021
  • September 2021
  • August 2021
  • July 2021
  • June 2021
  • May 2021
  • April 2021
  • March 2021
  • February 2021
  • January 2021
  • December 2020
  • November 2020
  • October 2020
  • September 2020
  • August 2020
  • July 2020
  • June 2020
  • May 2020
  • April 2020
  • March 2020
  • February 2020
  • January 2020
  • December 2019
  • November 2019
  • October 2019
  • September 2019
  • August 2019
  • July 2019
  • June 2019
  • May 2019
  • April 2019
  • March 2019
  • February 2019
  • January 2019
  • December 2018
  • November 2018
  • October 2018
  • September 2018
  • August 2018

Follow us on Twitter

MAPsignals Follow 1,449 1,070

MAPsignals is a data platform that tracks institutional money flows in stocks and ETFs. Sign up for free insights here: https://t.co/SaAVHjKC9J

mapsignals
mapsignals avatar; MAPsignals @mapsignals ·
9h 1622987016957820928

One of my favorite #dividend #stocks having a day - Skyworks Solutions $SWKS - owned it for years

The $2B buyback is pretty significant given the market cap is sub $19B

#Semiconductors continue to see major inflows

Reply on Twitter 1622987016957820928 Retweet on Twitter 1622987016957820928 0 Like on Twitter 1622987016957820928 2 Twitter 1622987016957820928
Load More...

Footer

© 2021 Mapsignals.com

  • Home
  • Contact & Disclaimer
  • Privacy Policy
  • Terms & Conditions
  • Opt-out preferences
  • FAQ

Copyright © 2023 · Mai Law Pro on Genesis Framework · WordPress · Log in

✕
What Happened to Risk Assets White Paper is Here

Get your copy here and take a journey through our thoughts on margin and leverage.

Enter your email address below and you'll get our FREE NEWSLETTER sent directly to your inbox. 

 We call it Big Money Insights... It’s your weekly sneak peek at the powerful market-moving forces that are hidden from 99% of investors.