
How To Find The Best Stocks
If you want to know how to find the best stocks, have a process.
A repeatable method will increase your odds of investing success.
When we started out investing, we made countless mistakes. We tried our hand at day-trading and failed. Then we gave emotion a try…that didn’t work either.
We had to start somewhere.
Eventually, we sat back and thought. We began to study the best stocks of all-time…you know, the juicers!.. the Apples and Amazons of the world. What characteristics did they have?
And that’s when our journey of how to find the best stocks began. We noticed that the greatest stocks out there had 3 measurable traits: great fundamentals, great technicals, and a constant in-flow of Big Money.
Great fundamentals included growing revenues and earnings. Top technicals consisted of upward momentum and new highs.
Sitting on Wall Street trading desks taught us the final indicator of how to find the best stocks: Follow the Big Money.
For years, we handled large institutional stock orders. Day after day, we watched the influence that the Big Money wielded on stocks. It was fascinating.
When Big Money is flowing into stocks, they go up. When Big Money’s exiting stocks, odds are they’re going down. Don’t fight that trend!
Fast forward to today and that’s all we do. We keep it simple.
In a bit, I’ll show you our favorite place to find the best stocks getting scooped up with Big Money. But first, let’s dive into the data.
Big Money Index Rangebound For Months
At MAPsignals, we like to start from the top and work our way down. We like to know the overall Big Money picture of the market.
Our favorite indicator is the Big Money Index. It tracks the flow of chunky buys and sells going in and out of stocks. When the BMI rips, stocks ramp. When it dips, stocks slip.
Since February, it’s been in a downtrend as small-cap stocks have gone nowhere:
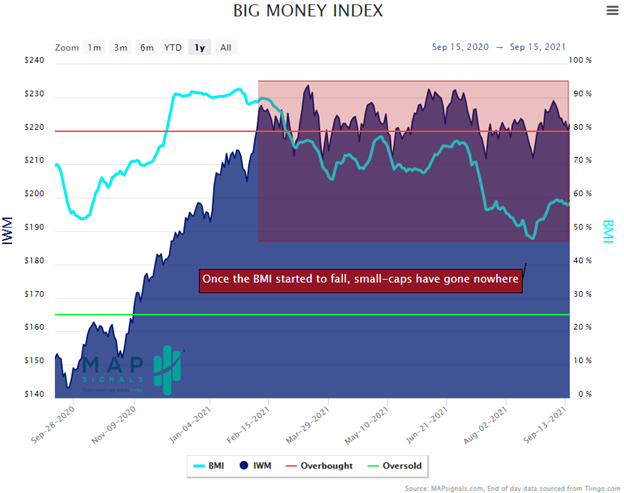
As big-cap tech stocks have led the market higher, many smaller companies have been lagging. And as we work our way down, you can see the dichotomy going on with stocks.
As a reminder, the Big Money Index looks at all stocks getting bought and sold. If the BMI is at a standstill (like now), there must be areas getting bought and sold under the surface.
There is. Below is our Big Money Stock Buys and Sells chart. Look how there’s a mix of buying and selling going on in stocks:
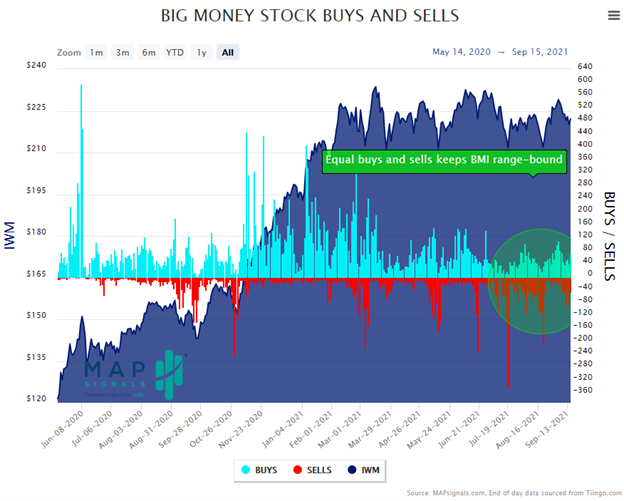
Clearly there are good stocks getting bought. And we can see the same patterns in ETFs.
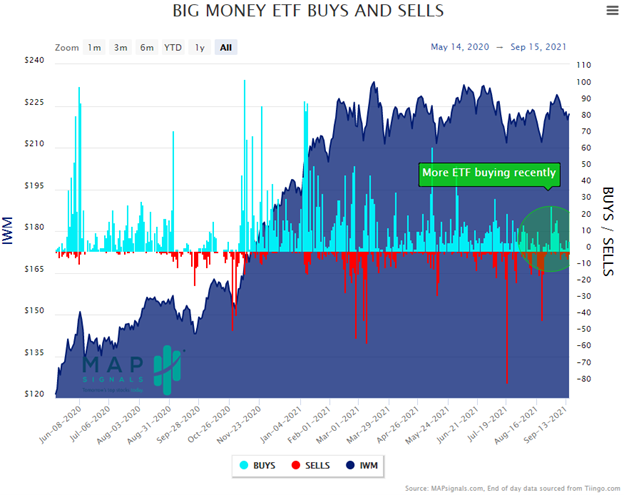
Below is our Big Money ETF Buys and Sells chart. Look how there’s buying and selling going on under the surface. Recently though, there’s been more buyers:
Yeah, data is cool. Watching these charts daily clues us in on where the Big Money’s flowing. And if we know where the Big Money’s flowing, we know how to find the best stocks.
And here’s where it gets fun.
How To Find The Best Stocks
Each week we take all of the stock buys and sells and rank them based on fundamentals and technicals. We do that because that’s where the JUICE is found.
Then we clip off the Top 20 stocks…we’re only interested in the outliers…the best of the best. And we’ve found that the best stocks out there keep reappearing on this list…over and over like clockwork.
And that makes sense. Great companies will likely attract the biggest and most successful investors.
And to put this method to practice, we created our popular MAP 50 report. This is a monthly list of 50 stocks that have seen the most appearances on the Top 20 list the prior 6 months.
In other words, this report weeds out the pretenders and isolates the contenders.
Well, this morning I looked at how that list of stocks performed each month compared to the market (S&P 500 SPY ETF). If you’re allergic to juice, look away now!
It’s important to note that we started generating this report in April 2020. That’s literally right during the pandemic lockdown. The below performance was calculated like this. Start on the release date (15th of each month) and hold until the next month’s report is released.
Look how these Big Money stocks trounced the market:
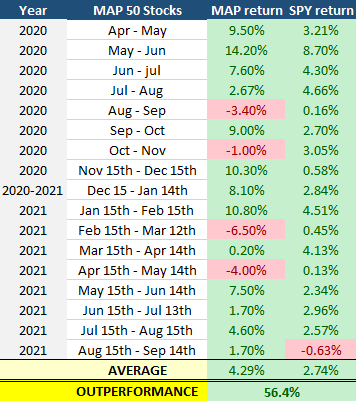
***performance calculated via FactSet
Outperforming the market by over 50% is something we’re proud of. That’s our mission as a business.
And as you can see, there were some nasty months in there, too. But eventually the MAP 50 got back on track.
Now, we can’t guarantee we’ll crush the market in the future…but history says loud and clear: Don’t fight the Big Money, baby!
So, when people ask us how to find the best stocks, it comes down to this. Find your process and stick to it. We like using data…that’s our edge.
Want to give our research a chance? Get started here.
Let’s wrap this up.
Here’s the bottom line: The best stocks out there have amazing fundamentals, solid technicals, and juicy Big Money buying. At MAPsignals we start from the top and work our way down.
History shows that only a handful of stocks break all the records. We spend all our time and energy finding them.
***And if you’re wanting more. Check out Jason and Luke as they share a few investing tips they’ve learned over the years.
Enjoy!
Make sure to like and subscribe to our YouTube channel!