
How to Tariff Proof Your Portfolio in 2025
The tariff tape bombs just keep on coming. It’s enough to make your head spin.
Extreme policy uncertainty is slowing the economy.
Today, we’ll show you what tariffs mean for growth, inflation, the Fed, earnings and the stock market.
Importantly, you’ll learn how to tariff proof your portfolio in 2025.
There is a group of slowdown sectors and stocks beaming with inflows and winning track records during economic declines.
The tariff tantrum isn’t all doom and gloom.
We’ll help you spot the winners.
How to Tariff Proof Your Portfolio in 2025
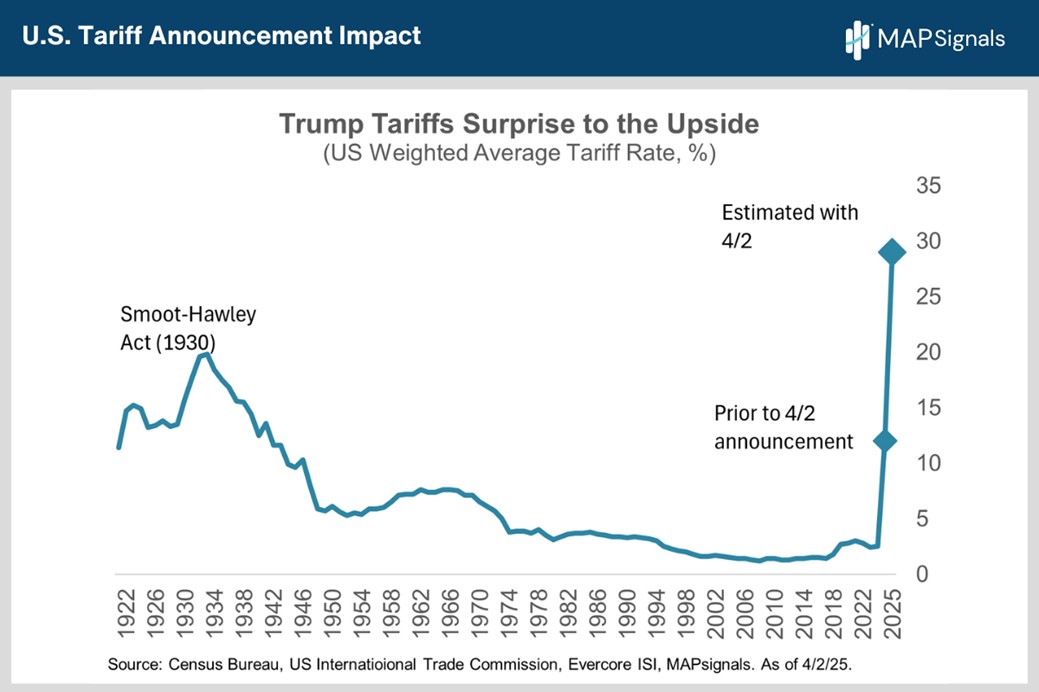
Tariffs have declined since the 1930s as increasing globalization relaxed trade policies.
That’s all changing. Trump has upended the $24 trillion market for global merchandise trade.
He’s slapped hefty tariffs on free-trade deal partners like Canada and Mexico, our European allies, as well as economic rivals like China, while warning of more measures to come.
On April 2, Washington imposed so-called reciprocal tariffs on nations that export far more to the US than they import from it.
China now faces a whopping 54% “all in” tariff on its exports to the US. Here’s a rundown of the customized reciprocal tariffs now facing other major US trading partners: the EU, 20%, Japan, 24%, the UK, 10%, Brazil, 10%, India 26%, Vietnam, 48%, South Korea 25%, Switzerland 31% and 32% for Indonesia.
China and Europe have retaliated with tariffs of their own, raising the risk of further escalation.
Not all measures have actually been implemented, though, and some governments are negotiating with US officials to avoid a debilitating tariff war and preserve ties with the world’s biggest economy.
Calculations from Evercore ISI suggest that, if fully implemented, the average tariff rate on U.S. imports could rise to 29%, up from only 12% before the April 2 announcement, and a scant 2.4% in 2023 (chart).
The good news is many of these tariffs may never be implemented or stay in place for very long, limiting their negative impact.
But clearly, growth will be weaker and inflation will rise, depressing earnings and equity valuations.
What we can’t know is by how much and whether or not the current equity drawdown already prices sufficient pain.
Time will tell as the tariff tit-for-tat unfolds.
Corporate Earnings Resilient So Far
Many worry that spiking economic uncertainty will weigh on corporate earnings guidance during the first quarter earnings season.
After all, it’s only prudent for managements to be conservative given the murky outlook.
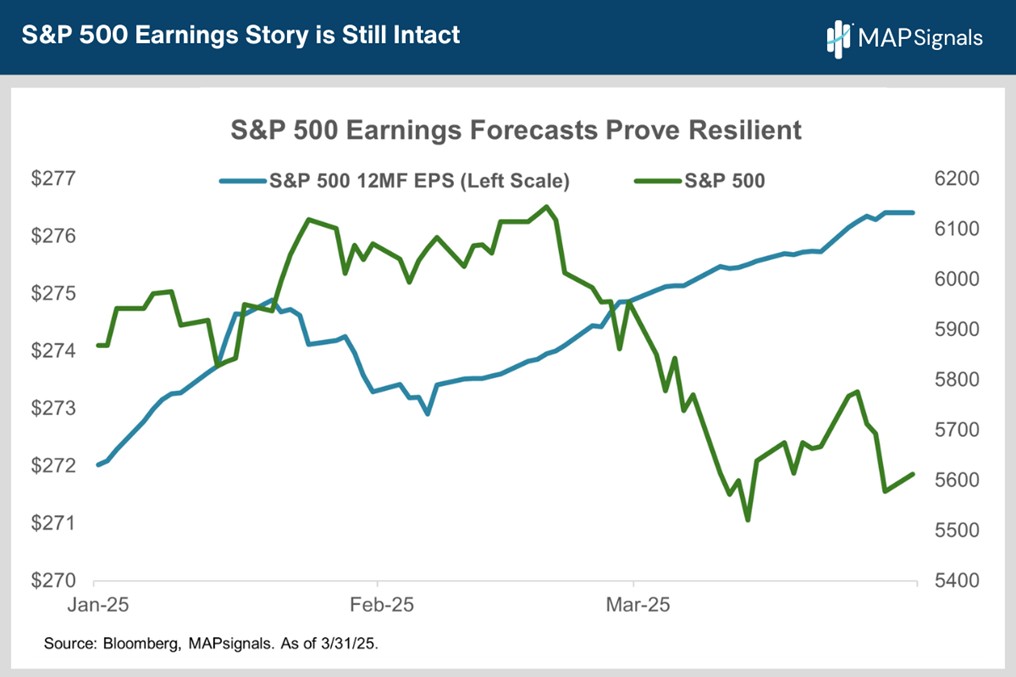
While we’ve seen analysts trim their Q1 EPS forecasts, the good news is 12-month forward consensus earnings forecasts have proven very resilient, recently hitting an all-time high of $276.40 (chart).
Hope remains that many of the threatened tariffs will either fail to materialize thanks to last-minute trade deals, or won’t remain in place for very long, limiting their negative economic and earnings impact.
That said, until visibility improves on how badly tariffs will ding the economy and corporate earnings, it’s hard to make a strong fundamental case for new highs in the stock market.
When visibility drops, volatile trading typically takes over until the clouds part.
Now should we expect similar equity rallies this year compared to 2023 & 2024?
Let’s check in on history for context.
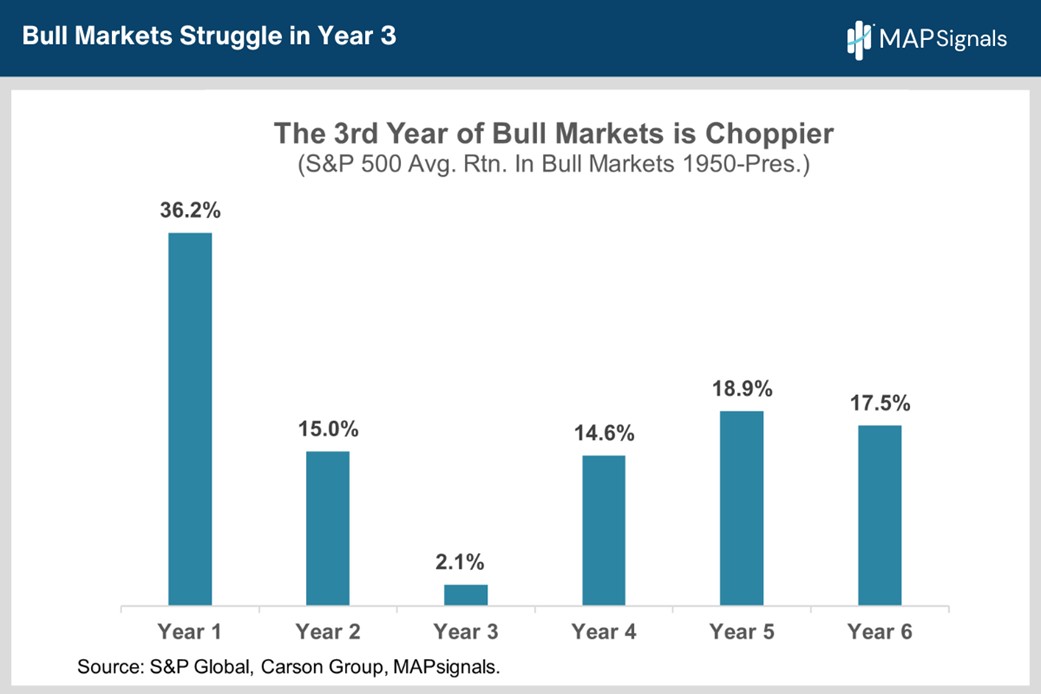
Year 3 of a Bull Market Performs the Worst
Year three tends to be a consolidation year as stocks digest the huge gains we typically see in the first two years of a bull market.
The pace of the bull market advance typically re-accelerates in years four, five and six (if a bull survives that long) after year three gives stocks a chance to recharge their batteries, so to speak.
This is why stock picking will reign supreme in 2025.
How to Tilt Your Portfolio
We’ve made the macro case for choppy, volatile trading. Now, let’s tackle portfolio construction.
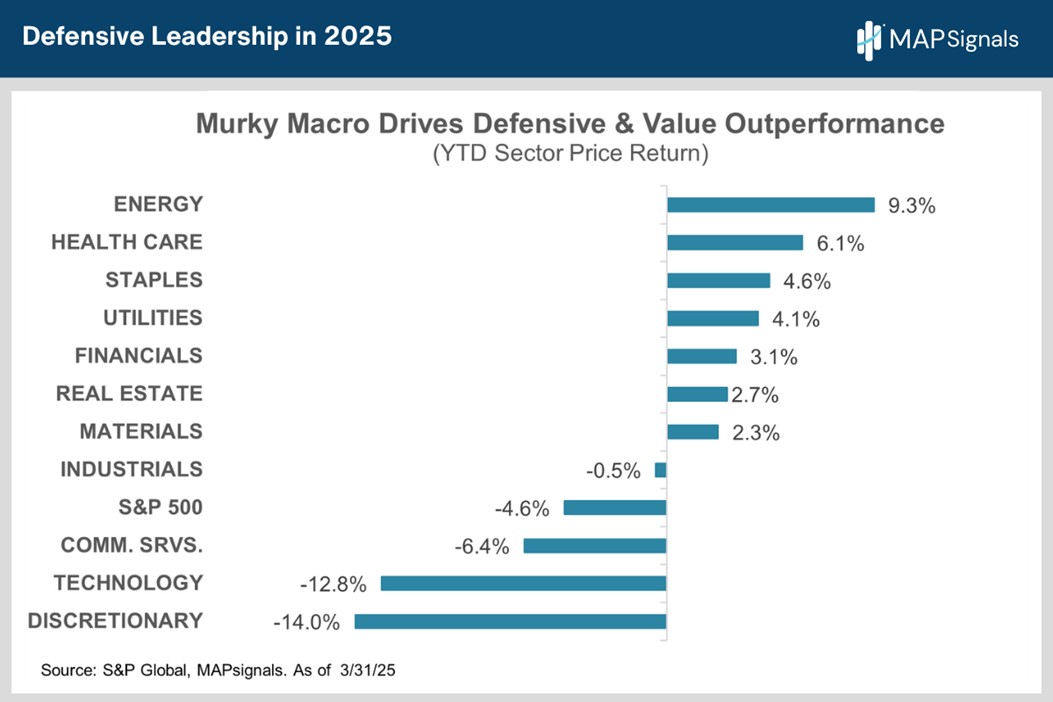
Let’s start with a review of Q1 sector performance.
It’s no surprise 2025’s best performing sectors have one big thing in common: a margin of safety.
Winning sectors are either cheap with attractive yields, like energy and financials – the S&P’s two least expensive sectors - or counter cyclical, like staples, utilities and health care, with earnings that are less sensitive to the economy’s ups and downs (chart).
It turns out that this YTD sector leaderboard matches up really well with typical performance during slowdowns.
Big Money investors are following the historical slowdown playbook.
Check this out.
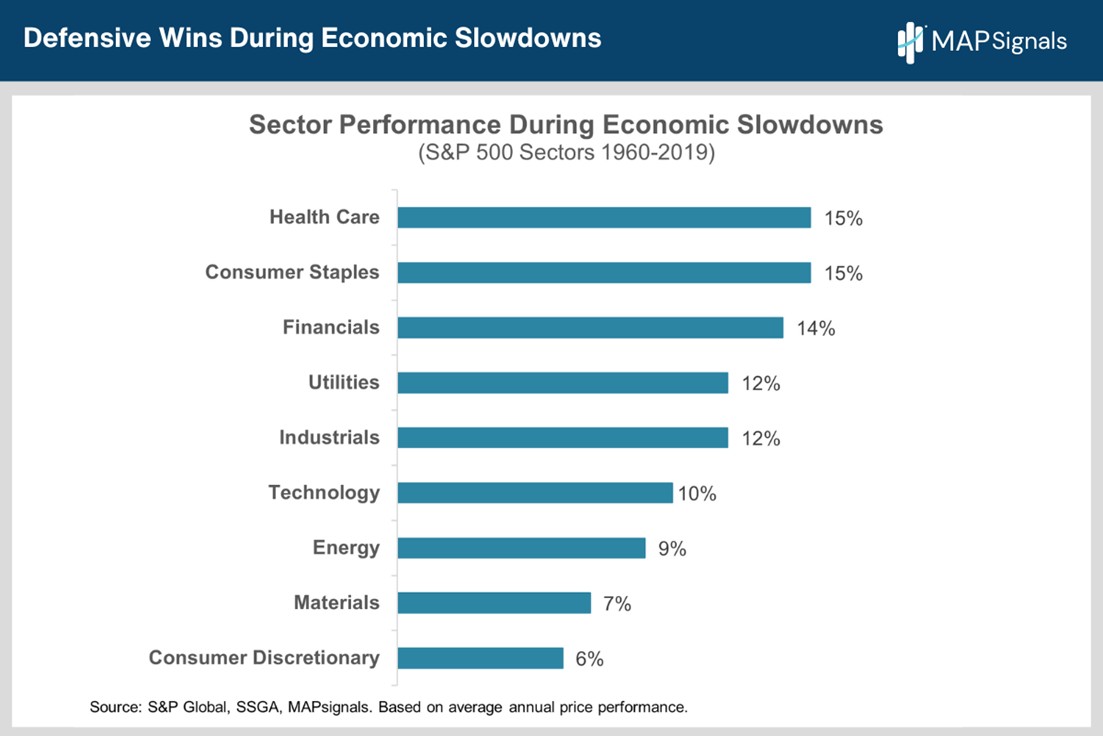
Since 1960, health care, consumer staples, financials and utilities have posted the best performance when the economy cools (chart).
This makes sense. They all offer a margin of safety that appeals when investors get more cautious.
It’s no surprise we’re also seeing the same sectors enjoying the biggest institutional inflows right now.
After all, the Big Money is the smart money. They’re very familiar with the slowdown playbook.
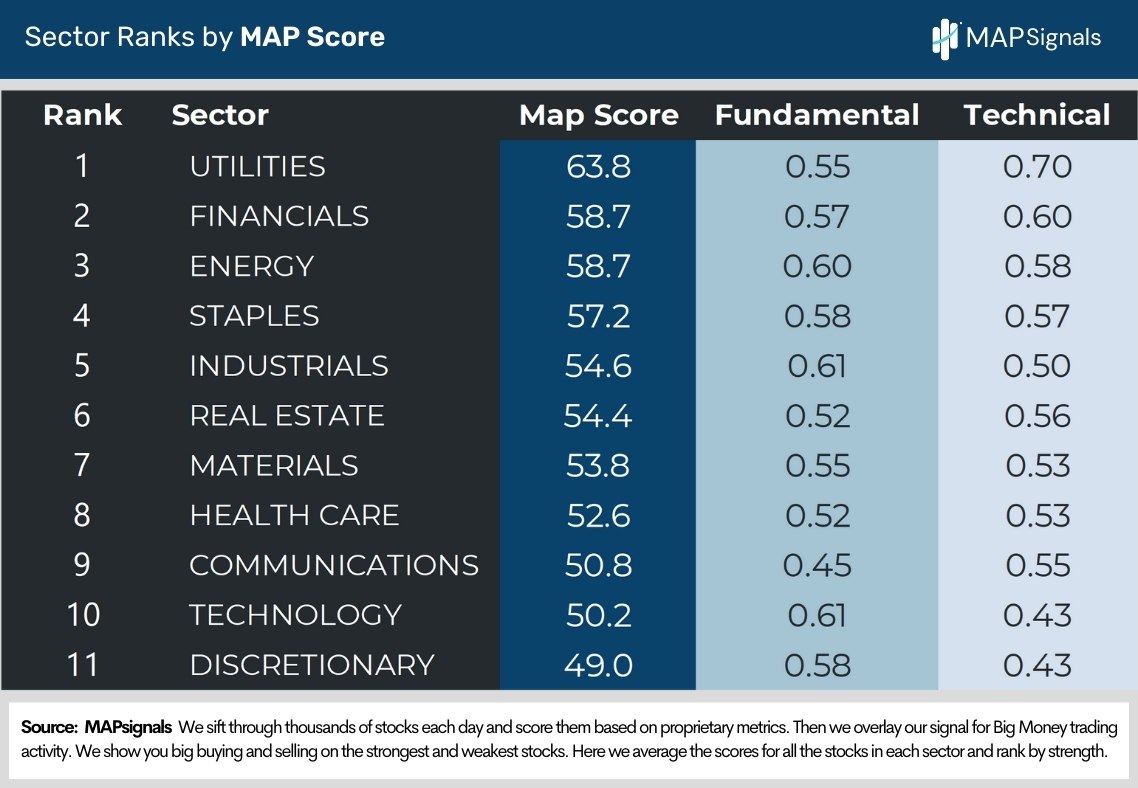
Utilities, financials and staples are all seeing huge flows right now and top our sector rankings (chart).
Energy is also popular with the big money. Oil prices have been de-risked after falling into the high 60s from over $80 in January.
Energy’s other big tailwind is the highest total shareholder yield in the S&P 500. In this sticky inflation environment, energy’s 6.5% yield - a combination of its 3.3% dividend plus a 3.2% buyback yield – is increasingly enticing.
If you aren’t a PRO member, and are a serious investor, get started today to access the below report. It’s a beauty!
Now that we have the slowdown playbook handy, let’s make hay and learn how to tariff proof your portfolio with outstanding stocks attracting healthy money flows.
We are showcasing the top 5 financial, energy, staples, and utility names ranked by MAP score.
These will offer ballast in a slowdown.