
In The End Outlier Stocks Go Up
It took me a long time to learn that in the end outlier stocks go up.
Like many, I started out wanting to be a trading god. Selling tops and buying lows was the plan. Quickly, I realized that was for the birds.
I try to learn from mistakes. Some early pitfalls were buying stocks in long-term downtrends, playing penny stocks, and selling out early.
I learned that those setups didn’t work…at least not for me. Eventually I observed that trends were powerful and real.
My first major loss came after buying a stock constantly heading down. I did what many novice traders do, I kept buying as it went lower looking for value.
Boy was I wrong. I rode that pig into the ground: down 95%. At this point, many would have licked their wounds and left trading for good. But not me. This experience changed me for the better, and I was determined to win.
Something dawned on me. I thought that if I could find a stock headed to zero, then logically I can find one going to the moon. That’s when I began flipping the script. Instead of looking for deteriorating charts, I changed my focus to look for uptrends.
I didn’t know it yet, but I was hunting JUICE: the best stocks that keep ramping year after year. After years of research, I began to realize that in the end outlier stocks go up.
But, the message still wasn’t clear. That’s because for years, I’d find some amazing companies and get excited with a profit. I found that I’d sell out early. Sure, I’d make a nice chop, but later on I’d face the painful reality that I missed the big move. For example, I made a quick mint on Mastercard, pocketing a few thousand dollars. I watched the next 10 years as it rose 20-fold without me: in the end outlier stocks go up.
Needless to say, it was a long, hard journey full of nicks and bruises. And I’m still learning to this day…
But it’s gotten much easier. Why? Because I now stay committed to my portfolio.
I rarely sell my personal holdings. In fact, I often continually add to them. When you miss out on a 20-bagger like Mastercard, you learn to hold.
And when you’ve made it through countless market pullbacks, you learn to buy the dip! That’s what we preach… over time, it’s been right.
That brings me to today’s market. We’re in the depths of summer and plenty of stocks are not heading up.
Our data has been signaling a pullback for well over a month. Small-caps were torched. Big indexes rose but only on a handful of stocks. In fact, the other day I heard someone say 1/3rd of the S&P 500 is down 10% or more from their highs. But, suddenly bullish signs are appearing.
Let me show you.
Big Money Index Is Bouncing As Sellers Vanish
You know the drill. We focus on where the Big Money is flowing. And for months, more stocks were getting sold than bought even if the indexes didn’t say so.
But last Thursday appears to have been the trough:
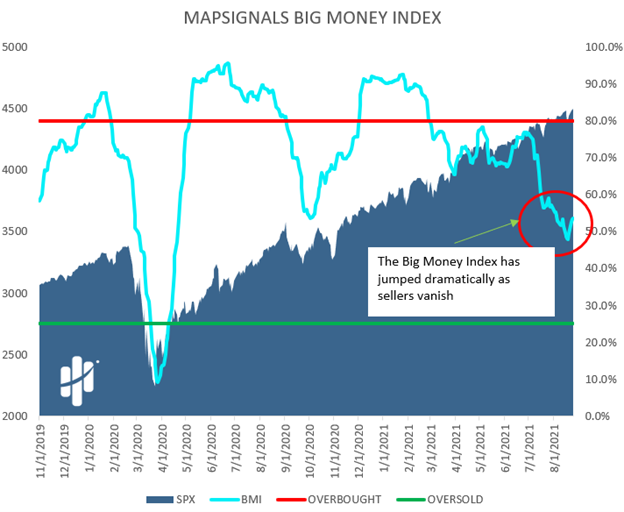
I’ve circled what’s important: The BMI has been jumping rapidly. Initial impressions say that’s very bullish. But, let’s see why it’s suddenly changing course.
To do that, let’s look at daily buys and sells in stocks. As a reminder, when a large amount of stocks get sold in a day that tends to be near-term bullish. Look how last Thursday was a big sell day for stocks:

I’ve drawn arrows on prior sell days. You can see how the market usually rips soon after. Stock dumps mean market jumps!
Zooming-in shows how selling has basically vanished:
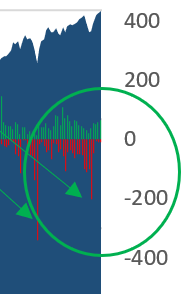
A lot of pain that has been hitting stocks has suddenly evaporated. Small-caps and Chinese stocks have bounced hard. And when selling stops, the BMI usually ramps.
You can also see the selling slowdown in ETFs. Look how Thursday was a nasty sell-day:
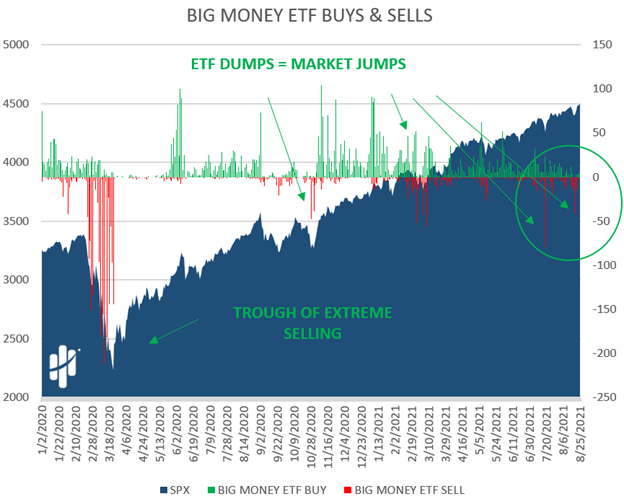
We’ve said it before, and we’ll say it again: ETF dumps = Market jumps.
All in all, data is quickly shifting from pain into gain.
In the End Outlier Stocks Go Up
Look, we get it: 2021 has been a tough year for stocks. We’ve had rotation after rotation. One week small-caps get love, and the next it’s growth.
Short-term stock movements can make your head spin. But in the end outlier stocks go up.
And therein lies the key: knowing which ones to hold is the secret to success. At MAPsignals we focus on finding the handful of stocks that crush markets over time…the outliers.
We do that by following Big Money for insights. Sure, pullbacks come …and they can be painful. But they go too… and that’s the game of investing.
As time goes on, it gets easier too. Once you stop hunting for the quick chop you can hold a few great stocks for years. It takes time but then most of the heavy lifting is done. A strong core portfolio will stand the test of time.
Let’s wrap up.
Here’s the bottom line: In the end outlier stocks go up. We focus on holding for longer and adding when times are tough. But, we make sure we’re adding high-quality stocks.
That’s where MAPsignals shines over the long-term. We don’t win all the time, but we win more than we lose with wins bigger than losses. We do that over time.
That’s what’s important.
If you’re looking to find out more about what we do, get started here.
If it feels like I’m beating a drum – you’re right for a reason. This week, the world lost a great musician, the Rolling Stones’ Charlie Watts.
When looking back on his illustrious career he said he “worked five years and [spent] 20 years hanging around.”
That’s exactly how investing should be!
We believe, that if you pick outliers and work (hold) the first few years, you can hang out for decades after.
***Lastly, if you want to get pumped up, check out our latest video: Best Dividend Stocks for September 2021. Luke showcases 5 juicy stocks on his radar. But most importantly, it’s the process.
Make sure to like and subscribe to our YouTube channel!