• Menu
  • Skip to right header navigation
  • Skip to main content
  • Skip to primary sidebar
  • Skip to footer

MAPsignals

We map big money.

  • Latest Insights
  • Power of MAP
    • MAP Products
    • MAP System
    • MAP White Papers
    • Videos & Interviews
  • Profit with MAP
  • About
    • About MAP
    • MAP Team
    • Authors
    • MAP System
    • MAP Products
    • Big Money Index
  • Members
    • Get Started With MAP
    • My MAP
    • Big Money Charts
    • MAP View
    • MAP View Options
    • MAP Top 20 Weekly
    • MAP 50
    • Member Updates
    • Platinum Updates
    • Members Only Posts
    • Performance
  • Portal

Is Tech’s Rebound For Real

April 4, 2022 //  by Alec Young//  Leave a Comment

The tech bear market has been brutal. High quality blue chips are down 20% since November while unprofitable, “concept” stocks have been getting clobbered since early 2021.

But lately tech’s starting to get its mojo back. Is tech’s rebound for real?

Is Tech’s Rebound for Real?

Is this a durable rally or a dead cat bounce? Today, I’ll show you how to play it.

Is Tech’s Rebound For Real?

To kick things off, I’ll explain the macro factors driving tech’s rebound. Then I’ll use MAPsignals data to show you how to play it with leading tech ETFs and a small cap, outlier that just keeps getting bought.

Tech is an important call to get right – it sets the tone for the whole market. The S&P 500’s overall direction tracks technology because the sector is so big – it’s 26% of the index. That’s double the next two largest sectors combined – financials, and healthcare – both of which weigh in at 13%.

Here’s my take on what’s driving tech’s turnaround:

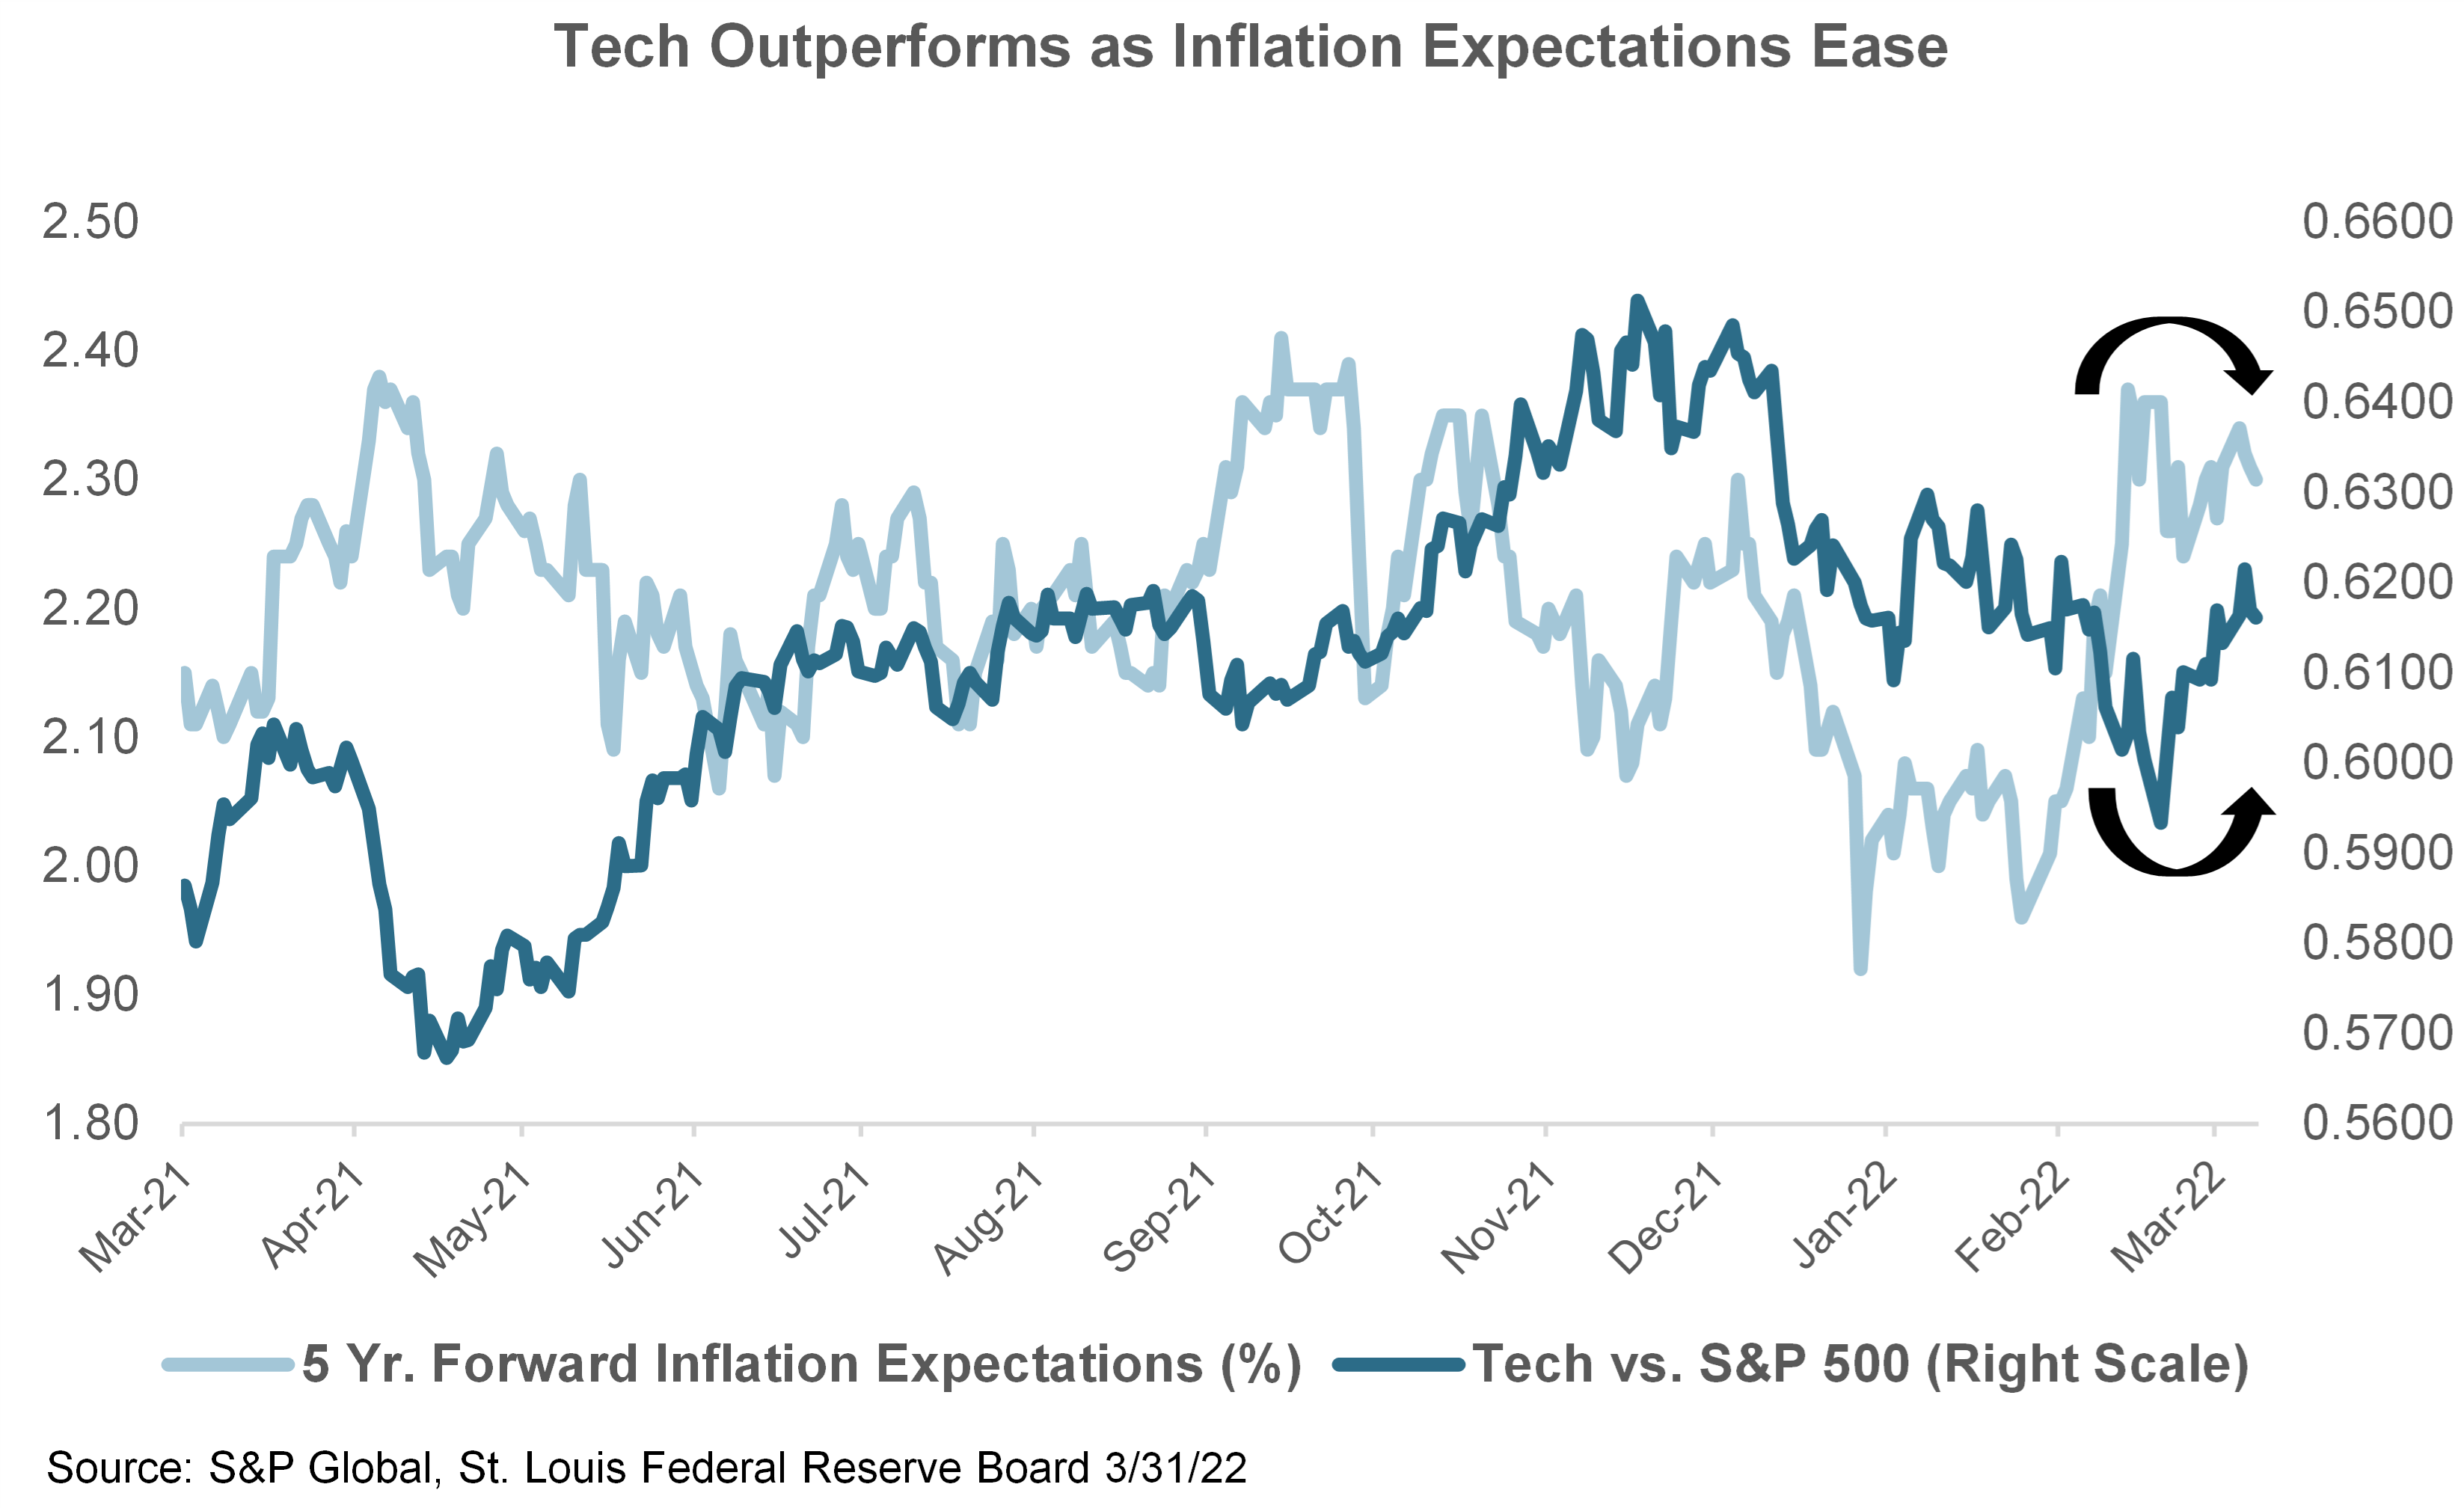
  • Less Fed Uncertainty: The Fed’s hawkish pivot at their mid-March meeting ripped the band aid off. Markets are now betting a more hawkish Fed can tame inflation. As future inflation expectations eased tech immediately began outperforming sharply (chart). Fed funds futures price in a 3.25% mid-2023 peak in the fed funds rate. Multiple 50 basis point hikes are now expected.
  • When Growth is Scarce, Tech Shines: With recession fears elevated as the Treasury yield curve closes in on inversion, tech’s reliable, all-weather growth is attracting bargain hunters.
  • Market Leading Profit Margins: The S&P 500 tech sector’s net profit margin of 23% towers over the S&P 500’s 13%. The spread between the two has never been wider.
  • Growth at a Reasonable Price: Despite its much higher margins, tech’s 20% valuation premium over the S&P 500 is in line with the 30-year average. Tech trades at 24.4X ‘22 EPS vs. S&P’s 20X.
  • Less Sensitivity to Rising Rates: High quality, mega cap tech stocks are cash rich – they don’t need to borrow money. That leaves them far less vulnerable to rising rates than most companies.
  • Easing Commodity Prices: Anything that cools the commodity rally benefits tech by reducing inflation worries. Progress towards a Ukrainian ceasefire would have the biggest near-term impact.

Now, check how the Technology sector ramps when inflation expectations ease:

Tech Outperforms as Inflation Expectations Ease

Lately, Wall Street expects inflation to dampen, sending the Technology group higher. But, now let’s check on the Big Money data.

Here’s a look at the 2 biggest tech ETFs: the Nasdaq 100 ETF, QQQ and the S&P 500 Tech sector ETF, XLK. Both ETFs get you lots of exposure to high quality, mega cap tech names like AAPL, MSFT, GOOGL and NVDA, among others.

Below are the daily buys and sells of stocks the past 6 months overlaid on QQQ. Recently, selling has slowed market wide, paving the way for buyers to step in. (Click image to enlarge)Big Money stock buys and sells QQQ

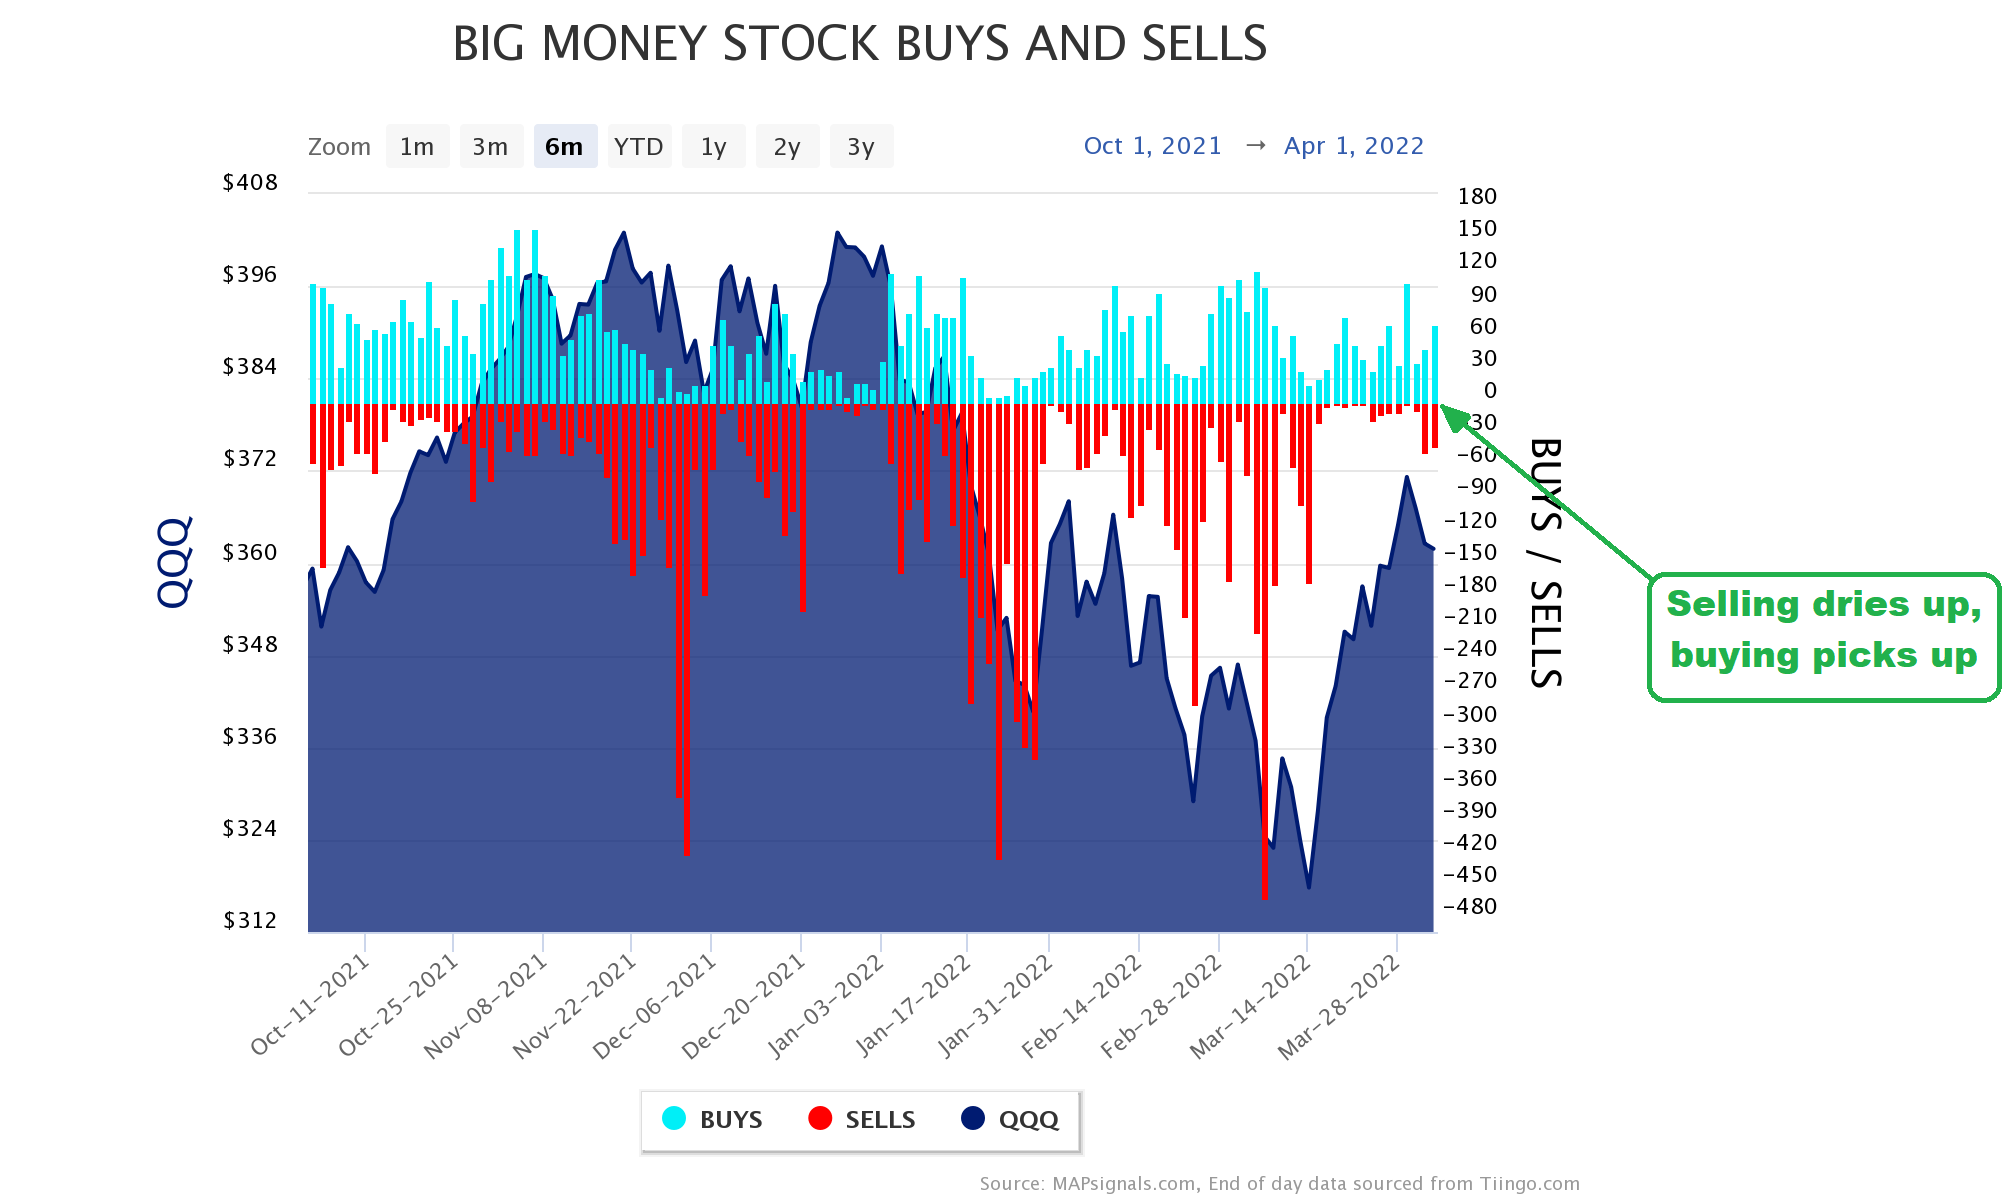
Next, let’s zero in on the Tech sector ETF. Check it out: (Click image to enlarge)

Technology vs XLK Big Money Signals

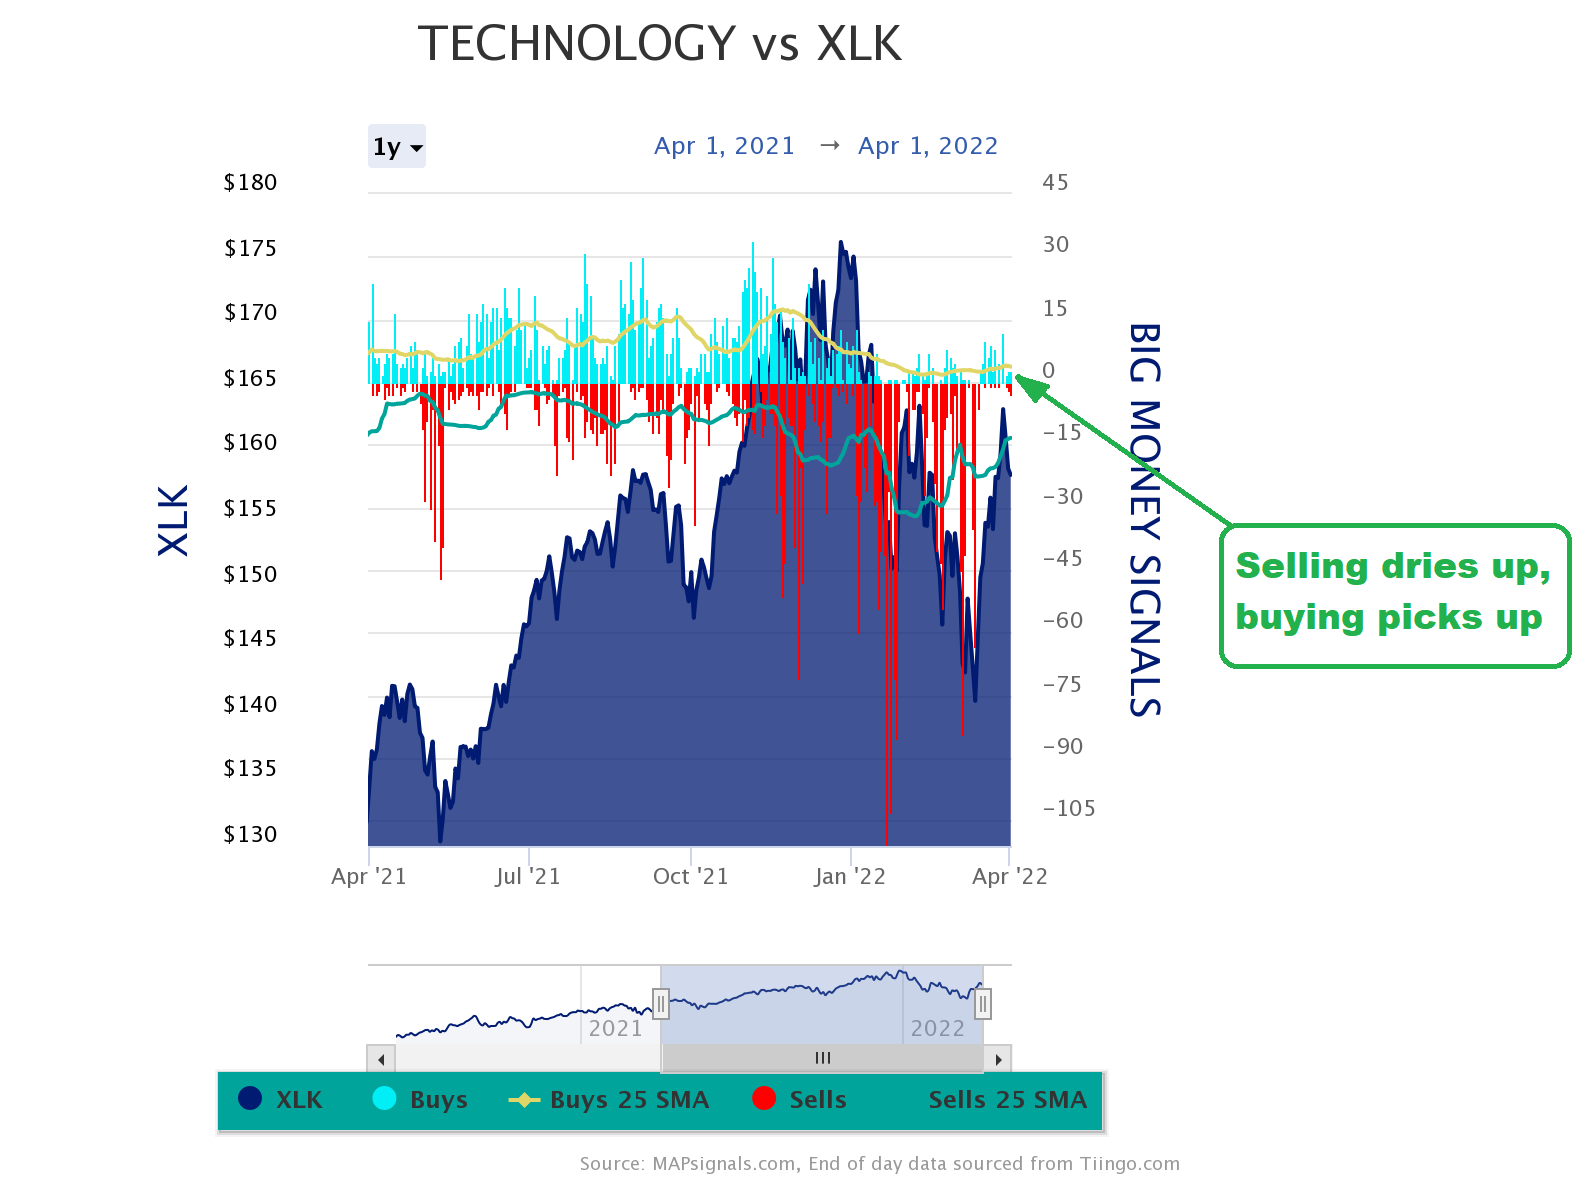
Both charts indicate heavy selling dried up recently as big buying has accelerated.

Now let’s dig deeper. Here’s an under the radar, profitable, small-cap outlier. Rambus (RMBS) is a MAPsignals’ Top 20 chip name seeing big money buying. RMBS has appeared in the Top 20 only twice since 9/6/16, so it’s a newer name. Since its first appearance, it’s up 128%. Lately, it just keeps getting bought.

Rambus Inc RMBS

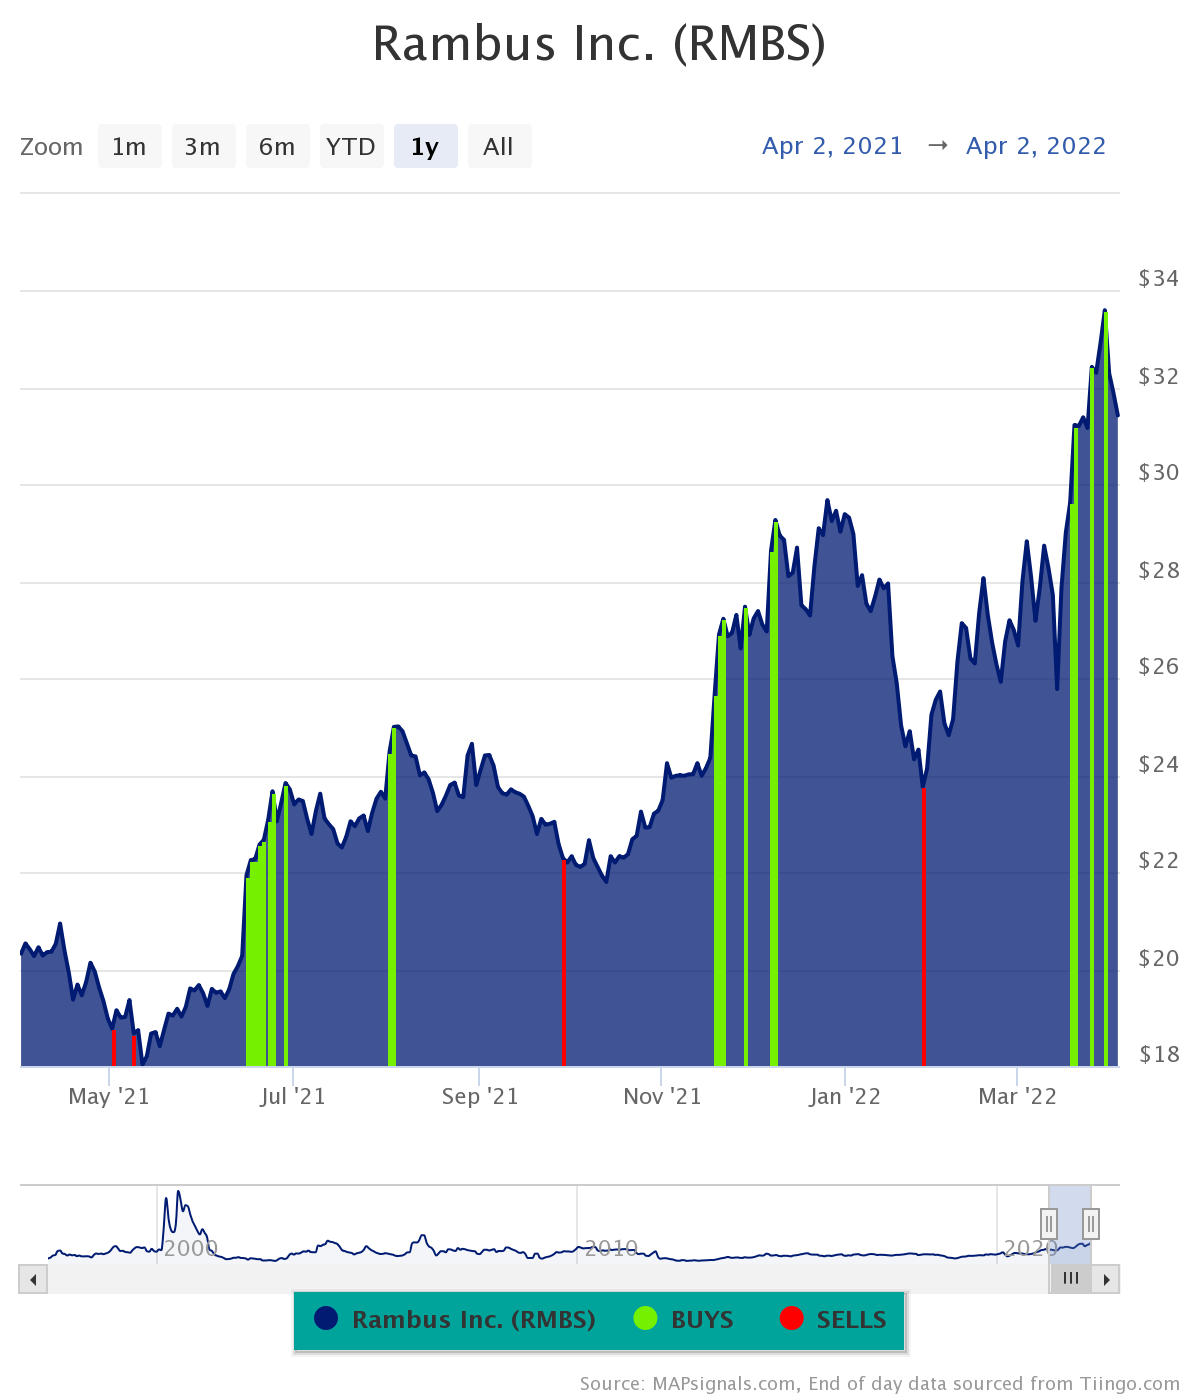
That’s the Big Money in action.

Bringing It All Together

In the wake of a brutal bear market, opportunity is emerging in high quality, mega cap tech names and smaller outliers seeing consistent, Big Money buying.

The Fed’s more hawkish stance has increased the Street’s confidence it can tame inflation. And with recession fears elevated, tech’s reliable, all-weather growth is attracting bargain hunters, especially given record profit margins and more reasonable valuations. Any positive geopolitical developments and easing commodity prices would just be icing on the cake.

Trade well,

-Alec

Using MAPsignals data helps visualize the Tech opportunity – consider starting a subscription today.


***Tomorrow’s the day! Join Jason, 11AM ET, as he presents The Bear Market Guide to Picking Stocks at the Wealth365 summit. It’s virtual and FREE!

MAPsignals Jason Bodner Wealth365

Alec Young
Alec Young

Alec Young serves as MAPsignal’s Chief Investment Strategist. Alec is an experienced Wall Street investment strategist who has served in progressively more senior, client and media facing roles at major investment firms since 2005. Prior to joining MAPsignals, Alec spent 15 years in senior investment strategist roles at major financial firms. Most recently, he served as FTSE Russell’s Managing Director of Global Markets Research. Prior to that, he was VP & Investment Strategist at Oppenheimer Funds and served as Global Equity Strategist at S&P Global.
See his full bio here.

Spread the word!

Category: All, Macro Insights

Previous Post: «Big Money Index is Breaking Out Big Money Index is Breaking Out
Next Post: Best ETFs to Buy Now for April 2022 Best ETFs to buy now for April 2022»

Reader Interactions

Leave a Reply Cancel reply

Your email address will not be published. Required fields are marked *

Primary Sidebar

Get Big Money Insights for FREE

Want to know where the Big Money is headed?

Just enter your email address below. You'll get our FREE NEWSLETTER sent directly to your inbox.

We call it Big Money Insights... It’s your weekly sneak peek at the powerful market-moving forces that are hidden from 99% of investors.

"*" indicates required fields

This field is for validation purposes and should be left unchanged.

Categories

  • All
  • Big Money Insights Weekly
  • Big Money Series
  • Macro Insights
  • MAP In The Media
  • Members Only
  • Performance
  • Podcast
  • Special Reports
  • Stocks
  • Videos & Interviews
  • White Papers

Archives

  • February 2023
  • January 2023
  • December 2022
  • November 2022
  • October 2022
  • September 2022
  • August 2022
  • July 2022
  • June 2022
  • May 2022
  • April 2022
  • March 2022
  • February 2022
  • January 2022
  • December 2021
  • November 2021
  • October 2021
  • September 2021
  • August 2021
  • July 2021
  • June 2021
  • May 2021
  • April 2021
  • March 2021
  • February 2021
  • January 2021
  • December 2020
  • November 2020
  • October 2020
  • September 2020
  • August 2020
  • July 2020
  • June 2020
  • May 2020
  • April 2020
  • March 2020
  • February 2020
  • January 2020
  • December 2019
  • November 2019
  • October 2019
  • September 2019
  • August 2019
  • July 2019
  • June 2019
  • May 2019
  • April 2019
  • March 2019
  • February 2019
  • January 2019
  • December 2018
  • November 2018
  • October 2018
  • September 2018
  • August 2018

Follow us on Twitter

MAPsignals Follow 1,449 1,070

MAPsignals is a data platform that tracks institutional money flows in stocks and ETFs. Sign up for free insights here: https://t.co/SaAVHjKC9J

mapsignals
mapsignals avatar; MAPsignals @mapsignals ·
19h 1622987016957820928

One of my favorite #dividend #stocks having a day - Skyworks Solutions $SWKS - owned it for years

The $2B buyback is pretty significant given the market cap is sub $19B

#Semiconductors continue to see major inflows

Reply on Twitter 1622987016957820928 Retweet on Twitter 1622987016957820928 0 Like on Twitter 1622987016957820928 2 Twitter 1622987016957820928
Load More...

Footer

© 2021 Mapsignals.com

  • Home
  • Contact & Disclaimer
  • Privacy Policy
  • Terms & Conditions
  • Opt-out preferences
  • FAQ

Copyright © 2023 · Mai Law Pro on Genesis Framework · WordPress · Log in

✕
What Happened to Risk Assets White Paper is Here

Get your copy here and take a journey through our thoughts on margin and leverage.

Enter your email address below and you'll get our FREE NEWSLETTER sent directly to your inbox. 

 We call it Big Money Insights... It’s your weekly sneak peek at the powerful market-moving forces that are hidden from 99% of investors.