• Menu
  • Skip to right header navigation
  • Skip to main content
  • Skip to primary sidebar
  • Skip to footer

MAPsignals

We map big money.

  • Latest Insights
  • Power of MAP
    • MAP Products
    • MAP System
    • White Papers
    • Videos & Interviews
    • Big Money Podcast
  • Profit with MAP
  • About
    • About MAP
    • MAP Team
    • MAP System
    • MAP Products
    • Big Money Index
  • Members
    • Get Started With MAP
    • My MAP
    • MAP View
    • MAP Options
    • MAP Top 20 Weekly
    • MAP 50
    • Member Updates
    • Platinum Updates
    • Members Only Posts

Make ’em Take ’em

August 27, 2020 //  by MAPsignals Staff//  6 Comments

Remember playing neighborhood basketball? Moms would send us outside for hours.

We had to be creative with our game.

We’d start out with a game of horse to get things going. But, eventually we ended up in a heated match of make ‘em take ‘em.

It’s a game of momentum. Basically, the player that makes the basket keeps the ball. It starts out as fun, but then someone would usually dominate and embarrass everyone else.

There were some kids that could score at will and the others just had to stand and watch. Baskets would drain. The ball kept being checked back to the shot scorer.

make 'em take 'em

It was humiliating for the player that couldn’t stop ‘em. But, for the kid making swoosh after swoosh – it was amazing.

Well, the interesting thing is, stocks are the same way. For most, the game is a back and forth. But with outliers, it’s utter domination. And in unusual times like now, outliers make it clear as day who the best in the game is.

The best stocks keep going higher and higher.

If your portfolio isn’t loaded with them, you’re simply just watching the other team rack up all the points. It’s impossible to catch up if you never get a stop. And many of these stocks haven’t slowed their rally for months.

This is happening even as market breadth is weakening.

Big Money Index Is Slowly Falling

Watching the markets all day, you get the sense that everything is rallying. But, that isn’t the case.

Our Big Money Index has actually been in a steady downtrend for nearly 3 weeks. In fact, there’s a good chance that we won’t be overbought this time next week.

big money index is slowly falling

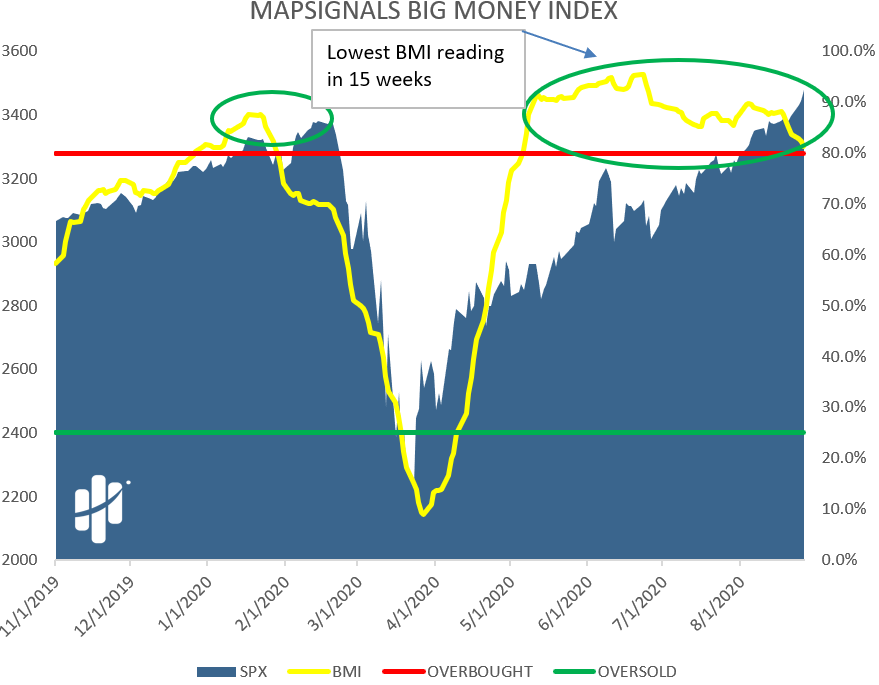
As you can see above, the BMI is slowly falling. This is happening even as the S&P 500 is gaining. When much of an index is heavily weighted towards mega-cap tech, this happens. Especially when outlier stocks get bid up day after day.

The BMI falling is just one data-point out of many that we look at. Currently, there’s no indication that the party in stocks is over. They still hold the ball.

But, the good news with make ‘em take ‘em is that the other team eventually gets the ball. A sleeper stock that we’ve held for years has finally sprung to life.

Outlier Stocks Make ’em Take ’em

Making hay in stocks is simple when you learn to hold. A great example occurred this week.

Over years we’ve been creating personal portfolios that hold many stocks that continually see Big Money buying. One of those bets was Salesforce.com (CRM).

And while we tend to never sell, what happened this week is a major reason why.

News hit days ago that Salesforce.com was being added to the Dow Jones Industrial Average. That’s an elite team of stocks. That headline sent the shares up a few percent on big volumes.

But, that was just goal one. The slam-dunk came soon after.

The company absolutely destroyed earnings Tuesday night. I mean, it was a thing of beauty. A complete beat on top and bottom lines set the tone for the initial ramp after hours.

And then came the raised guidance. Wall Street loves a beat and raise by great companies. Typically, money rushes into those stocks.

It looks like this:

salesforce.com big money signals
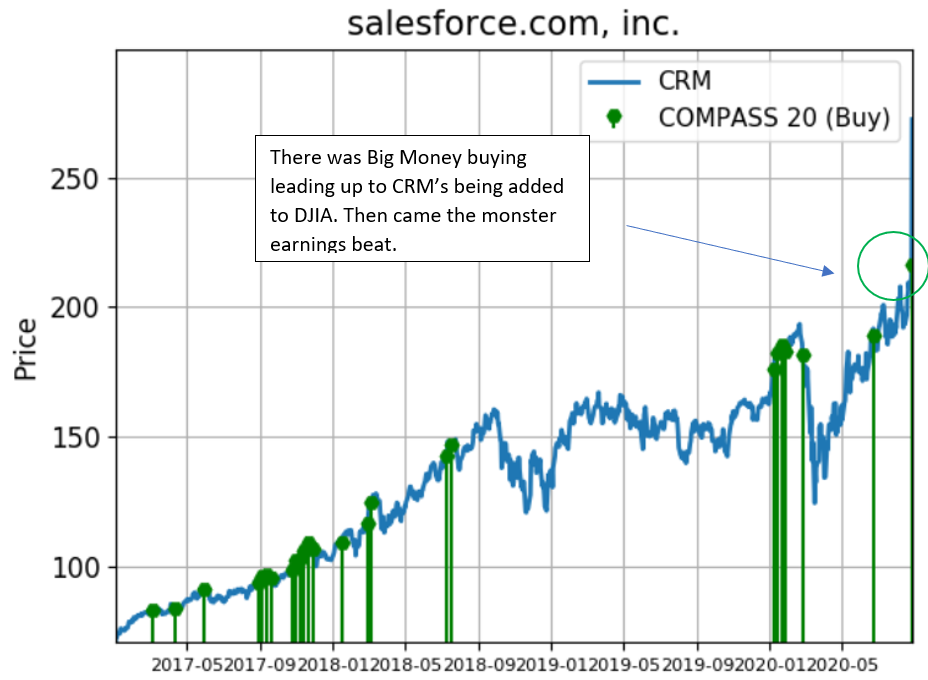
Source: MAPsignals, End of day data sourced from Tiingo.com

Those are all of the all of the times that CRM was a Top 20 stock for MAPsignals. Learn about that report here.

You can see the stretch of green that occurred from 2017 – 2018. That’s what stock market make ‘em take ‘em looks like.

What happened yesterday was a repricing. The +26% move lifted the whole Software space. It was awe inspiring to watch.

Just like with a fun game of b-ball, momentum eventually takes hold. The same thing happens when you follow the stocks that Big Money loves. When the epic runs start, you’ve gotta be along for the ride.

Waiting for a stop, sucks. Outlier stocks are running on a hot streak.

If you feel like you’re on the sidelines watching the scoreboard run away, give MAPsignals a shot.

Spread the word!

Category: All, Big Money Insights Weekly, Special Reports

Previous Post: «mic drop Mic Drop
Next Post: Animal Spirits animal spirits»

Reader Interactions

Comments

  1. Robert Hays

    August 27, 2020 at 1:35 pm

    Can you post a plot of the BMI for the past 30 years?

    Reply
    • MAPsignals Staff

      August 27, 2020 at 2:54 pm

      Hey Robert –

      We can see about doing that. The visual will get more difficult to see with such a long period.

      Reply
  2. Sribhindi

    August 27, 2020 at 2:10 pm

    As the BMI is falling, the stocks follow this (just as you said previously mother duck and baby ducklings). Do the stocks fall immediately or is there a week/ 2 weeks lag?

    Reply
    • MAPsignals Staff

      August 27, 2020 at 2:56 pm

      Usually that is the case. We are watching things to see if they deteriorate. If the BMI starts to fall rapidly, in general that is a short-term bearish signal.

      We will start paying attention once we get closer to 70%.

      The market is in unprecedented territory. So, we are taking our time with the BMI.

      Reply
  3. dave

    August 27, 2020 at 9:54 pm

    Sure wish the date info at the bottom of the chart was usable. All the numbers run together making the chart hard to understand. Should be an easy fix.

    Reply
    • MAPsignals Staff

      August 28, 2020 at 6:37 am

      Hey Dave –

      We are working to improve that and much more.

      Reply

Leave a Reply Cancel reply

Your email address will not be published. Required fields are marked *

Primary Sidebar

Get Big Money Insights for FREE

Want to know where the Big Money is headed?

Just enter your email address below. You'll get our FREE NEWSLETTER sent directly to your inbox. 

 We call it Big Money Insights... It’s your weekly sneak peek at the powerful market-moving forces that are hidden from 99% of investors.

Categories

  • All
  • Big Money Insights Weekly
  • Big Money Series
  • MAP 50
  • MAP In The Media
  • Members Only
  • Performance
  • Podcast
  • Special Reports
  • Stocks
  • Videos & Interviews
  • White Papers

Archives

  • February 2021
  • January 2021
  • December 2020
  • November 2020
  • October 2020
  • September 2020
  • August 2020
  • July 2020
  • June 2020
  • May 2020
  • April 2020
  • March 2020
  • February 2020
  • January 2020
  • December 2019
  • November 2019
  • October 2019
  • September 2019
  • August 2019
  • July 2019
  • June 2019
  • May 2019
  • April 2019
  • March 2019
  • February 2019
  • January 2019
  • December 2018
  • November 2018
  • October 2018
  • September 2018
  • August 2018

Footer

© 2020 Mapsignals.com

  • Home
  • Contact
  • Privacy Policy
  • Terms & Conditions
  • Cookie Policy (US)
  • FAQ

Copyright © 2021 · Mai Law Pro on Genesis Framework · WordPress · Log in