MAP: CAUTION! SPEED BUMPS AHEAD (3/2/2018)
SUMMARY: Caution, speed bumps ahead. Below we are attaching yesterday’s message as we believe the markets should see further downside. As a follow-up to yesterday’s email –
Our ratio dropped to 42.6% this morning and now, based on our data, suggests we should be in for more downside in the market. This, however, will be a great buying opportunity once the selling subsides.
What we are monitoring going forward are:
- Any sign of institutional buying
- Any sign of institutional selling slowing
- An oversold reading in the ratio
We will keep you updated as the current events play out.
The MAP Team
—————————————————————————————————————————————————–
***FROM 3/1/2018
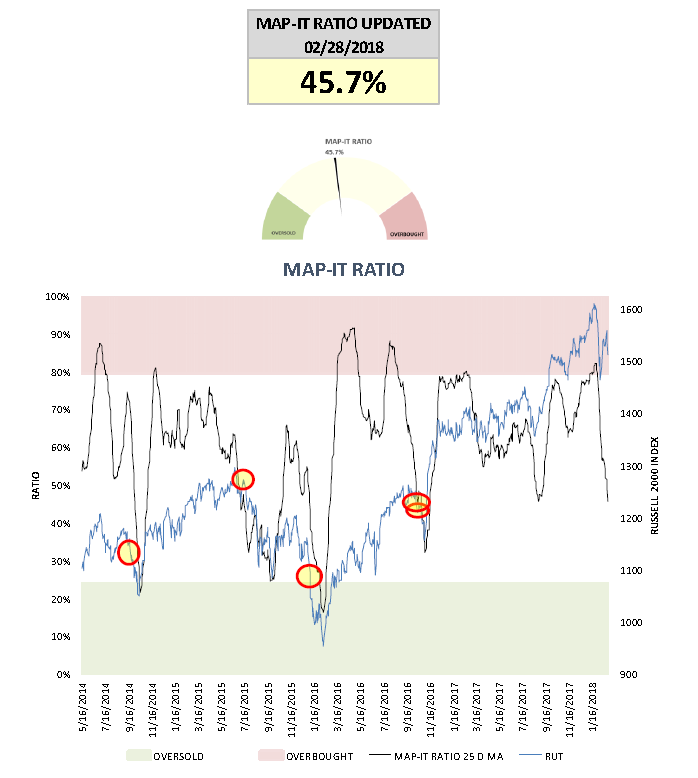
SUMMARY: Our ratio is close to reaching a level that suggests a potential buying opportunity is right around the corner.
Currently the MAP ratio sits at 45.7% and is nearing a level that has historical precedent, 45.6%. We went through our data to see what the forward returns were for IWM (Russell 2000 ETF) in each instance where the ratio decelerated and fell below 45.6%. Because we are near the 45.6% level, we will be monitoring should we break below that level in the coming days.
Below are stats on the 45.6% level and why we feel it is important:
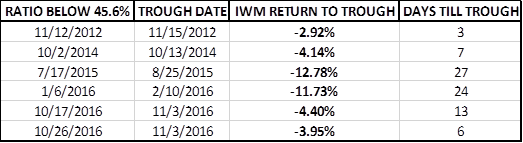
We have had only 6 instances where the ratio has been in a downtrend and then fell below 45.6%. This is out of 1400 trading days of data, so this is a very rare event.
A few observations on market returns post this 45.6% trigger:
1) the market traded lower in all instances
2) the average trading days till reaching the local bottom = 13.33
3) the average return of IWM following each of the 6 instances till the local bottom = -6.65%
Below details the 6 instances where the ratio decelerated and fell below 45.6%:
Below are the historical instances highlighted by a red circle with yellow fill: