MAP: UPDATE – Potential Bullish move ahead (8/16/2018)
We have been light on the mic recently with updates. That’s simply a function of there not being much to alert you to. No news is good news, right?! However, something did occur in the data yesterday that we want to bring to your attention.
The level of sell signals that we monitor each day returned an abnormally high result yesterday. This is interesting to us for 2 reasons:
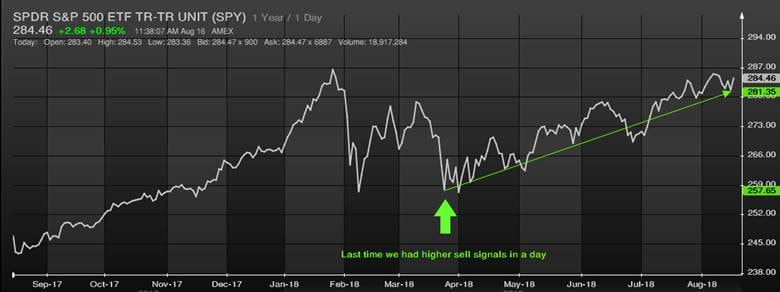
- A 1 year chart of SPY looks rather muted recently, which doesn’t jive with what we are measuring.
- The last time we had this level of selling in a day was March 23rd, 2018. We’ve included an arrow for you to see exactly where SPY was then. Clearly it marked an exhaustion point for selling in the market. The market marched higher shortly after. We believe the market could be setting up for a run higher.
Please reach out if you have any questions. We enjoy your feedback!