MAP View Stocks Q4 2018, Performance Update
One thing we at Mapsignals try and do is find the best stocks out there…the outliers. The 4th quarter of 2018 was a “rough” one for the markets to say the least. We looked back at how our weekly stock profiles performed since, given how volatile the market has been.
The 4th quarter includes the all-time closing high for the S&P 500 (2925.51) made on October 3rd. From then until the end of the quarter the market practically nosedived, falling to a closing low of 2351.10 on Christmas Eve. That was nearly a 20% pullback from peak-to-trough. Since the low we’ve seen a V-shaped recovery for markets. As of yesterday, we are still ~2% below the all-time closing high.
So, how have the MAP stock profiles performed? The below performance assumes initiation as of the profile date and held until yesterday’s close (4/3/19). Here are a couple of facts:
- Avg. Q4 stock profile return = +16.24% vs. avg. SPY (S&P 500 ETF) return = +7.85%
- Avg. December profile return = +33.73% vs. avg. SPY return = +12.70%
Needless to say, there was a large amount of out-performance. There were 3 notable standouts:
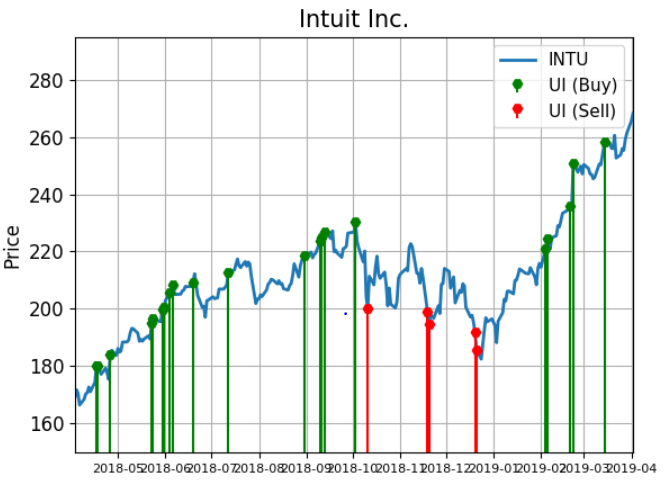
- 10/7/18, INTU (Intuit Inc.) +23.98%
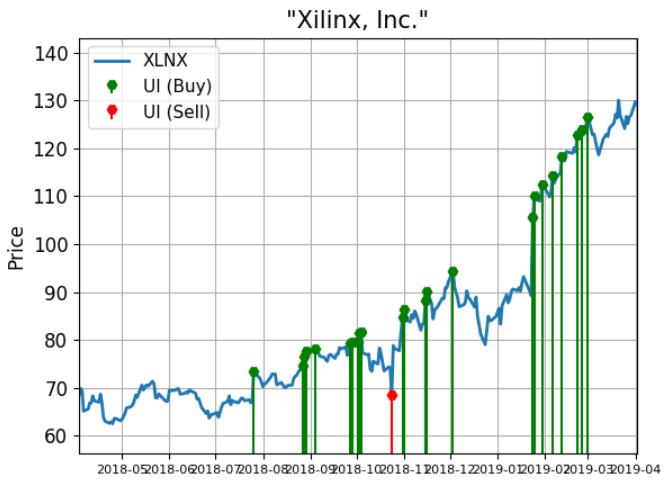
- 10/28/18, XLNX (Xilinx Inc.) +65.99%
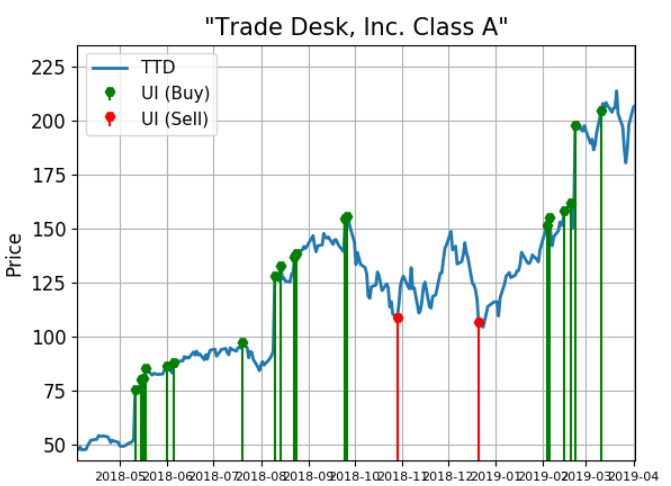
- 12/23/18, TTD (The Trade Desk, Inc.) +98.14%