
Monday Morning Quarterback
They say hindsight is 20/20.
Rolling back the tape is critical to success.
Sometimes you win, sometimes you lose.
Having a plan and process is the key to success.
Throughout this pandemic, our process was bold and data-driven.
We rewind the tape in this post.
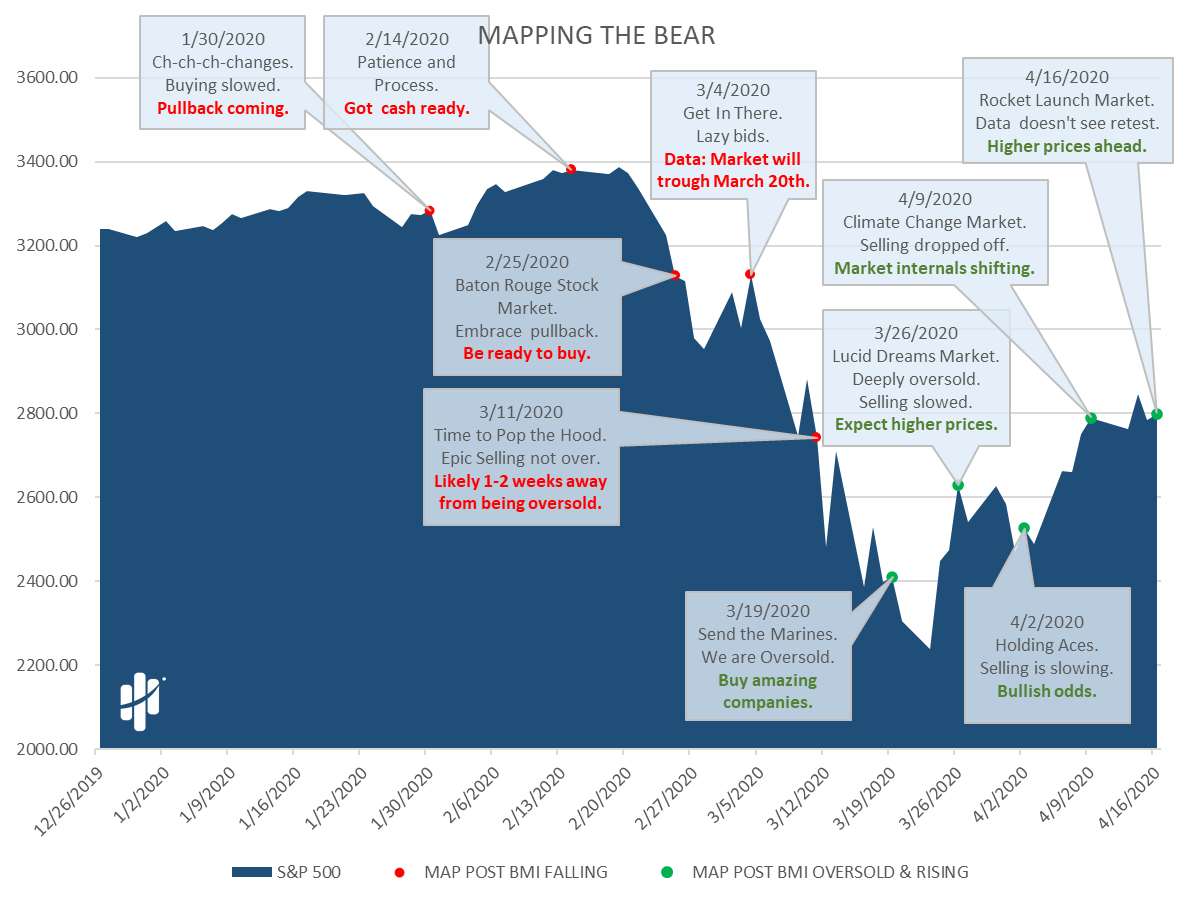
Mapping the Bear Market
The last couple of months have been trying to say the least.
We captured unprecedented data in this crisis.
Our job is to block out the noise and focus 100% on our signals.
That’s always our mission.
Below, we replay our blog posts throughout this crisis.
Every stance we took was based on supply and demand for stocks…ie the big money.
The below chart says it all. It may look jumbled, but follow the dots.
The comment box tells the date, title, and synopsis of our blog posts.
- Red dots = Big Money Index was falling
- Green dots = Big Money Index was oversold and rising
The “Monday morning quarterback” in me sees some bold:
In short, the data said when the market:
- Became overbought
- Was due for a pullback
- When to have cash ready
- When it would go oversold
- When it would trough (off by a single trading day: March 20th was a Friday. Markets bottomed on Monday, March 23rd.)
- When to buy
- To expect a rise
The point here is not to pat ourselves on the back.
Oftentimes, the way to grow as an investor is to play Monday morning quarterback.
Mapping the Market Bounce
So, where do we go from here?
After an epic fall, great stocks bounced hard and high.
The Big Money Index has blasted higher like a rocket.
The magnitude of the rise will likely tail off a bit in the coming weeks – ie, the best buying opportunity was back in the depths of the green.
As you can see below, the rise in the BMI is eerily similar to prior oversold periods:

Bottom line: hopefully the Mapsignals message was clear and sound.
We tried to “come out and say it.”
Going forward, expect things to settle in a bit.
Learn from your mistakes and successes.
While we’re playing Monday morning quarterback – the NFL draft is tonight.
If you’re curious where we stand – here’s a 2 minute video summing it all up.