
Monumental Money Shift into Dividend Growth Stocks
Most believe equities have gone nowhere the last 2 months.
On one hand that’s true.
On the other, there’s a monumental money shift into dividend growth stocks.
As I’ve said many times before, money rarely leaves the market – it rotates. And right now, we’re witnessing one of the largest rotations in recent memory.
Over the last couple of months, institutional investors have been rolling out of crowded mega-cap tech to fund high-quality income-focused equity bets.
With the Fed set to begin easing policy this month, the attraction to stable dividend growth not only makes intuitive sense… it’s THE trade that’s well underway.
Today we’ll jump into some data-driven analysis, unpacking the new under-the-surface bull market.
Then we’ll showcase one all-star stock beaming with institutional support.
Monumental Money Shift into Dividend Growth Stocks
Let’s first roll back the tape to late June when we noted how narrow market leadership had become. Back then the crowd, obsessed with AI enthusiasm, was solely focused on a handful of mega-cap tech stocks while the lions’ share of stocks was plummeting.
We made the case of how a monster reversion trade could soon be underway. From our vantage point, it was only a matter of time before left-for-dead stocks would play catchup.
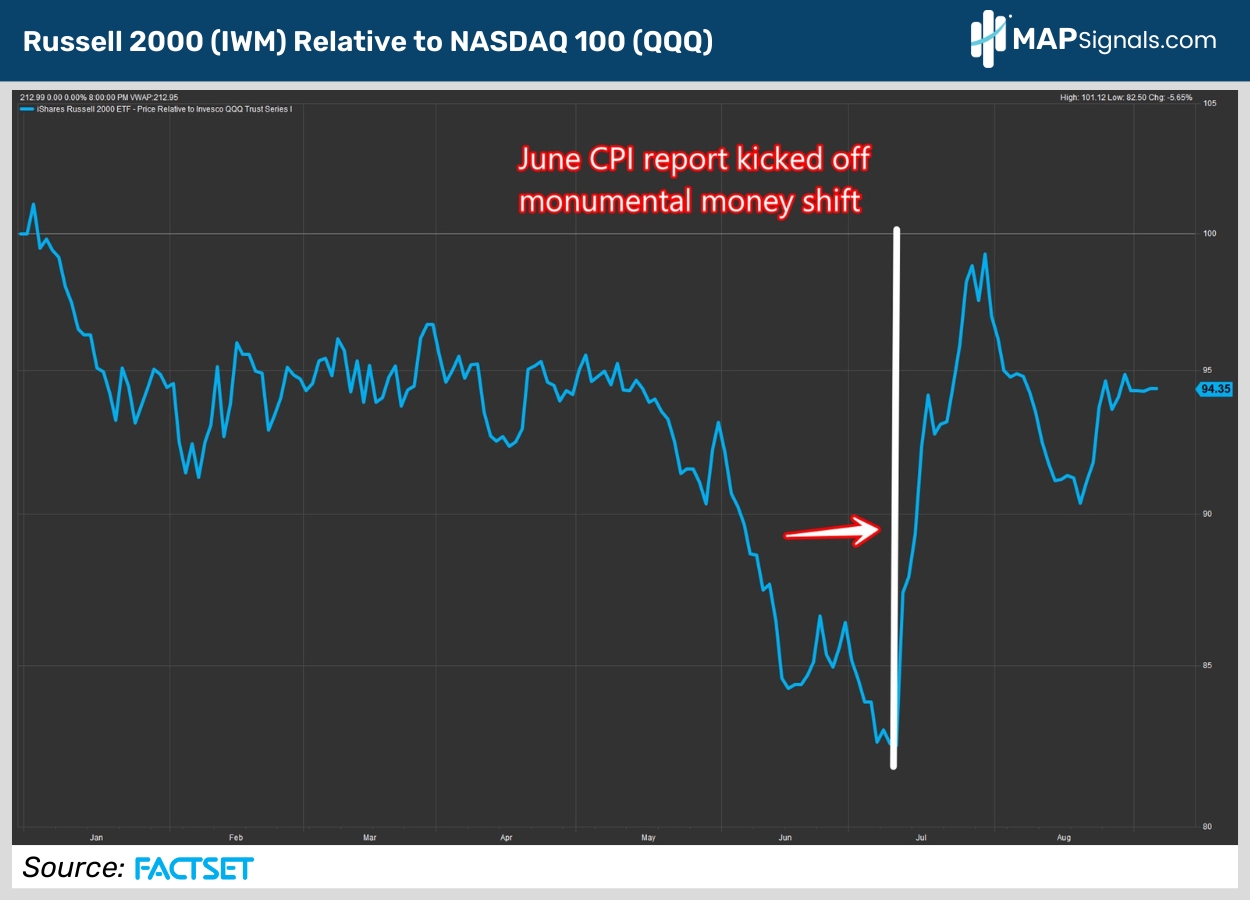
The June CPI report on July 11th was the spark that kicked off a massive unwind out of mega-cap tech and into the drastically underperforming small-caps.
Below shows this beautifully.
Here we can see a relative performance chart, comparing the Russell 2000 ETF (IWM) and the NASDAQ 100 ETF (QQQ). The white line is from July 11th, when the reversion trade was set in motion:
The money that’s rotating out of mega-cap tech isn’t solely rushing into small-caps. It’s being sprinkled throughout dividend growth areas too.
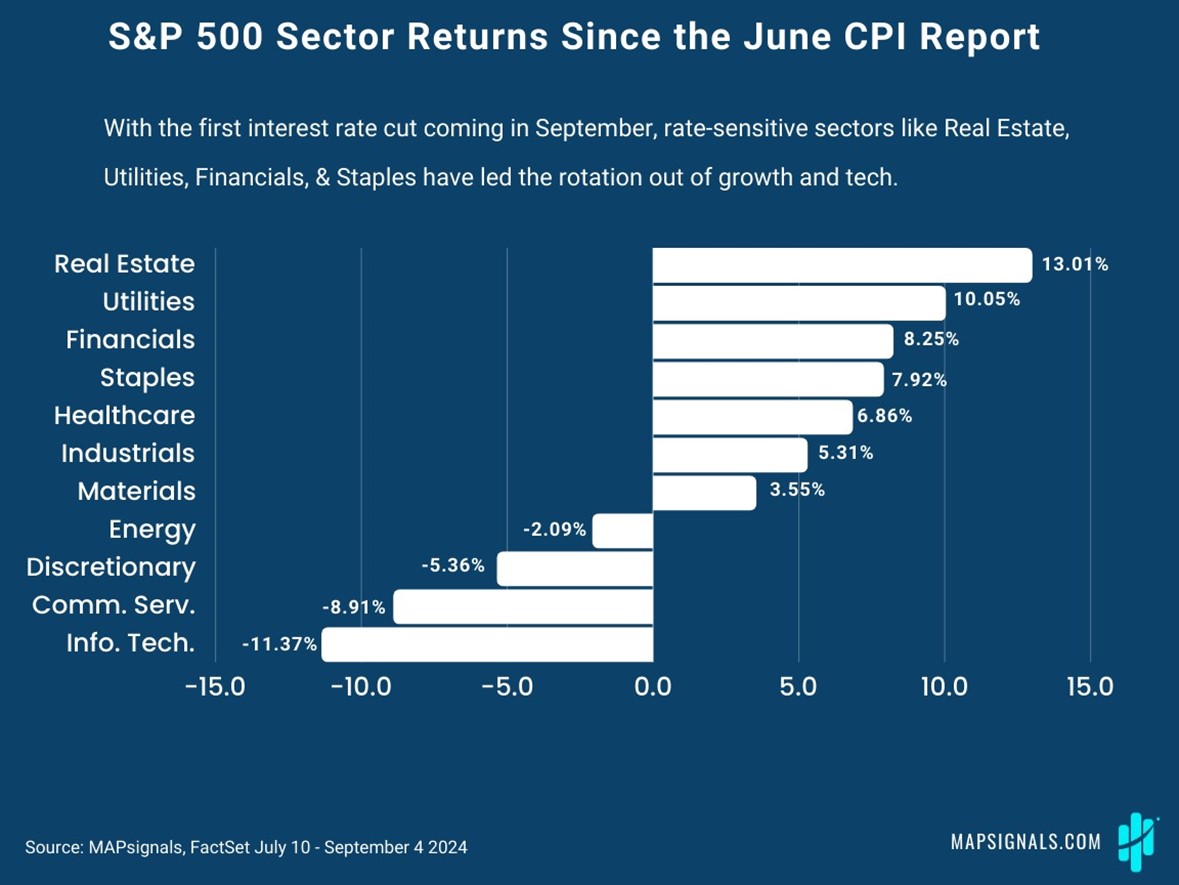
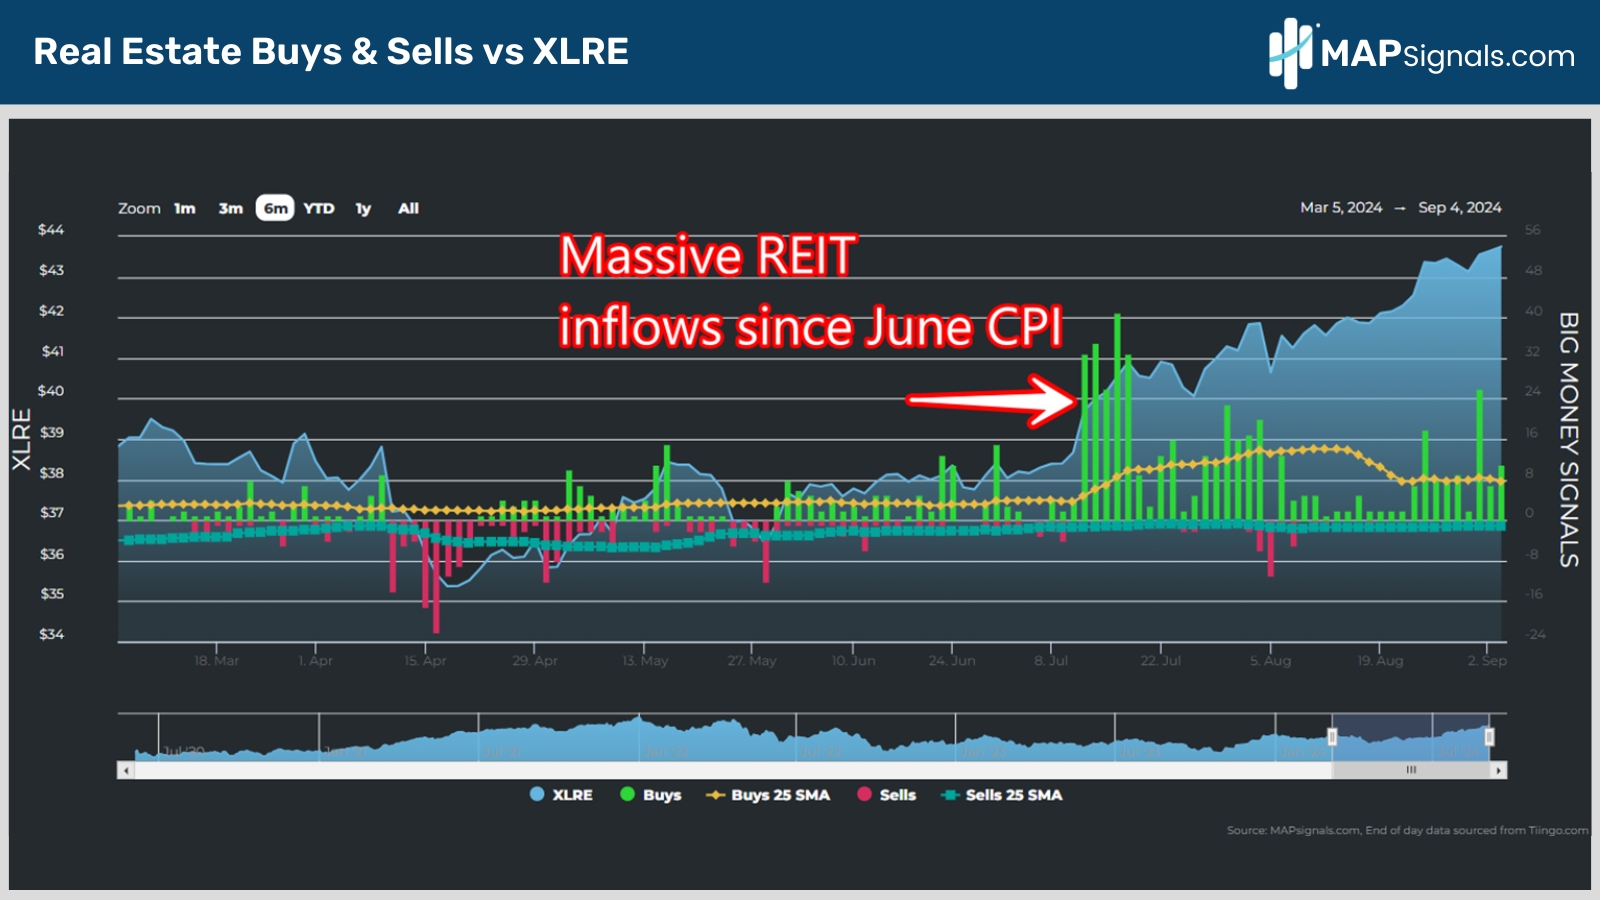
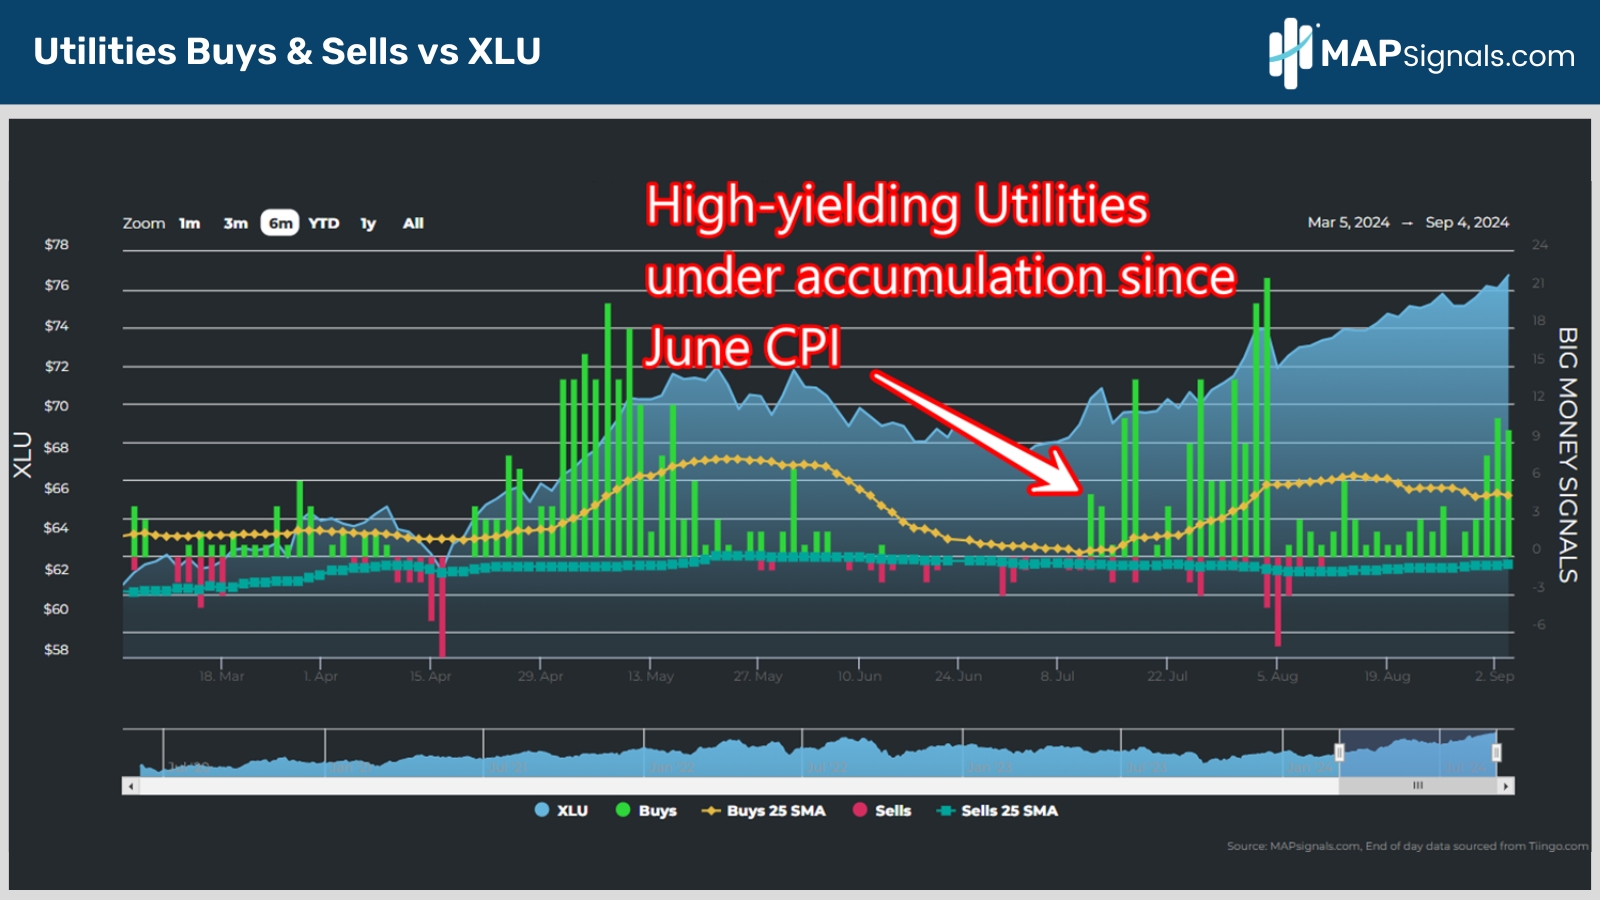
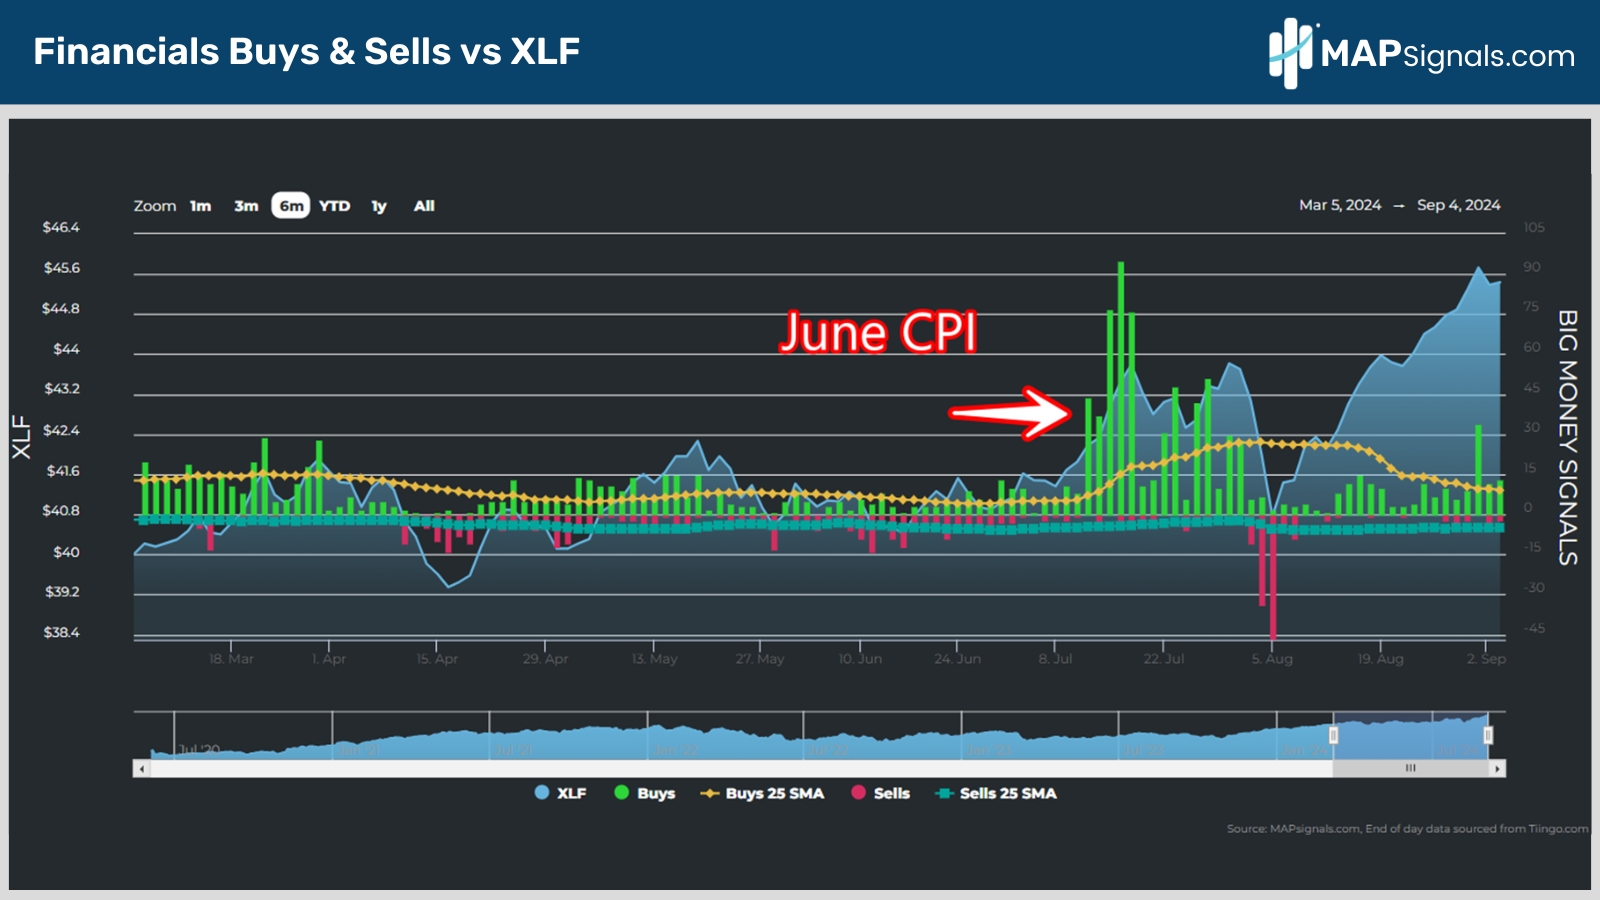
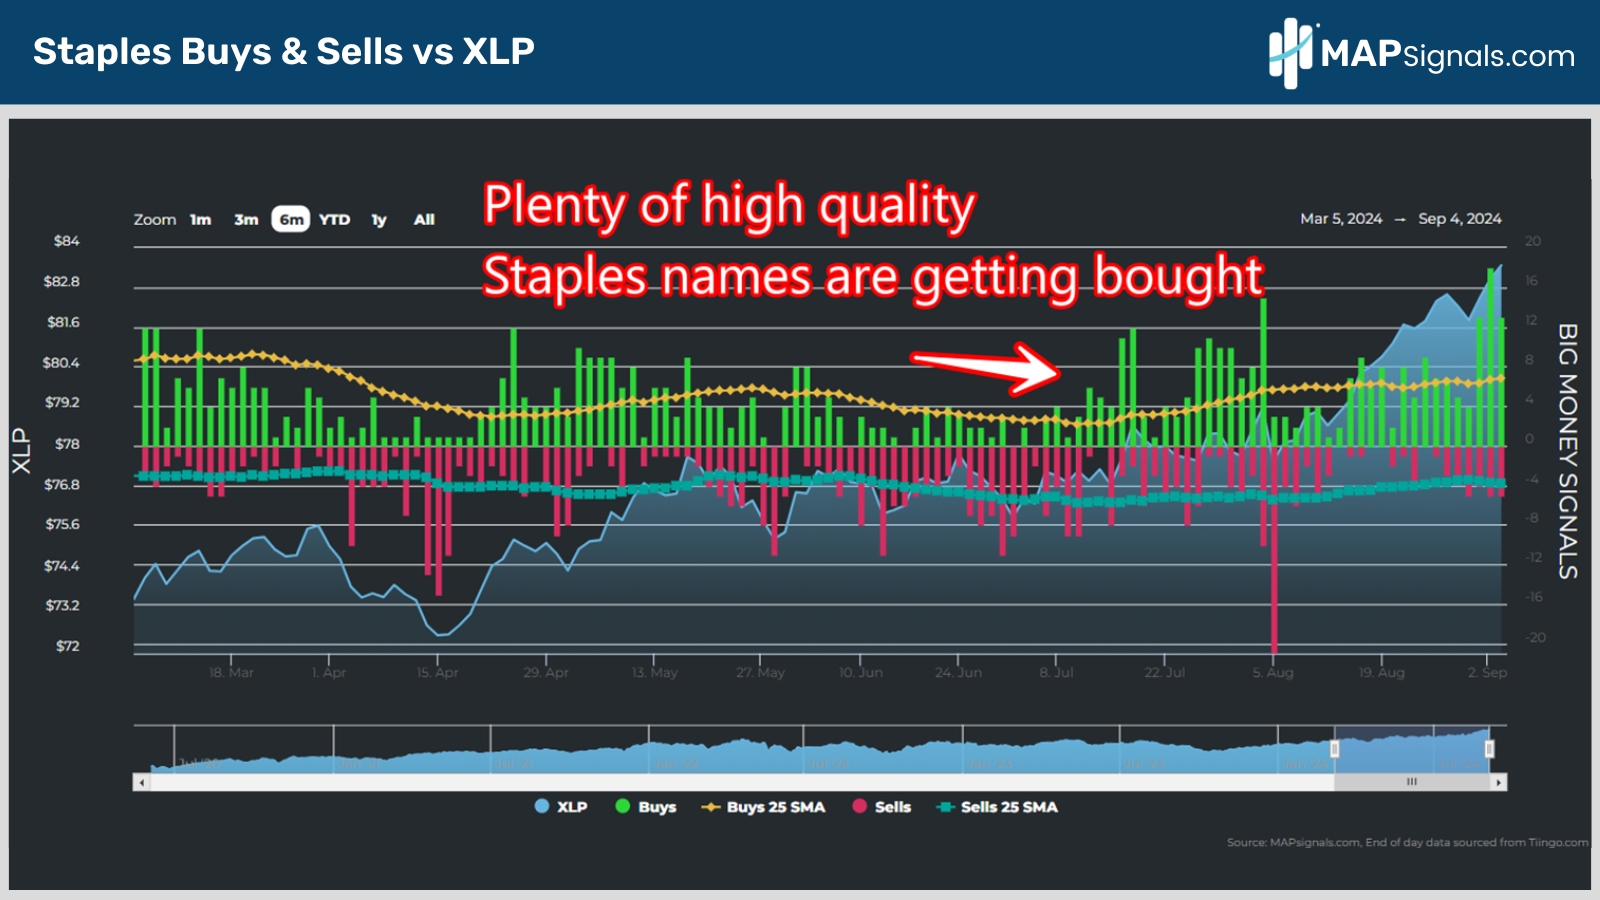
Using an illustration from last week updated through yesterday, since the June CPI report on July 11th, income-oriented equities like Real Estate, Utilities, Financials, Staples and Healthcare have been heavily accumulated while Information technology has been crushed.
From July 10th – September 4th:
- Real Estate and Utility stocks are up a staggering 13% and 10% respectively
- Financials, Staples and Health care names have gained 8.25%, 7.92%, and 6.86%
- Growth heavy groups like Communication Services and Technology are spiraling down 8.91% and 11.37% respectively
Without question there’s a monumental money shift into dividend growth stocks:
And to give further proof that there’s a healthy bull market under-the-surface, let’s consider a few more eye-popping stats.
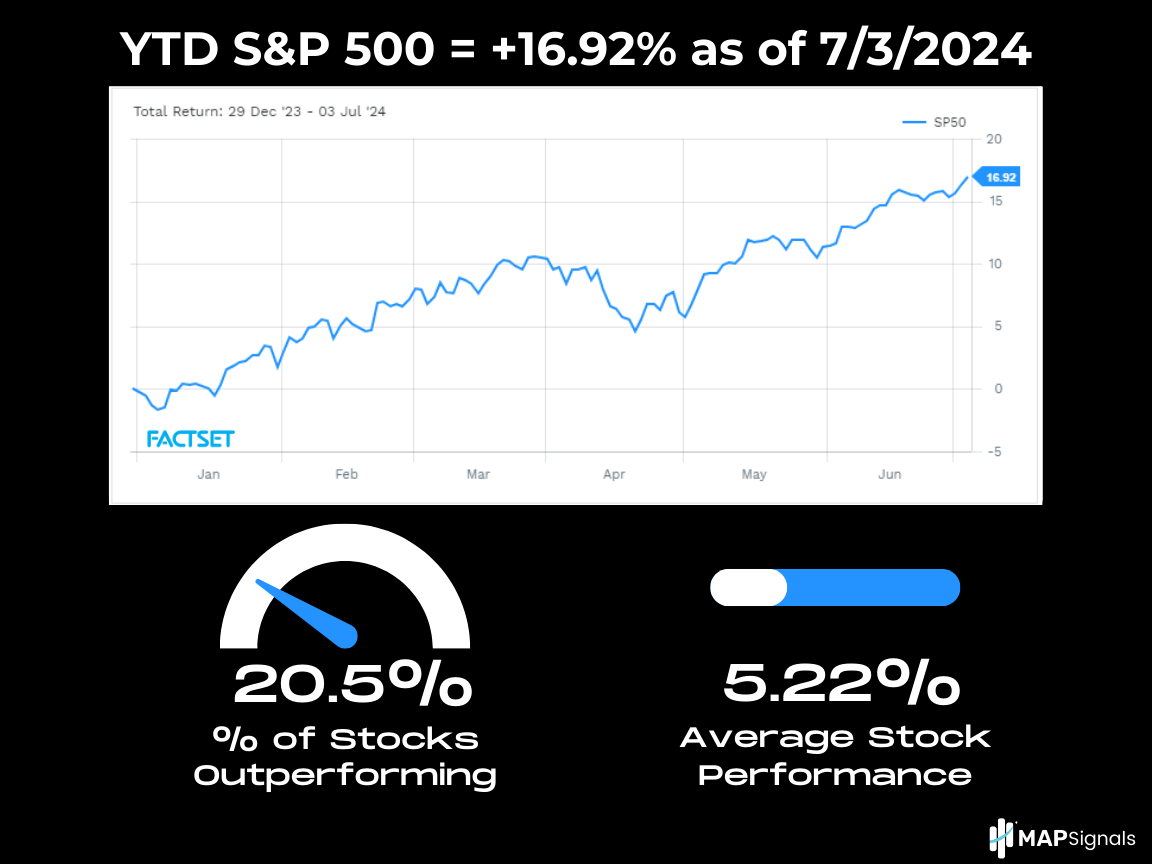
If we take a snapshot of the S&P 500 from July 3rd, we can see that the S&P 500 was up 16.92% YTD. However, only 20.5% of stocks in the index were outperforming the broad index.
Not only that, the average stock at that moment had a YTD return of just 5.22%. Again, highlighting the startling weak breadth just 2 short months ago:
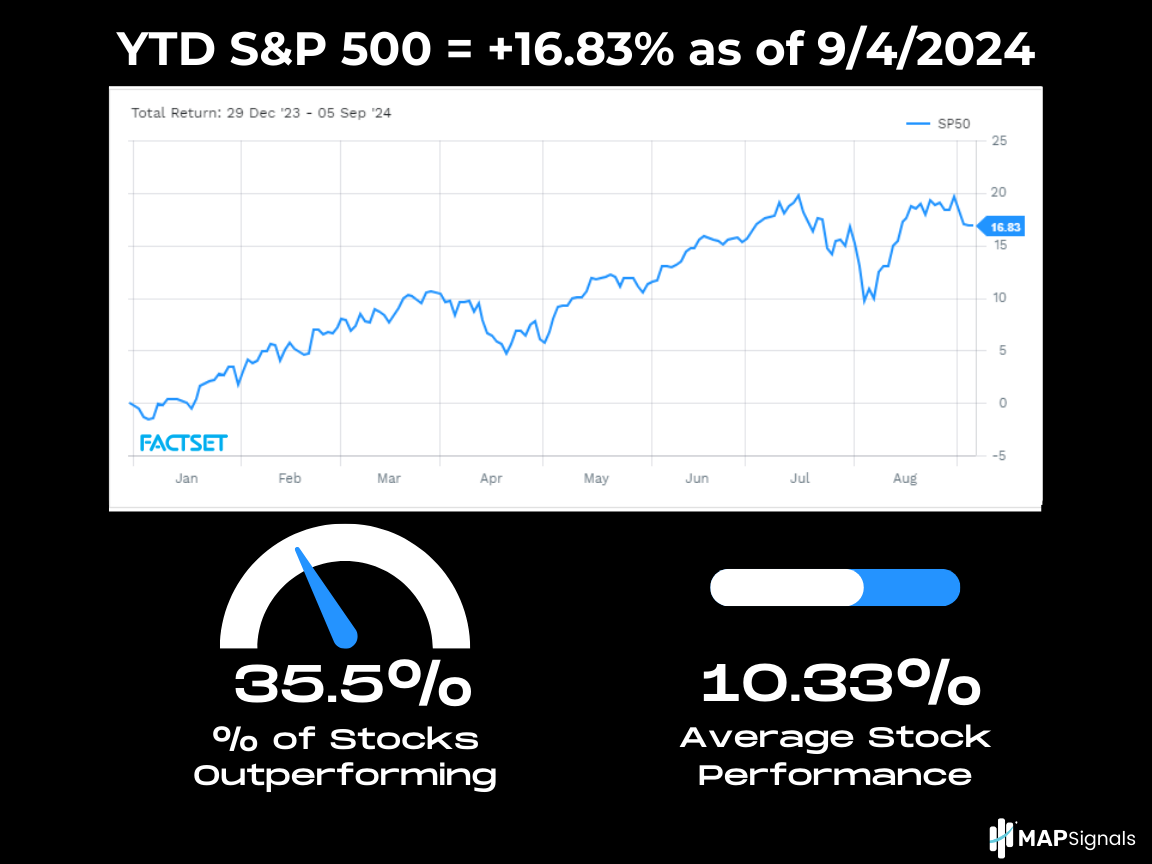
Fast forward to today and we see an S&P 500 that’s gone nowhere on the surface, still up 16.83% YTD.
Dive down below and you’ll notice the massive breadth improvements. Now over a third of stocks are outperforming the index (35.5%) and the average stock has doubled its YTD gain to 10.33%!
This is exciting, healthy action, folks! If your analysis solely focuses on Magnificent 7 names, you’re missing a huge money-making wave of opportunity.
Let’s now put on our Big Money lens and plot out some money flow!
Since the June CPI print on July 11th, Real Estate stocks have been the most risk-on group with constant buying:
This dividend theme is also seen in Utilities stocks. Since the June CPI effectively murdered the runaway inflation narrative, Utes have been heavily under accumulation:
Financials are also part of this trade:
And Consumer Staples, too. This group is broad, but the steady-eddy names your grandparents know and love are beaming with inflows:
And finally, there’s ultra high-quality healthcare dividend stalwarts surging in this new thirst for dividend income:
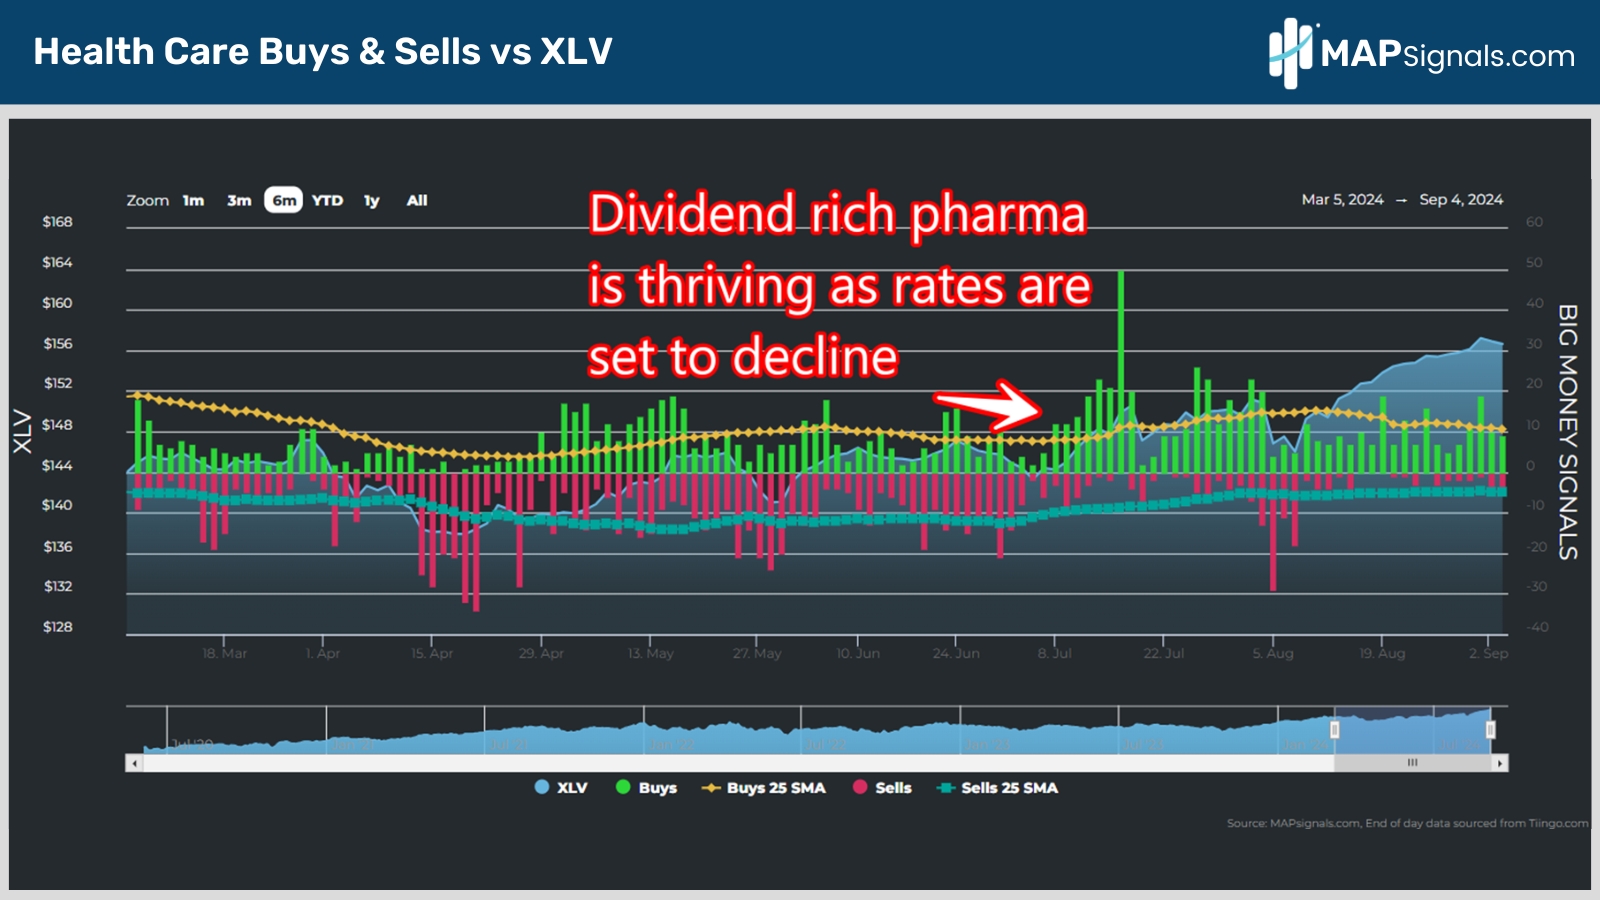
Even with a flatlined S&P 500, there’s humongous opportunity when you follow the money flow map.
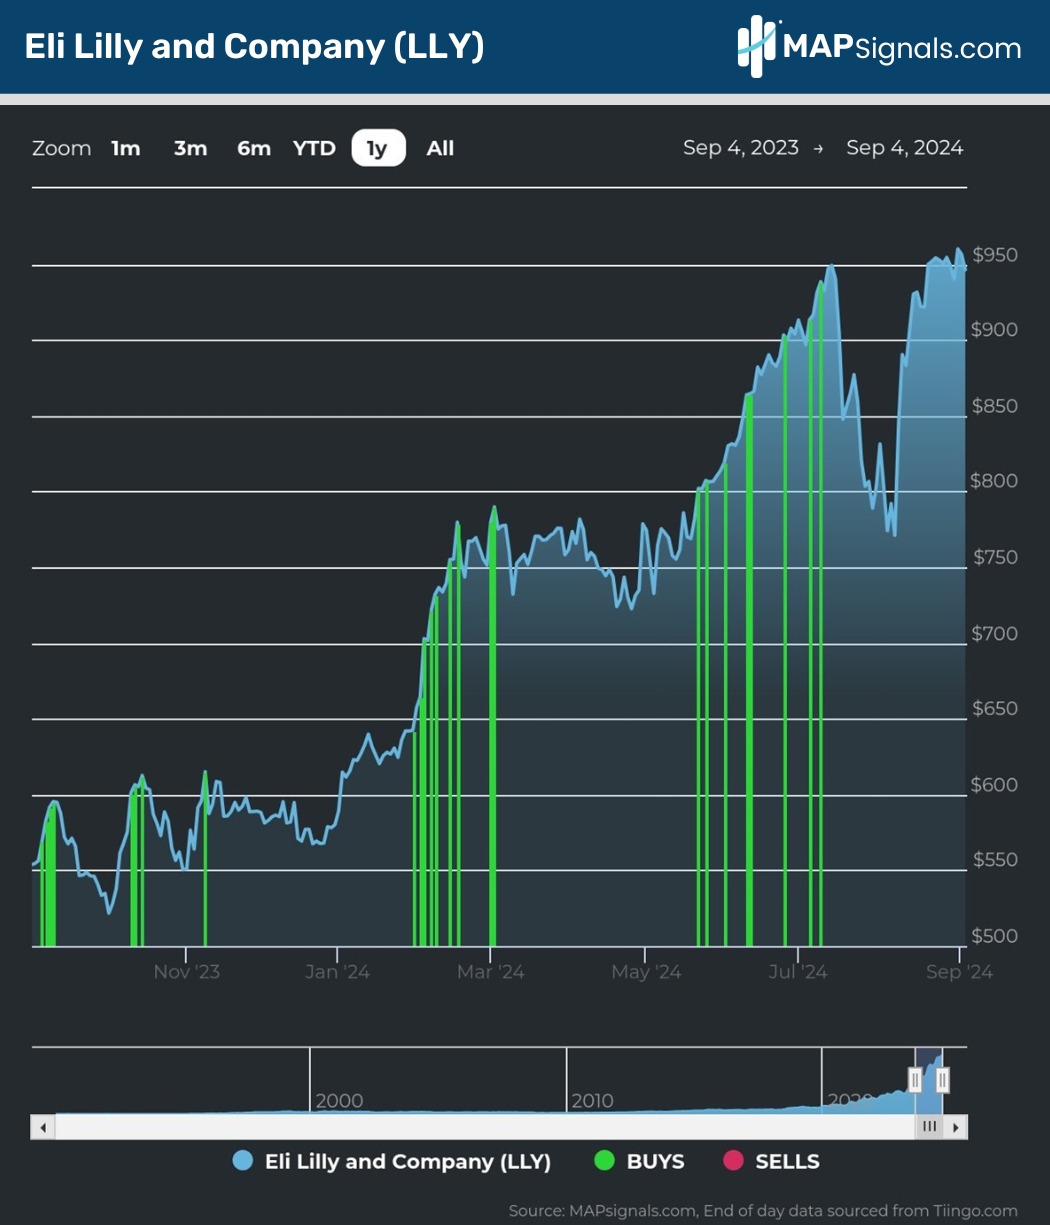
Let’s look at one powerhouse dividend growth name we’ve been all over for years: Eli Lilly (LLY).
Keep in mind those green bars in the charts above are single equities under heavy institutional sponsorship. Here’s a 1-year chart of LLY with our inflow lens. Notice how this stock has been a one-way train heading NORTH:
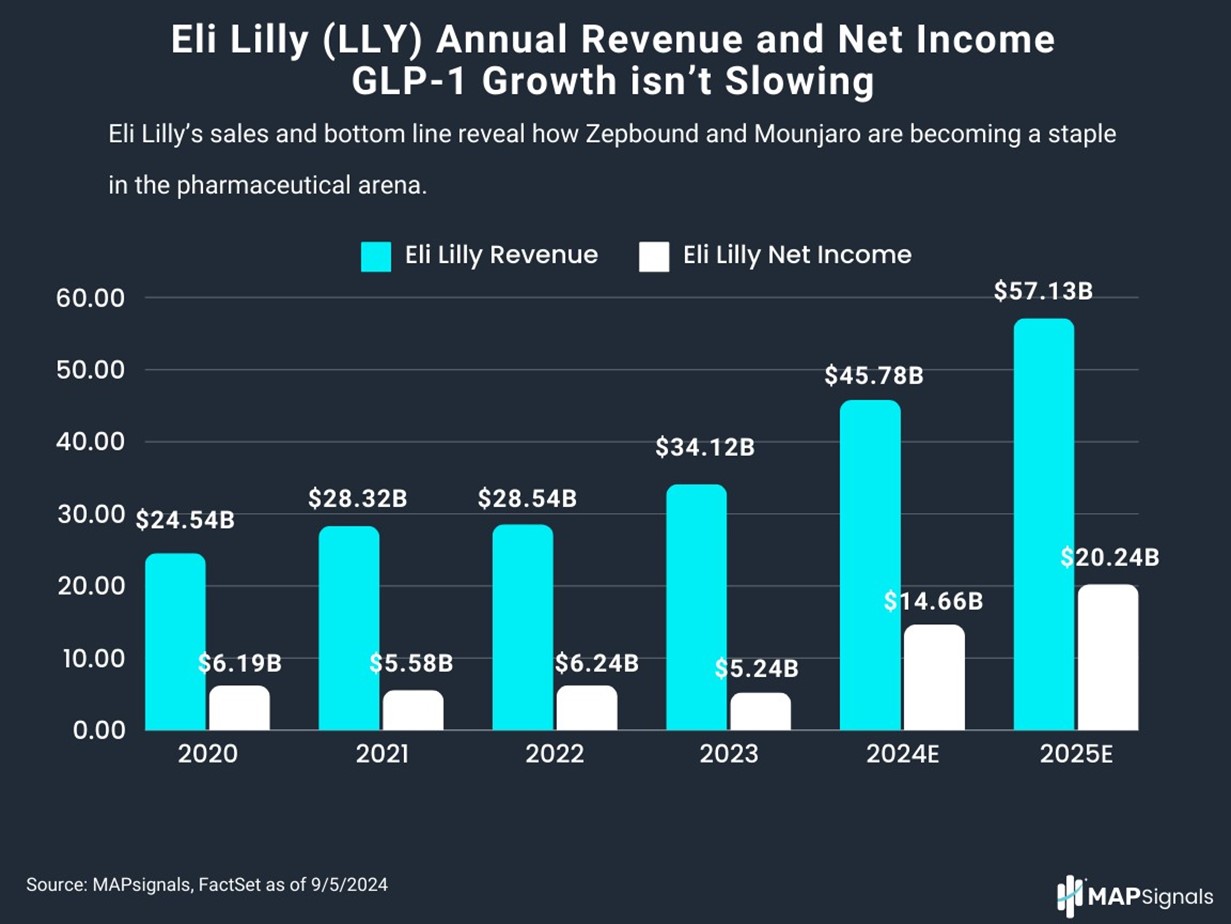
And our analysis only begins at the money flow level. We also dive into the fundamental picture, too.
When you realize how revenues have climbed from $24.54 billion in 2020 and are set to eclipse $57 billion in 2025… and more importantly the net income picture which stood at $6.2 billion in 2020 and is now projected to soar to $20.24 billion in 2025 – we can understand how healthy the business has become:
With numbers like this, dividends are sure to follow. And they have!
Below details the annual dividend payments for Eli Lilly. In 2018 the payout stood at $2.25 per share and is likely to reach $5.20 in 2024.
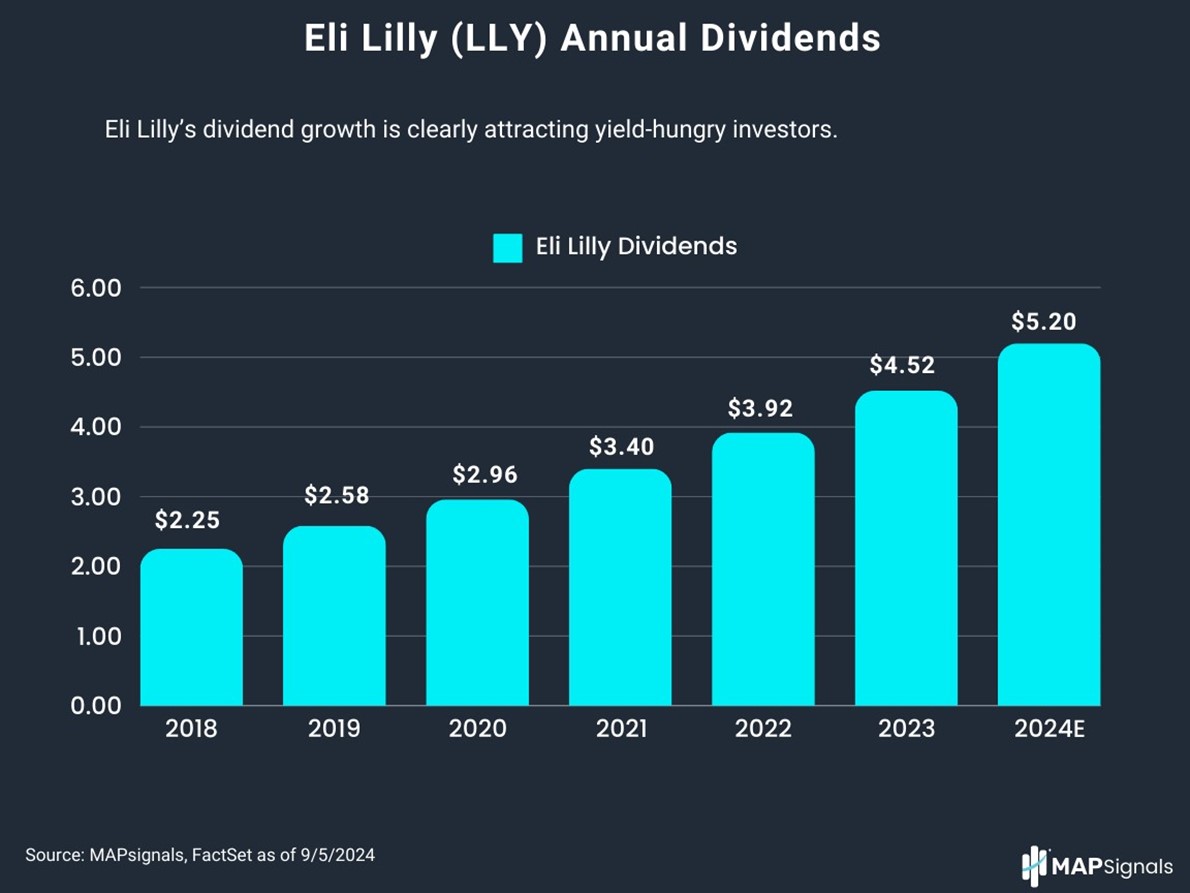
Dividend growth is beautiful!
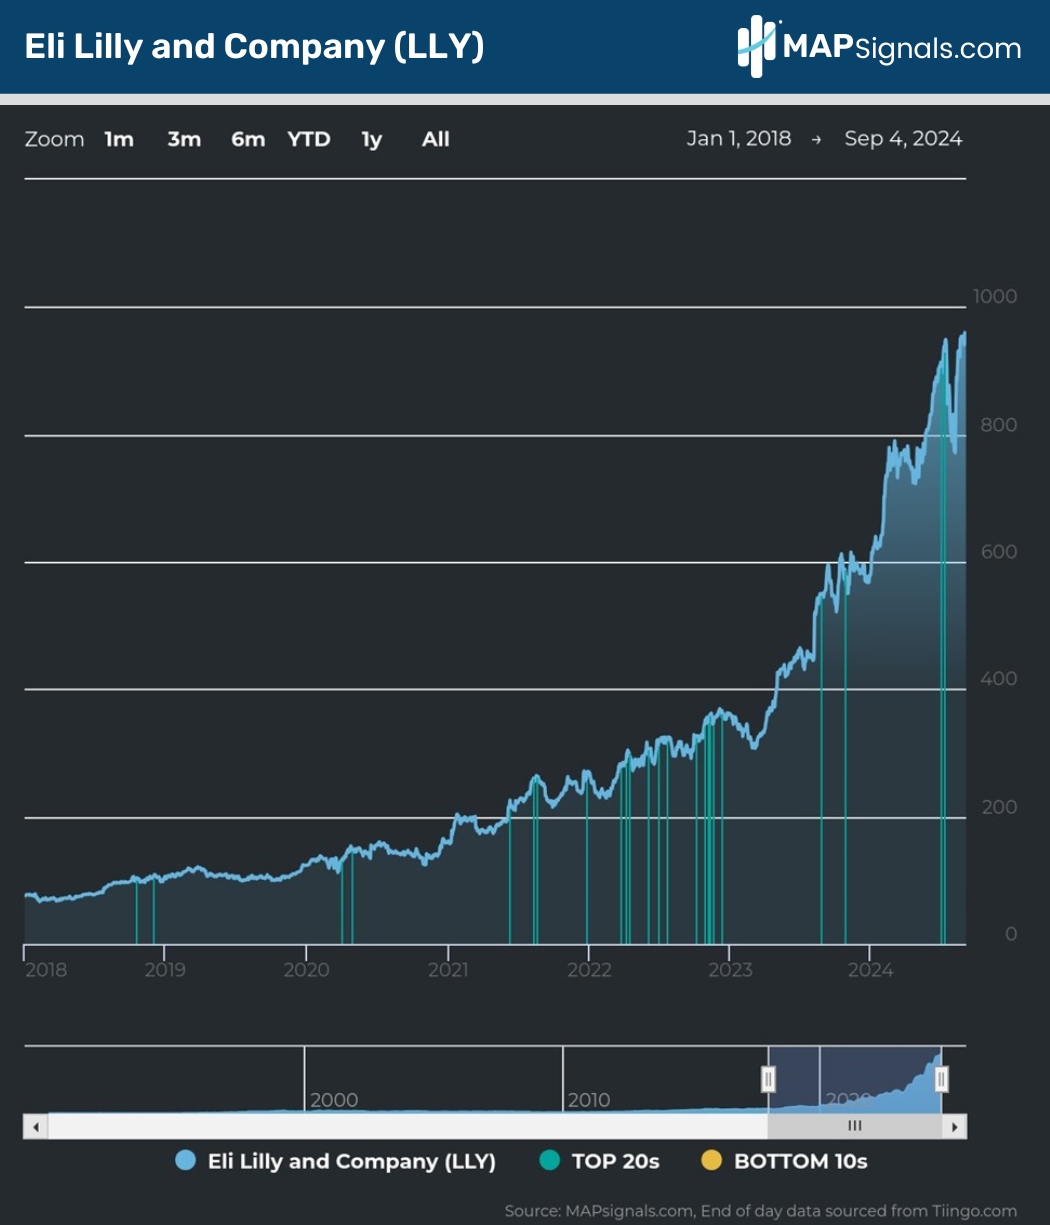
Let’s showcase one final chart. At MAPsignals, we are all about finding outlier stocks: incredible businesses loved by institutional investors.
Each week, we showcase our Top 20 highest quality stocks we believe savvy investors are accumulating.
The more instances that a stock appears on this rare list, the better. Here’s LLY’s chart since 2018 overlaid with each Top 20 signal on our weekly report.
That’s the power of tracking the money flow map:
Ladies and gentlemen, there’s a monumental money shift into dividend growth stocks.
Eli Lilly is the posterchild of this stance. It’s been one of our recurring picks for years…and for good reason. Profits and dividends have been exploding.
Don’t let the media tell you stocks have gone nowhere in the last 2 months.
Now you know the truth!
Follow the money!
Here’s the bottom line: The rotation that kicked off with small-caps and mega-cap tech is spreading into yielding equities.
Real Estate, Utilities, Health Care, Staples, and Financials are in full-on bull market mode.
As interest rates are set to dump, these income plays jump.
But don’t focus on the highest paying names…focus on dividend growth and superior businesses.
If you’re trying to make heads or tails of market gyrations, now’s a great time to upgrade your research with MAPsignals PRO subscription.
There’s a rebirth under the surface…
You just need a MAP to see it.