
One Bullish Omen for the NASDAQ Just Fired
Stock investing is simple.
Just hold great companies.
But it can get simpler when broad indices find a tailwind.
That’s the situation today. One bullish omen for the NASDAQ just fired.
Data has a way of cutting through the non-stop noise. As institutions buy and sell there are repeatable patterns that offer clues as to what’s ahead.
Just yesterday, we saw the most stock selling since the October lows. Risk-off was widespread.
On the surface, this new information could suggest trouble is ahead for markets.
But we don’t see it that way. Turns out, one bigger theme occurring over the past few weeks, suggests this near-term dip is about to turn into a rip… that you’ll want to buy.
Before we get into that powerful study, let’s put on our Big Money goggles and review the money flow landscape.
Institutions Dump the Most Stocks in 2024
If your portfolio is sagging lately, you’re not alone. While markets trade near all-time highs, plenty of single names are getting trimmed.
You can see this with the latest downtick in the Big Money Index (BMI). As a reminder, if the BMI’s climb is stalled, there’s distribution under-the-surface.
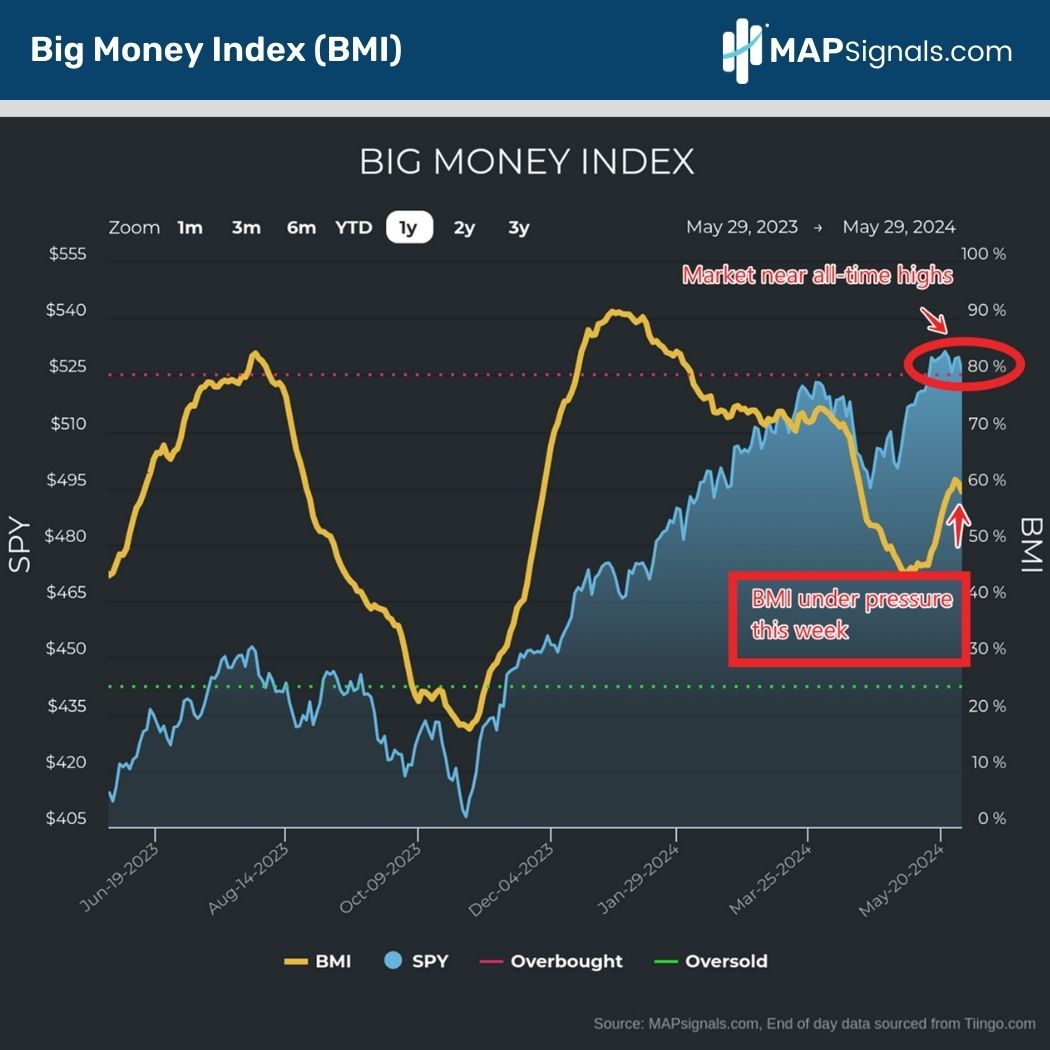
Why this is important is because yesterday revealed the most institutional selling since the October 27th low.
Yesterday’s modest decline actually was a decent sell day in our data. There were 135 discrete equities that were sold, the highest level in 7 months.
Below tallies the daily buy and sell signals on thousands of stocks. Notice the large red bar off to the right.
That’s clearly risk-off action:
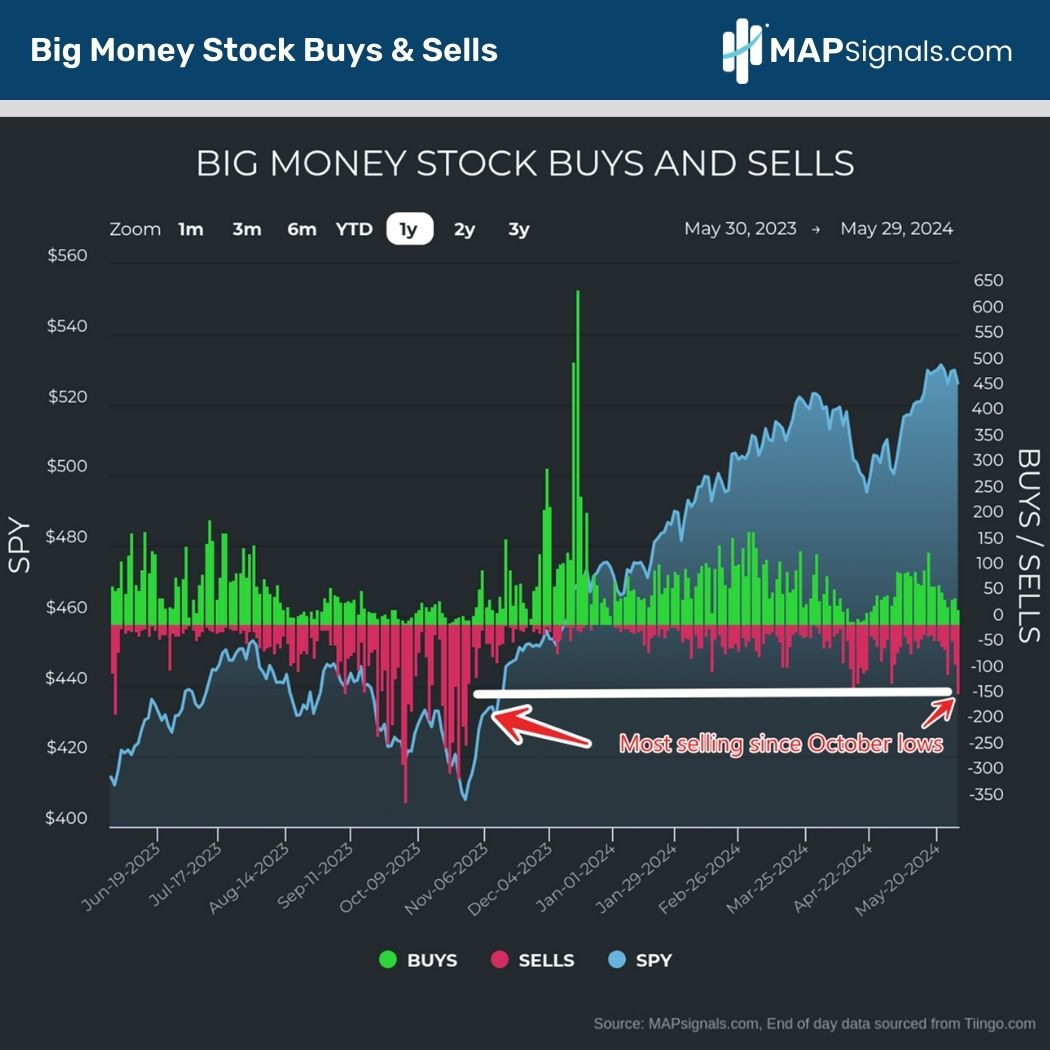
The million-dollar question is which stocks are getting sold? It’s actually a mixed bag of healthcare, discretionary, industrial, and technology names, mostly small-caps.
The tiny amount of green, or equities getting bought, are mega-cap technology names with a high index weighting.
This is mission critical because these global heavyweights have been responsible for kickstarting the monster rally back in October.
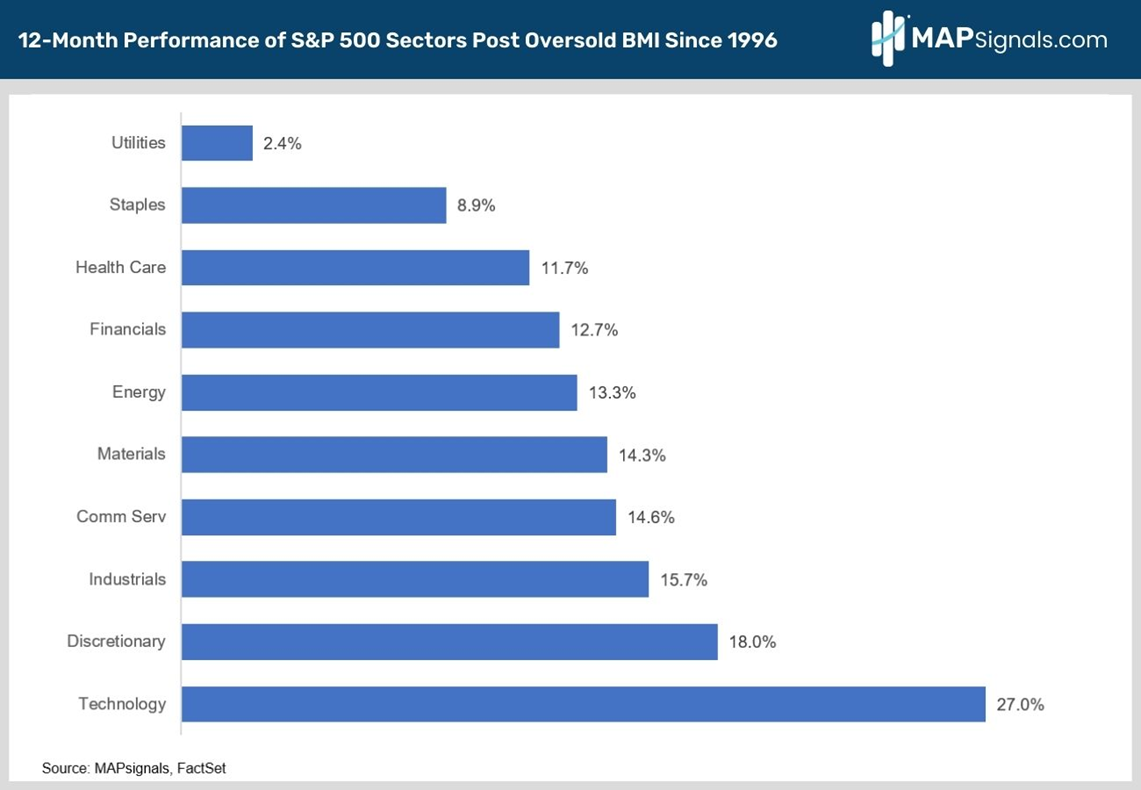
If you recall back in early November, we told you how Technology was set to explode in 2024. After an oversold BMI, the technology sector in particular averages a gain of 27% twelve months later.
Here’s the graphic from that piece. Tech didn’t disappoint given it’s rallied 36% since our rare oversold signal hit on October 6th:
Data really is beautiful!
But here’s the great news. This rally in tech is far from over because one bullish omen for the NASDAQ just fired.
You just need a map to see the opportunity.
One Bullish Omen for the NASDAQ Just Fired
Don’t leave investing to chance. There’s a rhythm in money flows.
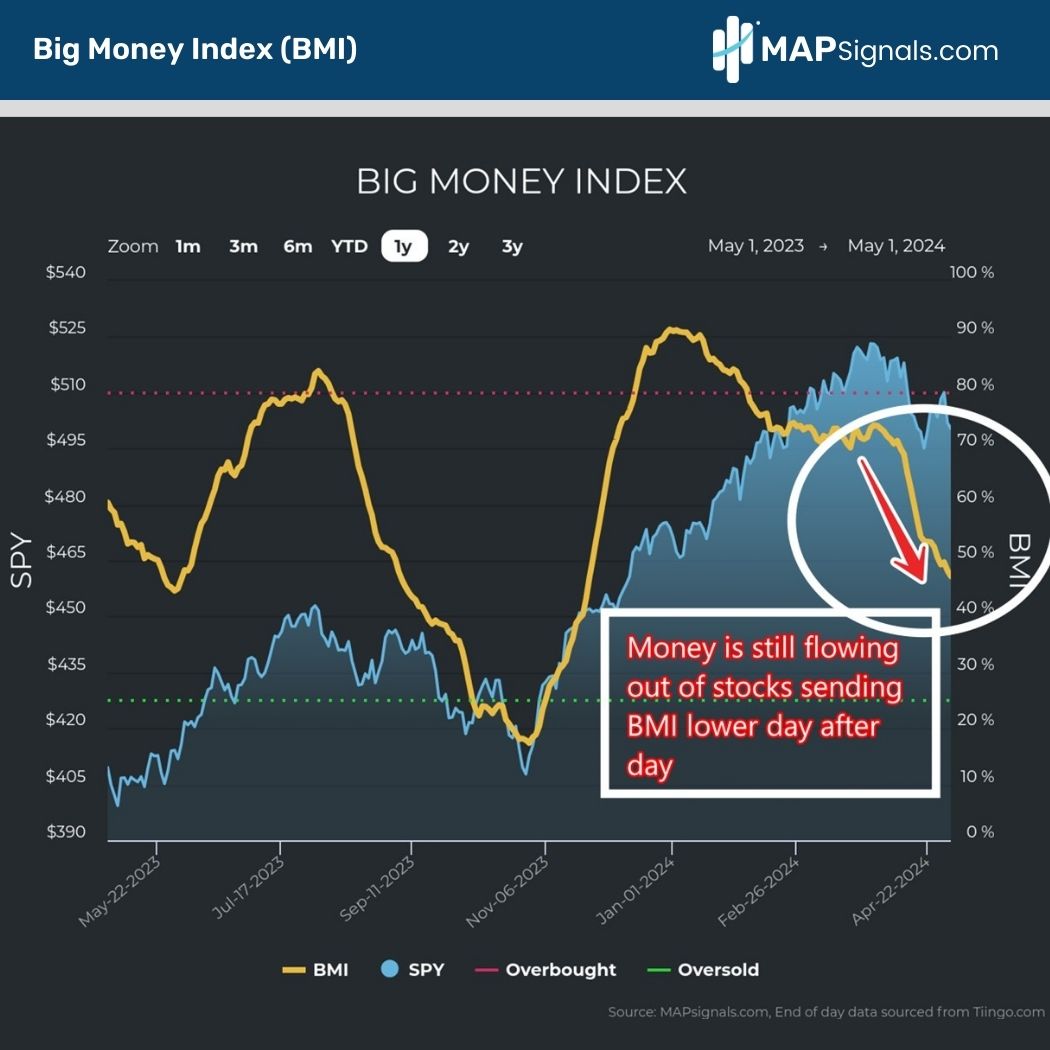
The last couple of months saw a rapid decline in the Big Money Index (BMI). Long-term subscribers of MAPsignals know that we get more bullish as prices fall.
The old adage of buying low and selling high is paramount if you want to be a successful investor. We happen to use our trusty BMI as our guiding light.
Just a few weeks ago our data signaled how a major ultra-bullish signal is approaching. Effectively, when the BMI is in free-fall, it spells big gains ahead.
Back then we isolated all instances when the BMI fell 40 points in a 4-month timespan, similar action to what we saw in April. Here’s a review of what that looks like in practice.
We published this exact chart on May 2nd. An epic rapid decline in the BMI historically has been a great time to buy stocks:
You can review the study by clicking the link above. However, today we’re going to add to it.
Last week we noticed how the spiral in the BMI actually did something quite remarkable. It fell for 10 consecutive days.
Over the past decade since 2014, that’s only happened 188 times. A handful of memorable occurrences were in late 2014, early 2016, late 2018, the pandemic, and the bear market of 2022.
Ladies and gentlemen, these 10-day declines are some of the most bullish signals you’ll find. When I say one bullish omen for the NASDAQ just fired, you’ll agree after this chart!
When we singled out all days when the prior 10 days saw the BMI fall consecutively, large caps surged.
For comparison I included both the NASDAQ 100 and the S&P 500 forward performance post these rare events.
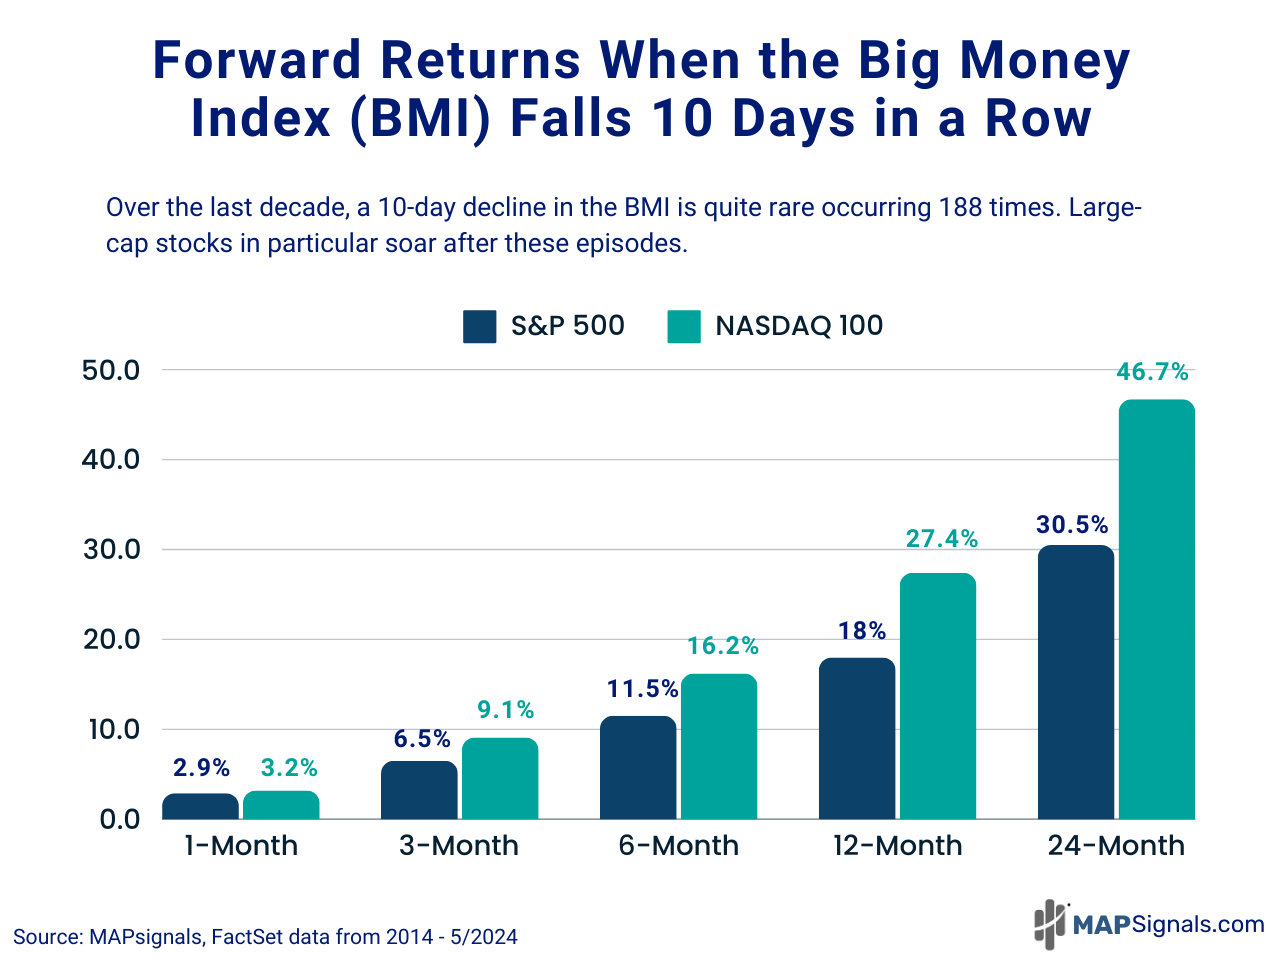
When the BMI falls 10 days consecutively:
- 3-months later the S&P 500 jumps 6.5% and the NASDAQ vaults 9.1%
- 12-months later SPX climbs 18% and the tech-heavy NASDAQ rips 27.4%
- Be bold and hold for 24-months and you’re staring at 30.5% gains for the S&P and a mind-numbing 46.7% catapult for the NASDAQ
Folks, this is what a tailwind looks like in data.
If history is any guide, the current rally has plenty more upside.
We took our cues to buy stocks back in October based on evidence-rich insights. We’ll be following that playbook again.
Knowing which specific equities to zero in on is paramount.
Let a map show you the path!
Here’s the bottom line: There’s notable selling in our data. In fact, yesterday saw the most stock selling since the market bottom in October.
That’s not the overwhelming signal to focus on.
The bigger story is what happened last month. The BMI fell 10 consecutive days, which has only occurred 188 times the last decade.
Turns out, it’s a long-term signal to buy large-cap stocks. Amazingly, the tech-heavy NASDAQ 100 soars 27% twelve months later.
Even more incredible, the NASDAQ rips an average of 46% twenty-four months post this signal!
Don’t miss the opportunity in front of you.
Investing in great companies is how you win over the long-run.
Investing alongside a massive tailwind makes it that much more enjoyable!
If you’re a serious investor, money manager, or investment advisor, let MAPsignals take your equity research to the next level. Get started with a MAP PRO subscription and see the top-ranked equities under massive institutional accumulation.
That’s how you win!