
Rare Signal Points to Big Upside for Energy Stocks
The summertime blues are here. Right on cue, markets are taking a much-needed breather.
While that typically elicits unhappy emotions, it’s not all doom and gloom.
One rare signal points to big upside for energy stocks.
Let’s rewind. Just 2 short weeks ago, I told you to prepare for a summertime pullback. The stage was set: An overbought Big Money Index (BMI) coupled with August and September seasonal weakness was the perfect bear-infused-cocktail.
Plenty of equities have stalled lately. Month-to-date, the S&P 500 has fallen 2.36%, while the Tech-heavy NASDAQ 100 has fallen 3.91%. Under-the-surface there’s even more destruction going on with growth stocks.
While that’s painting a negative picture, this healthy selloff is giving way to a powerful rotation. Money is flowing out of popular high-flying growth stocks and surging into select Oil & Gas names.
One data-point suggests the latest Energy surge is set for upside…a lot more upside.
As usual, let’s take a stroll through the Big Money landscape. There’s a lot going on.
Overall Money flows Point to Further Market Weakness
There’s a power law in the stock market: Supply and Demand. Understanding this tug-of-war will keep you ahead of the market’s next move.
The Big Money Index (BMI) is a real-time barometer for institutional appetite. Recently we pierced into the overbought red-zone. Over the past year, that’s prefaced a healthy pullback.
Last week marked the 3rd time the market’s red light flashed:
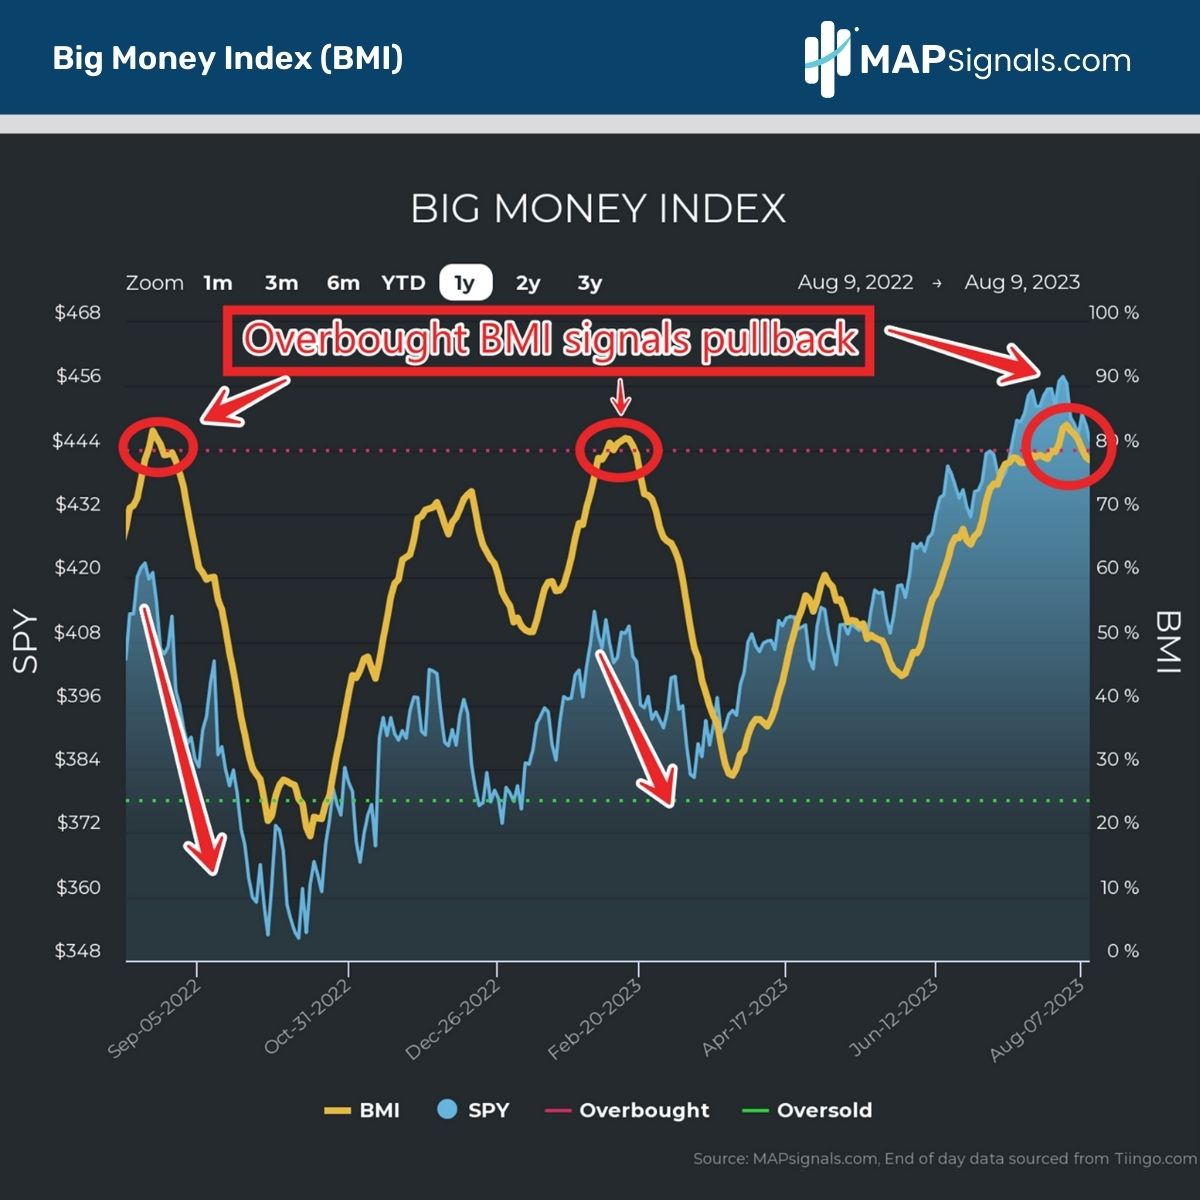
A falling BMI indicates buying demand is waning and selling is increasing. Generally speaking, this is risk-off action. But we need to dive deeper to see what’s really taking shape.
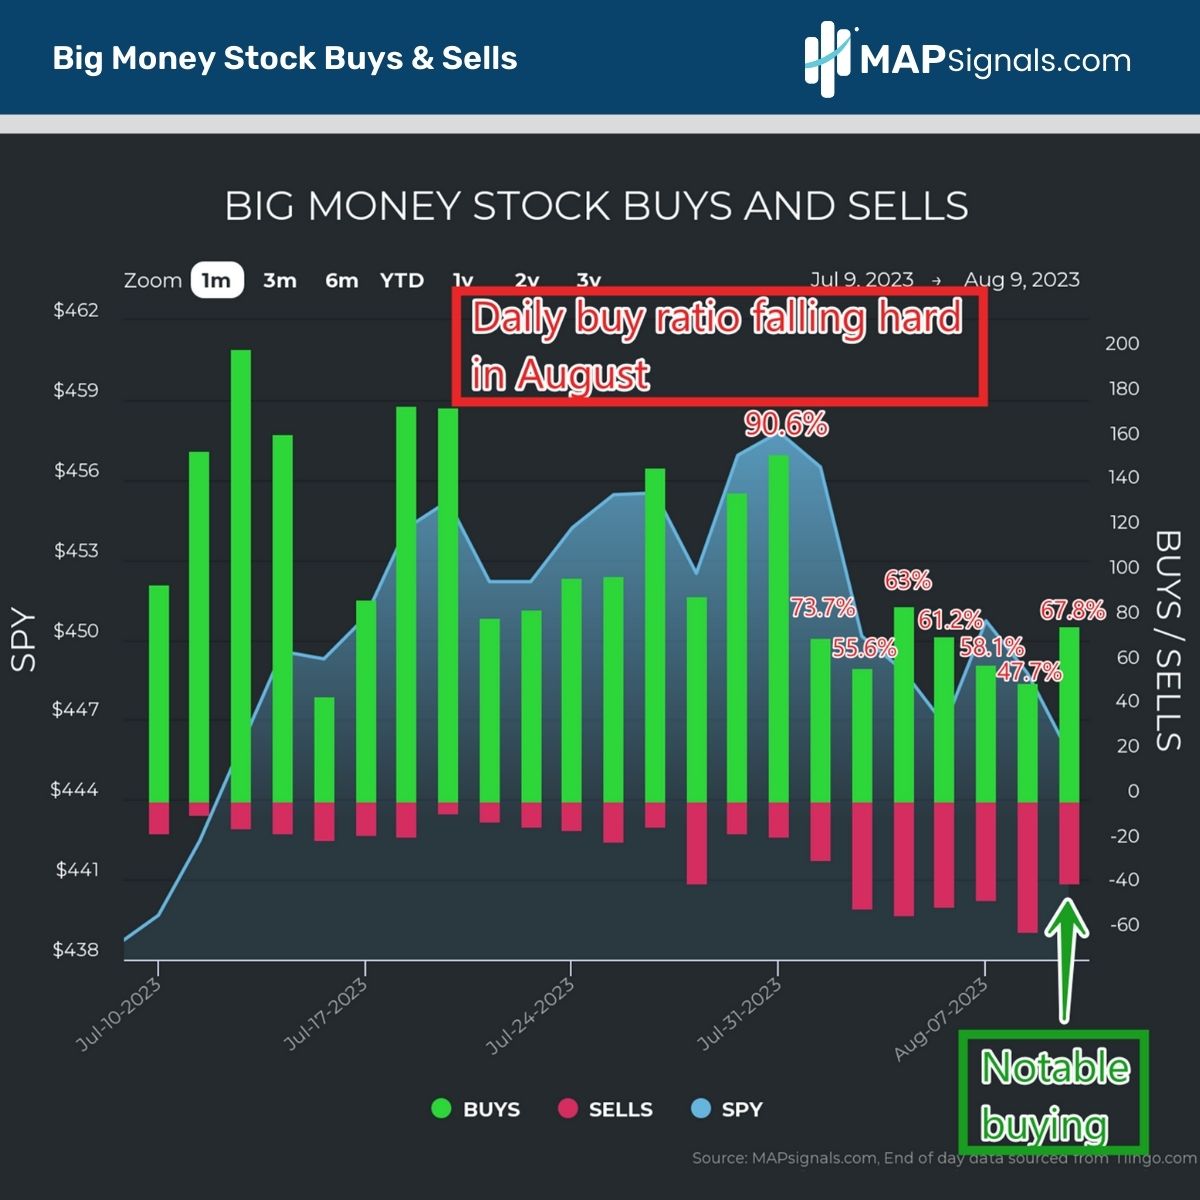
Below plots the daily buys and sells of stocks, which make up the BMI.
Notice 2 things:
- First, market breadth has fallen hard recently. July 31st saw a 90.6% buy day and since then selling has increased, dragging on the ratio.
- Second and more important, yesterday saw a 67.8% buy day, in the face of a weak market. There were 78 stocks bought and 37 sold, indicating an area was under accumulation:
This is where it gets super interesting. There’s a rotation occurring inside of the pullback.
Rare Signal Points to Big Upside for Energy Stocks
Breaking down all those green signals by sector, we see what’s going on. More than half of the stocks bought yesterday were in the Energy patch. That’s a big slice of pie:
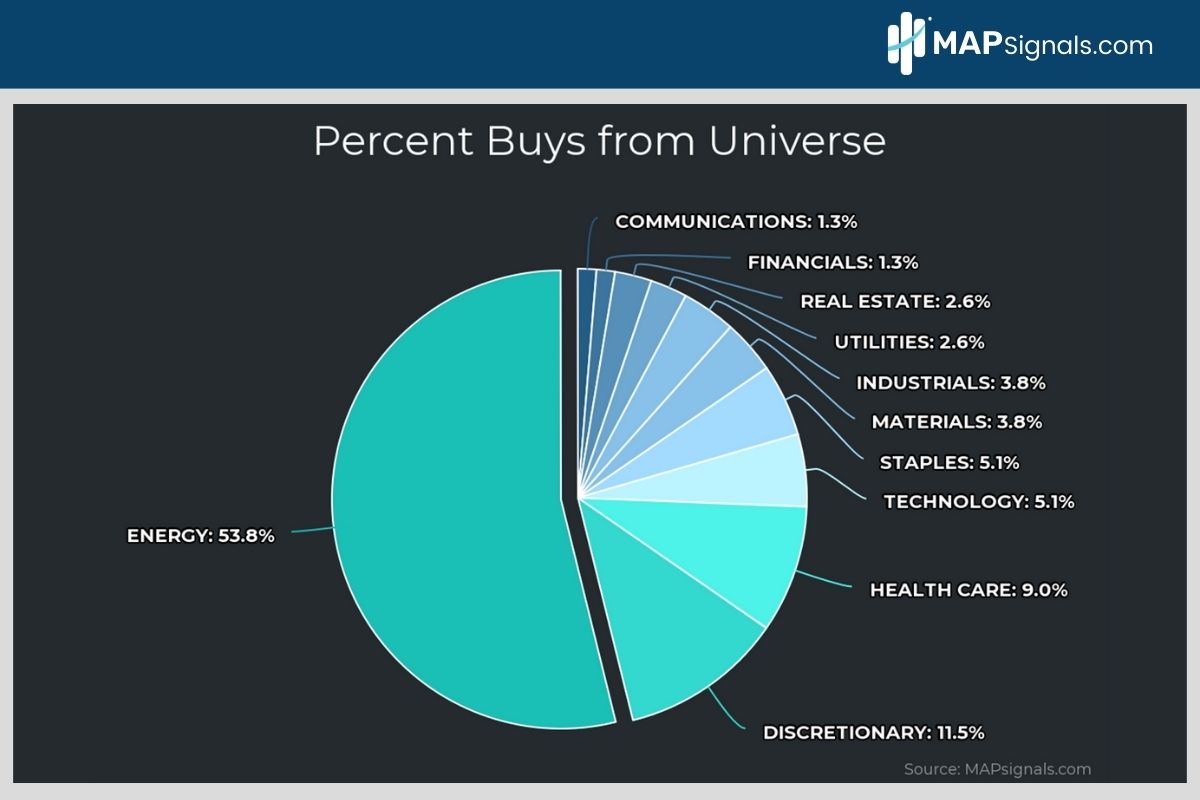
Yesterday alone saw 42 Energy companies scooped. This level of buying is scarce. To give you an idea of how uncommon this large footprint is, below plots the daily buys and sells of Energy stocks vs the Energy Select Sector SPDR Fund (XLE).
I’ve circled similar periods in the past:
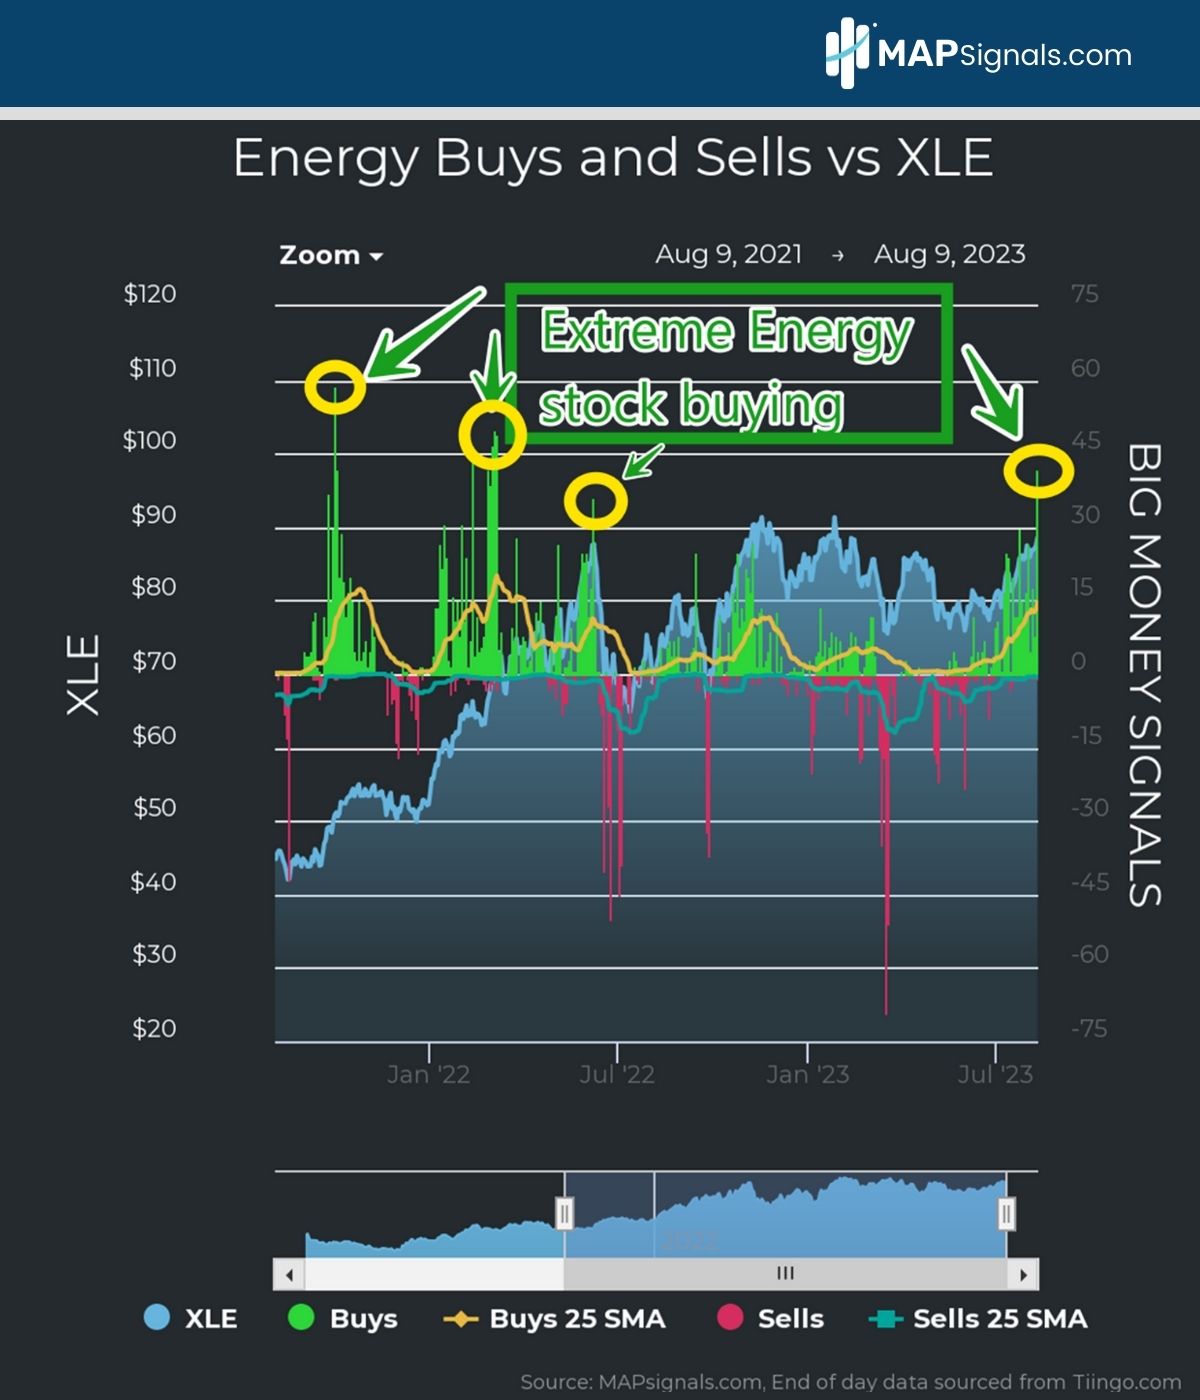
So, why am I all bulled up on the group? History says this rare signal points to big upside for Energy stocks.
If you enjoy historical studies, you’ll dig this. I isolated all days over the past 10 years where 35 or more Energy stocks were bought. That’s roughly 30%+ of the universe. It’s only occurred 32 times.
Near-term returns for the group are ho-hum with a 1-month slide of 1.4% for XLE. However, Six months later XLE gains 7.6%. Hold on for a year and the average gain is a juicy 15.8%:
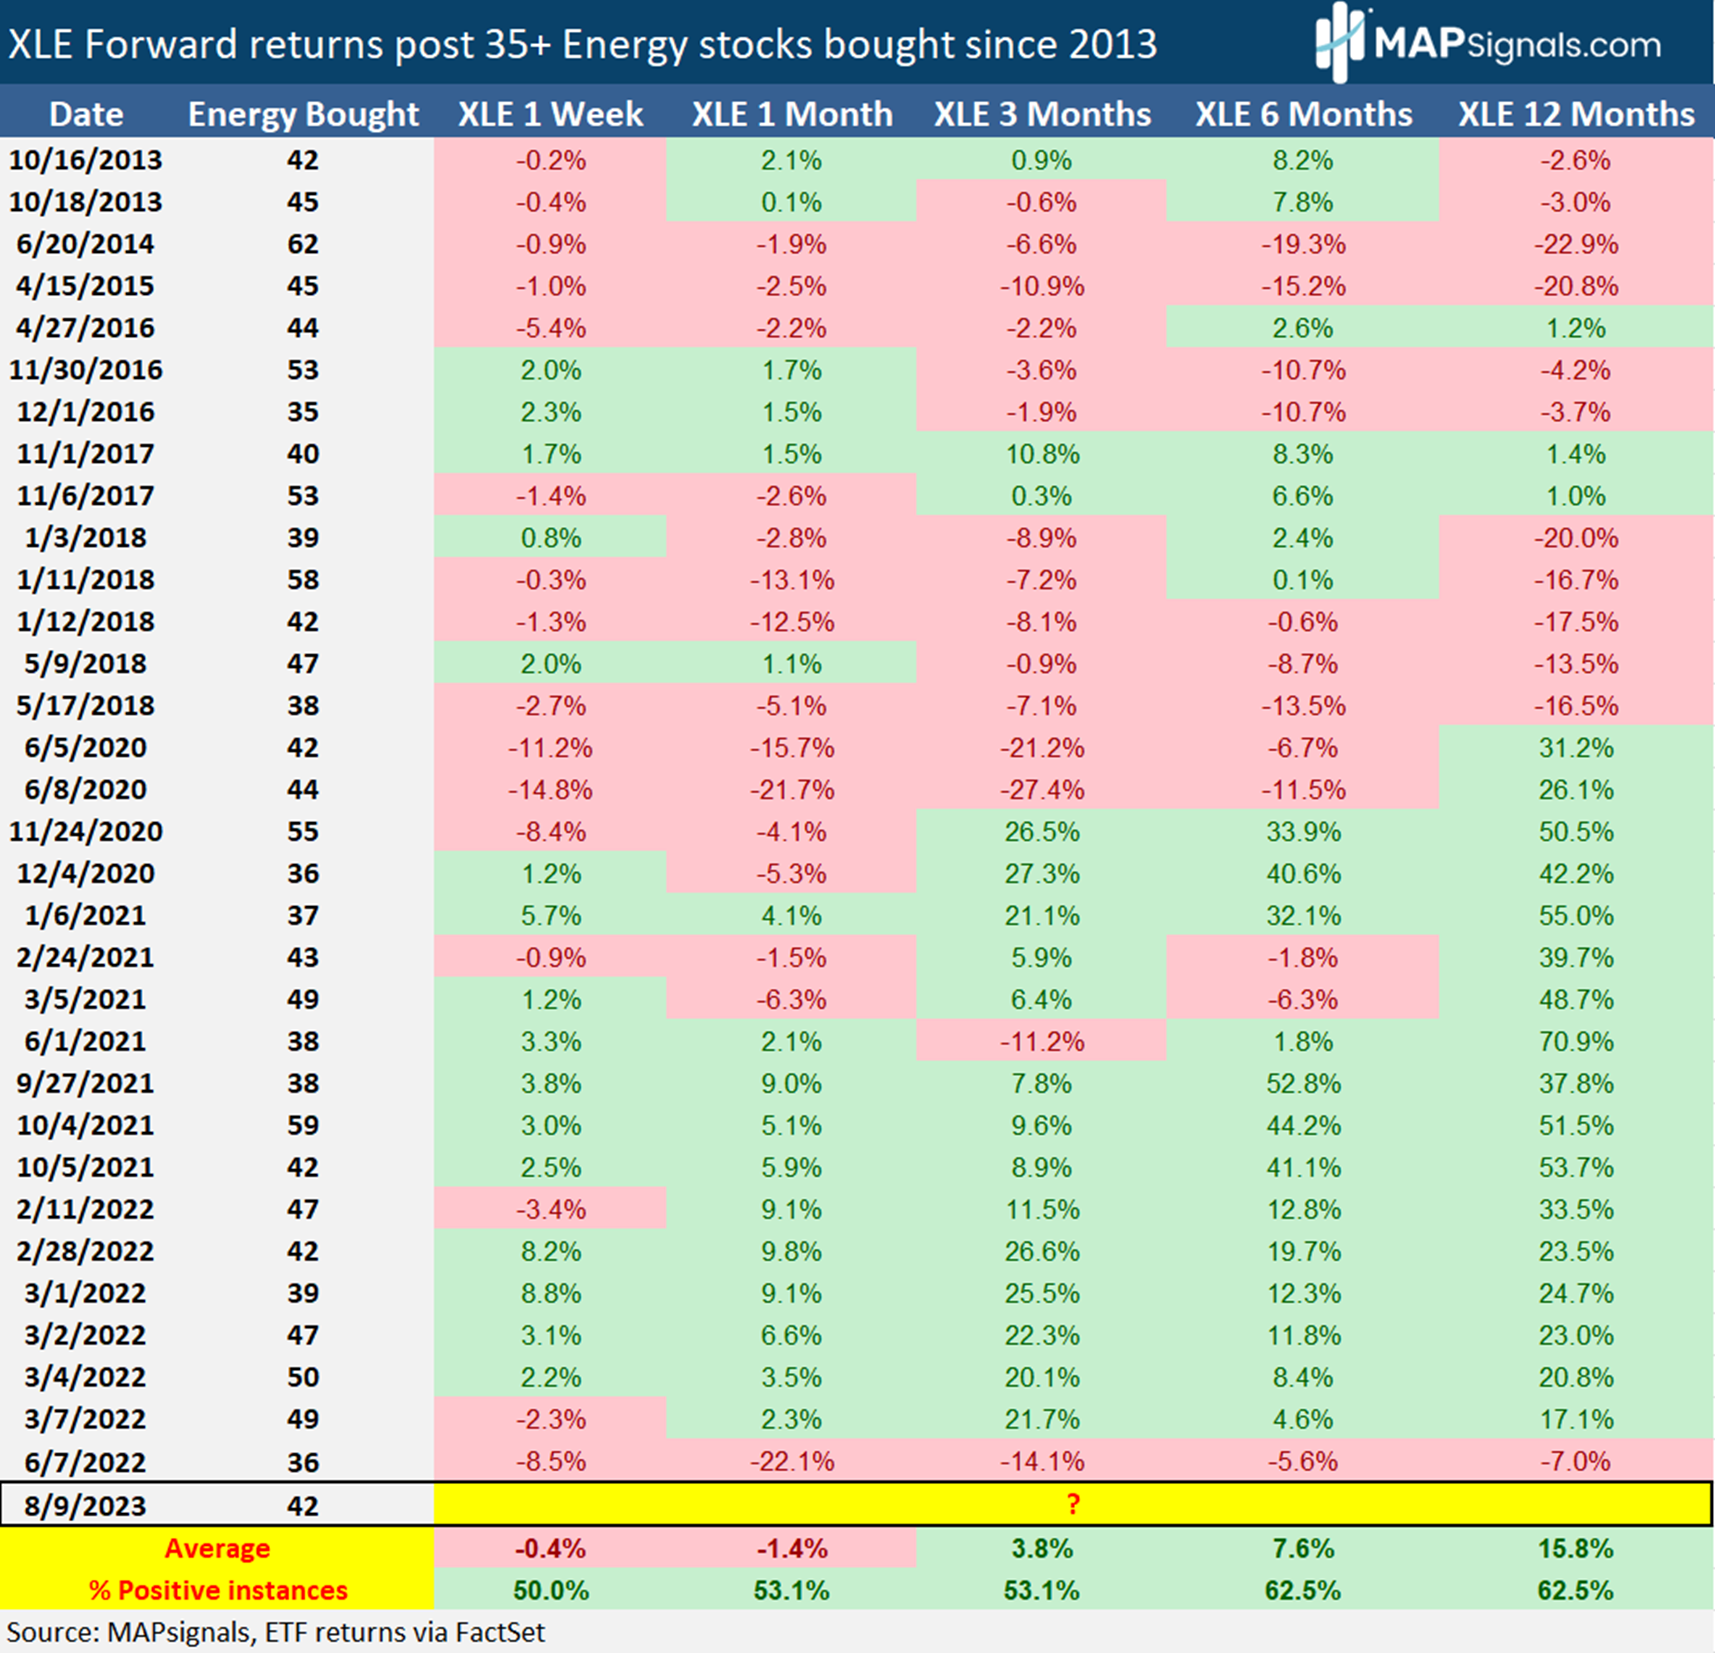
Those aren’t shabby returns, folks. If you look at these signals since 2020 (the post-COVID era), 1 year gains amount to a jaw-dropping +35.7%!
OK that’s amazing right?! But there’s more. Just this morning, Energy has now eclipsed Technology as the top-ranking sector in our data:

So, if you’re fading the Oil and Gas rally, you may want to think again.
Money isn’t leaving the market, it’s rotating. And it’s causing a shake-up in our weekly Top 20 report. Prior tech leaders are cooling off while fresh new Oil & Gas leadership takes the helm.
Let’s wrap up.
Here’s the bottom line: Expect overall market weakness in the near-term as the Big Money Index heads south. Growth-heavy sectors like Technology are taking a much-needed breather.
As I’ve said many times before, this run-of-the-mill downdraft isn’t the start of a nasty bear market. It’s merely a pause in a new bull market that began in the summer of last year.
These short-term outflows are finding their way into prior loved Oil & Gas names. We’re witnessing the most buying in the sector in over a year.
History tells us this rare signal points to big upside for Energy stocks.
If you’re a professional money manager or are serious about investing, our portal updates daily with these insights and more. Get started with a MAPsignals Pro subscription today.
Can you invest without a MAP? Sure – but I can’t recommend it!
Have a great week, everyone!