
Rate Cut 2023 Playbook
Markets are slowly shifting their focus from rate hikes to rate cuts. Investors are preparing for easier policy in the coming months.
The big question is this: When the Fed starts cutting interest rates, what happens to stocks? Is there a relationship between the two? You bet there is.
Chances are the findings will surprise you. Here’s your rate cut 2023 playbook.
Just 2 weeks ago, I noted how stocks tend to have trouble in May – October of pre-presidential election years. Thus far, May has been chop city with the S&P 500 trading flat as of today.
While a couple of weeks of market returns don’t make a trend, potential interest rate cuts around the corner could reinforce this narrative. Sell in May and go away could have some historical significance in today’s environment.
But as usual, that’s only half of the story. Today we’ll take a journey through prior rate cut regimes and see how it impacts stocks.
Whether you’ve suited up your bear suit or fall in the perma-bull camp, you’ll want to know what history says.
Let’s hop to it.
Rate Cut 2023 Playbook
Yields have been falling as inflation moderates. An example is the 2Y treasury yield which peaked above 5% in March and has fallen ever since. Well over a hundred basis points were shaved off in the following 2 months.
The latest reading sits at 4.23%. Notably, this is well below the current Fed Funds rate of 5-5.25%. Many see this benchmark as the Fed’s market signal to follow. Additionally, the latest Fed meeting telegraphed that a pause in hikes could soon be in the cards.
Smart investors have begun to price in easier policy as early as a few months from now. Below maps out the Fed Funds futures through January. Clearly future rate expectations are in a downtrend:
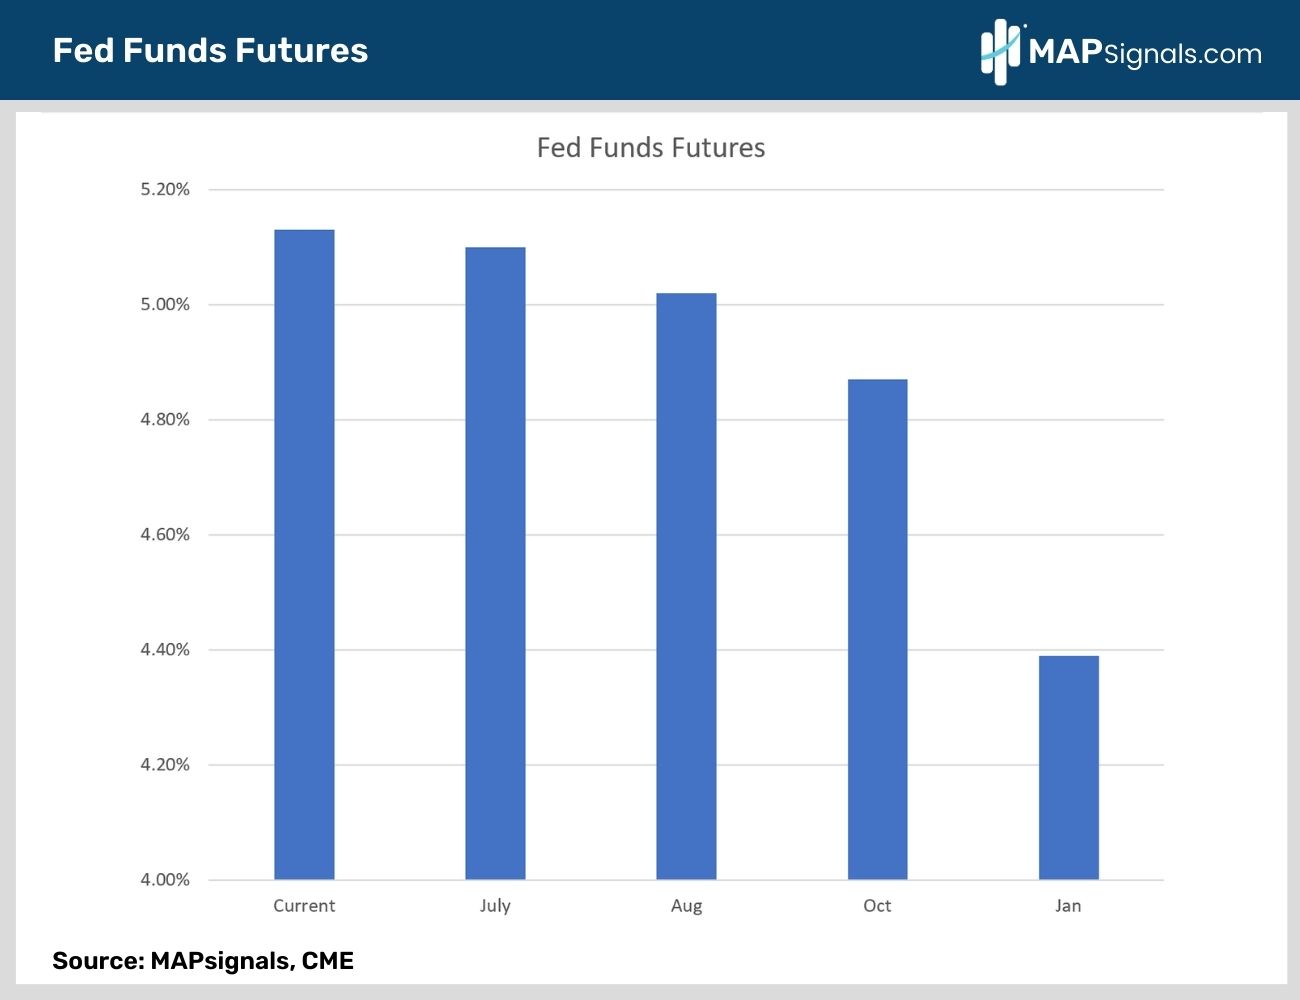
Out to January, Fed funds futures are expecting rates to drop to 4.39% from the current level of 5.13%. Cuts are now on the menu.
How do falling rates impact stocks?
First, let’s look back at prior declining rate regimes. For this historical study, I used the 3-month T-bill yield.
Back to 1981, 3-month T-bill yields have collapsed during 7 distinct periods. Below outlines those instances in yellow:

Keep in mind, a few of these cycles include major outlier recessions like the dotcom crash, the GFC of 2008, and COVID-19 of 2020.
These prior periods are where this study will focus. We’ll run through 3 calculations to get a roundtrip roadmap:
- 1) How do stocks fare 6 months prior to falling 3M T-bills yields? This is likely today’s similar environment.
- 2) How do stocks perform as those yields are falling?
- 3) What happens to stocks after yields trough?
The first study looks at the S&P 500 performance 6 months prior to a falling 3-month T-bill yield. This is where we are now given the forward interest rate cut expectations.
Based on history, stocks have struggled heading into a cutting regime. The average return for stocks sits at just +1.03%:
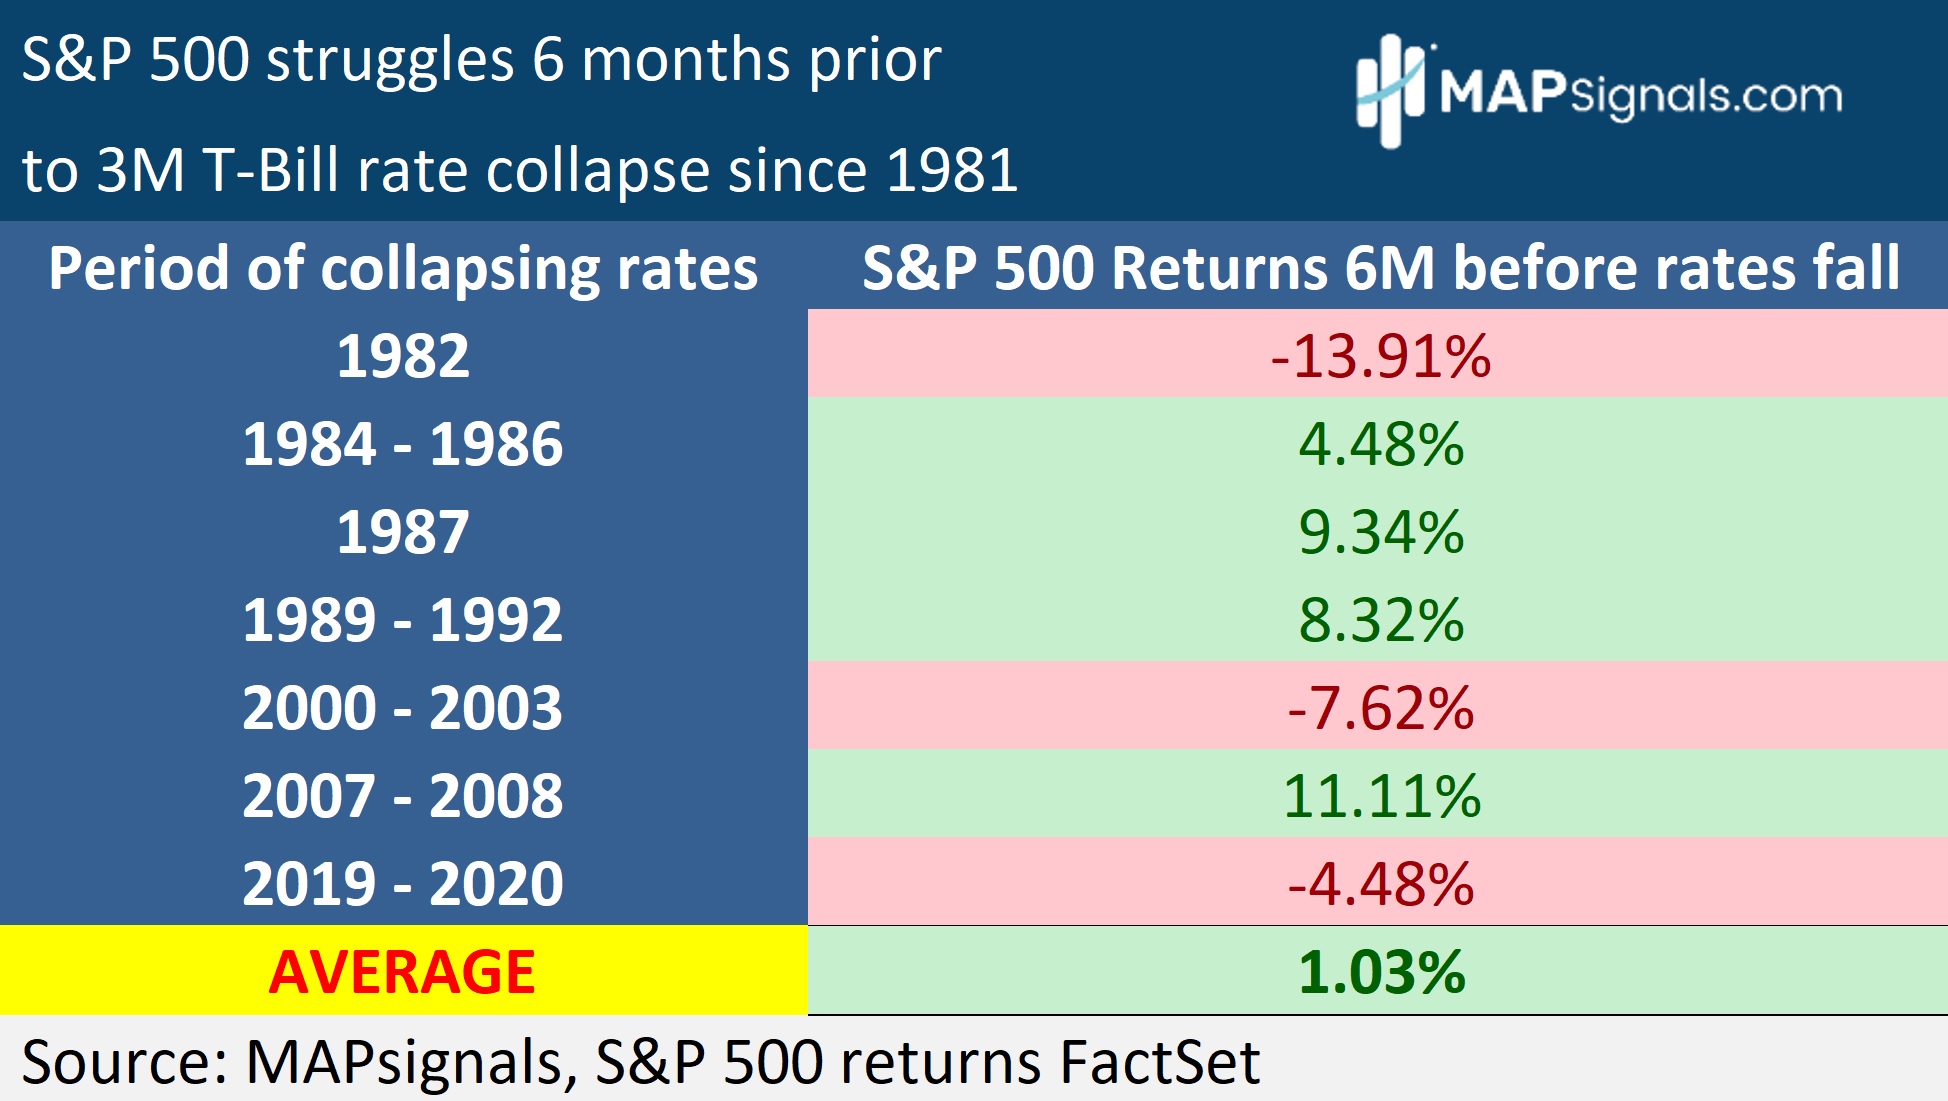
On the surface, these results don’t scream a huge sell signal to me. They suggest there’s a decent likelihood that stocks will tug and pull as we get closer to rate cuts. If history is our guiding light, these lackluster results fall in line with the sell in May period we’re in now.
But let’s keep going. What about when T-bill yields start falling?
Below plots the same 7 prior instances, but we’re measuring stock performance during the peak to trough in yields. I’ve also included the rate peak, trough, and change. Similar to study 1, the average return for stocks is muted with the S&P 500 clocking in a flattish return of -.65%:
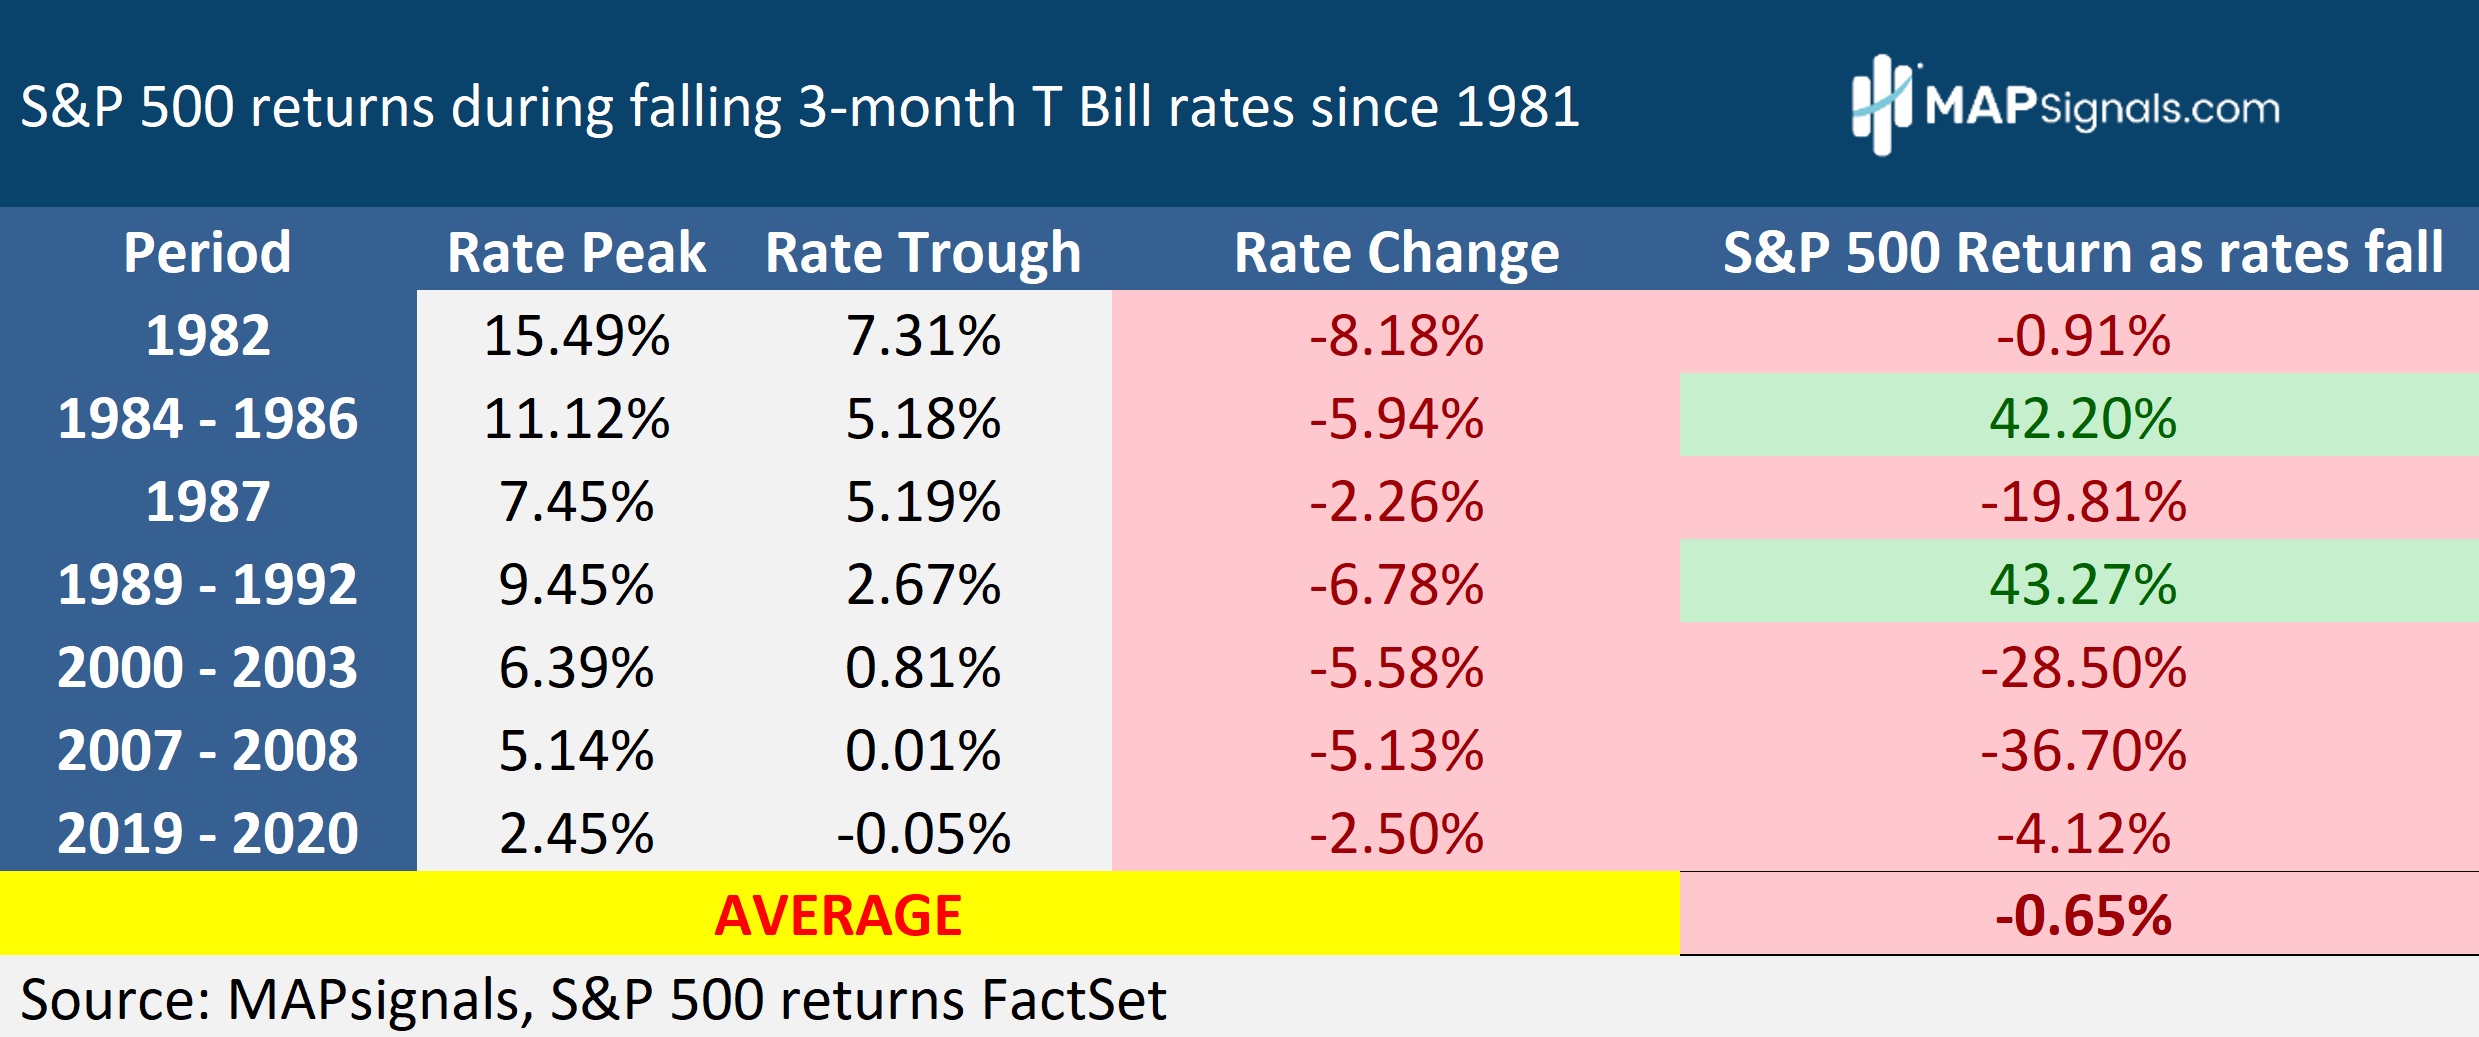
In 5 of the 7 instances, stocks were red. As a reminder, the results are heavily skewed to the 3 hard landing episodes. I personally, don’t see that as the outcome for 2023 and beyond given the healthy consumer spending and rock-solid employment picture.
Up to this point in the playbook, data implies that stocks tend to stay range-bound heading into and during rate cuts. But, don’t be sad. The following study is the most important – remove the bear suits now!
Once yields trough, stocks see a mega-rally. That’s right, once rates bottom, stocks scream higher a year later with a stunning gain of +27.18%:
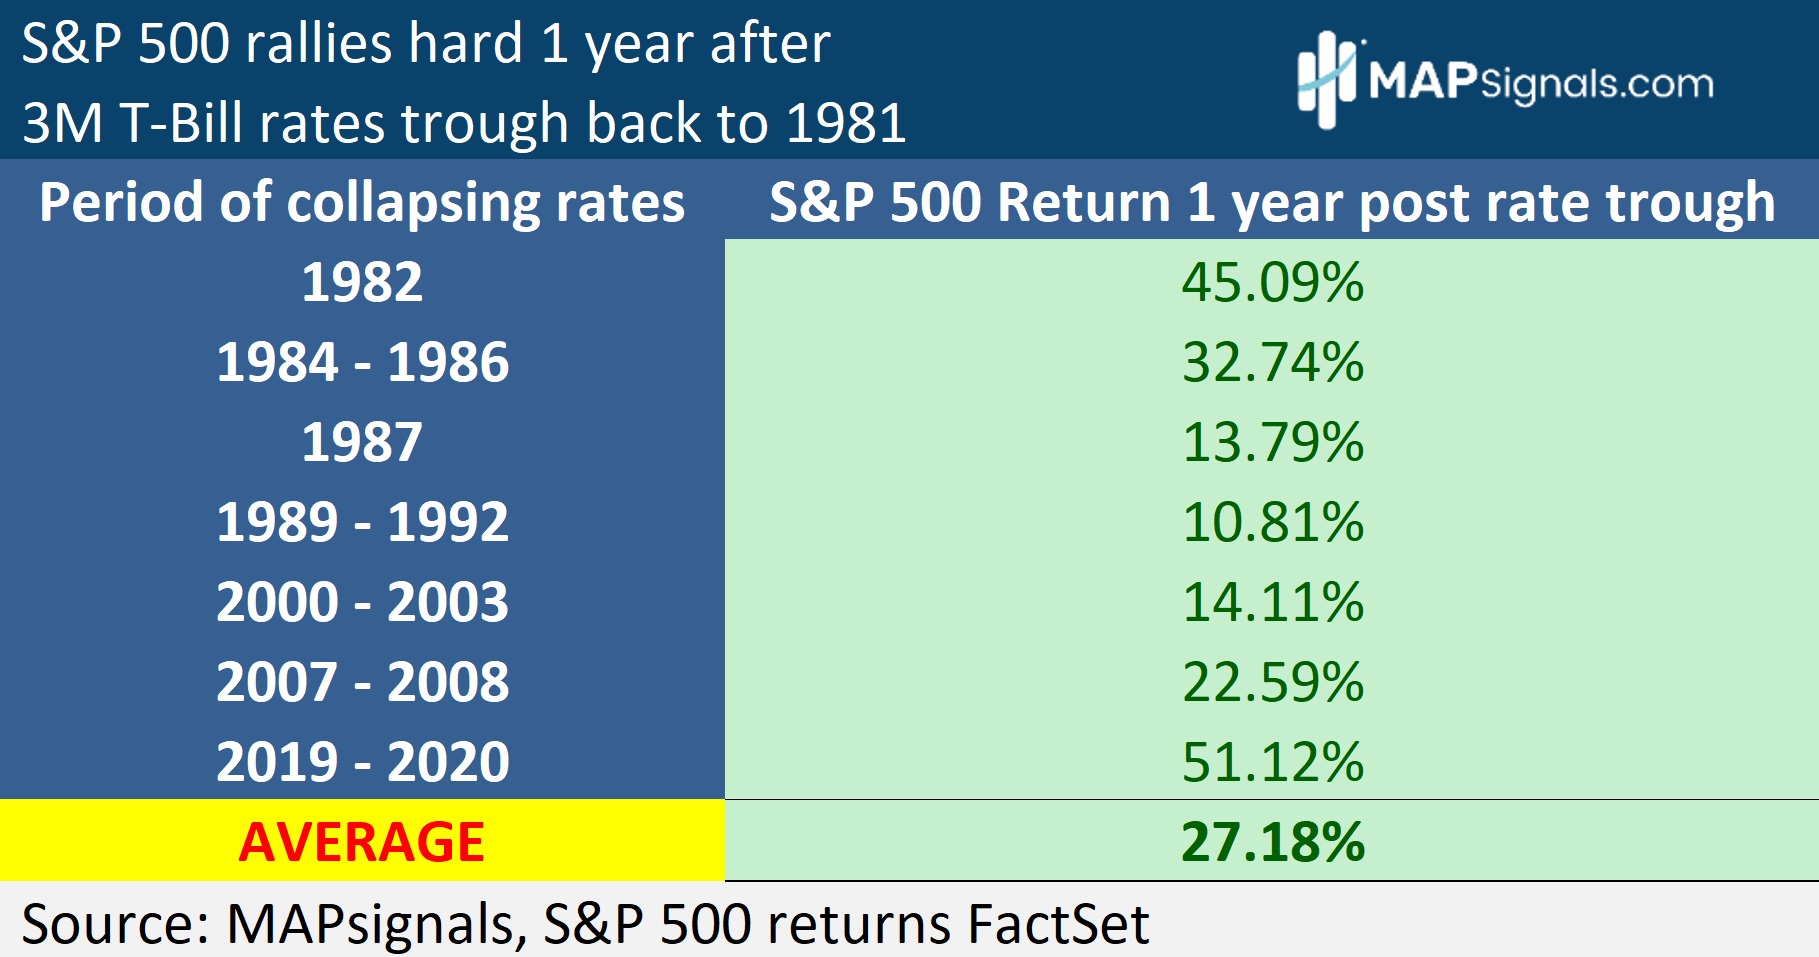
As investors, this is what you should be playing for…the coming breakneck rally. Lower rates will eventually tee up a monster tailwind for stocks. Be forward thinking.
Whether you’re in the soft landing or hard landing camp, it won’t matter. Getting too bearish is a bad bet once rates settle down. In all instances once 3M T-bill yields trough, stocks zoom double digits.
The rate cut 2023 playbook is simple. Use the potential weakness for what it is – an incredible opportunity to buy great stocks.
Have guts. Buy into the cuts!
Focus on high-quality businesses that can hold up in all environments. Don’t give up on growth stocks either. As we stated, they tend to heavily outperform when the economy sputters.
Those are the types of companies surging in our data…for good reason.
Let’s wrap up.
Here’s the bottom line: The market is betting the fed will cut rates in the coming months. Based on history, stocks can stall before and during yield-contracting cycles. That’s the bad news.
The great news is once rates trough out, stocks post monster gains of 27% a year later. Imagine how outlier stocks will perform!
Doomers ought to be careful. An epic rally is around the corner.
Are you ready for it?
I am!
Follow the Big Money and get going with a MAPsignals subscription today!