Riding The Bull Market
Growing up in the South, I have fond memories of the rodeo.
From the stands, everything looked easy. Bull riders saddled up with a calm nervousness, mentally prepping.
Moments later the gate flung open and the race to 8 began! The crowd, hooting and hollering, counted the moments. Pure exhilaration!

The stock market this year has been full of bucking, kicking, and twisting. But suddenly under the surface, pockets of high-quality stocks are ramping higher.
As we’ve said for weeks, our data indicates a surge higher for stocks.
Giddy up! The bulls are about to run wild.
Big Money Index Riding The Bull Market
Let’s start from the top. Stocks have gone virtually nowhere for a month. The S&P 500 is flat since May 7th.
And it’s not just the market, our data has been range bound since then too. You can see that in the directionless Big Money Index:
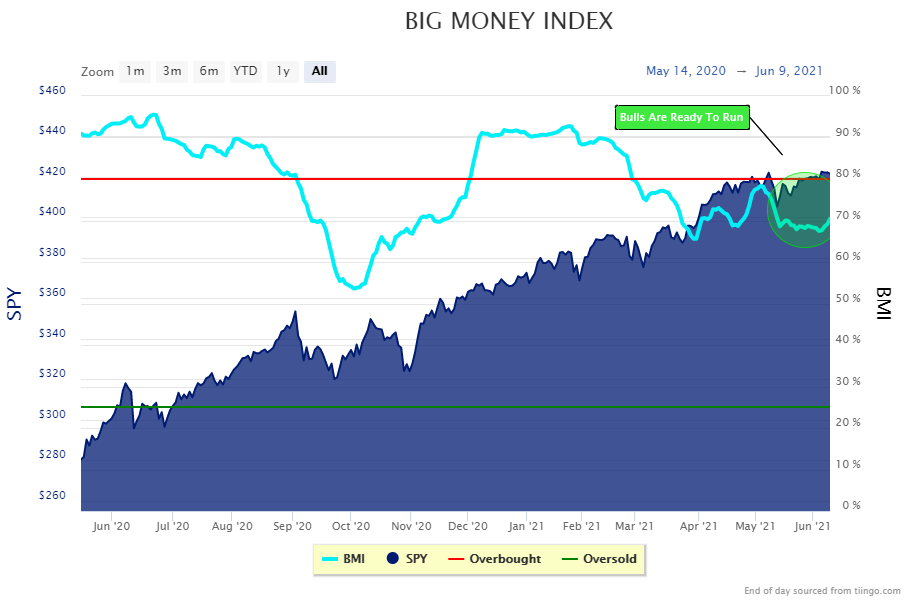
But, the BMI only tells half the story. Remember that it’s a 5-week moving average of buys and sells.
When buying starts to increase and sellers disappear, it sends the BMI higher. That’s what’s happening now under the surface. You can see that in the Big Money Stock Buys & Sells chart:
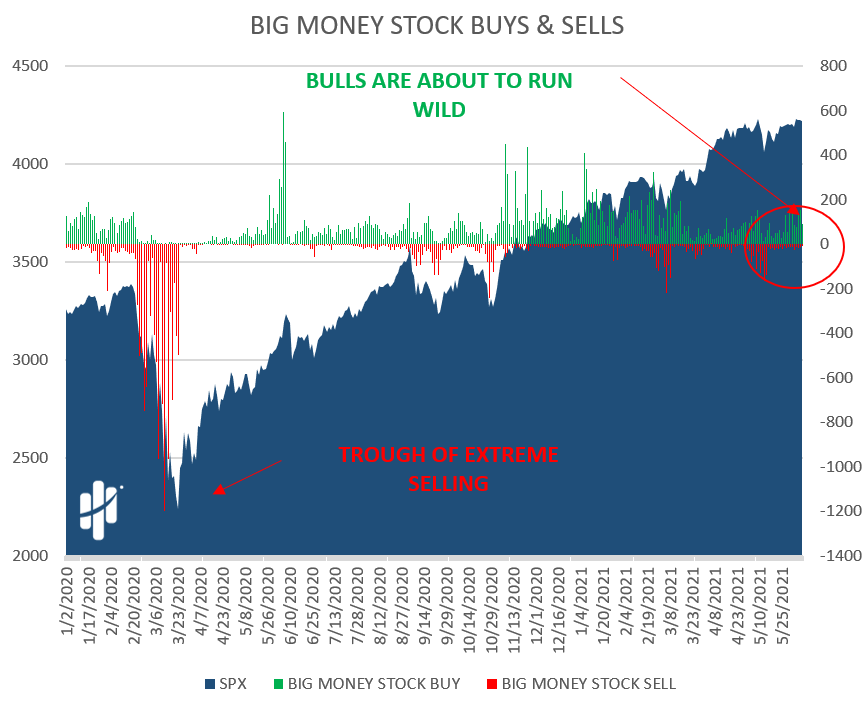
I’ve circled what’s important: Selling is evaporating as buying is increasing in a big way. This tells us the gate is about to swing open for stocks and send that BMI surging.
When data points to a higher BMI, saddling up and riding the bull market is the only thing to do!
The following table shows you how quickly buying is accelerating. It plots daily buys and sells for the past 25 days. Arrows point to how the last 2 weeks are seeing bigger buying as selling slows.
The 10-day moving average of the BMI is ramping. In about a week, all of this buying is going to overtake the BMI and send it surging:
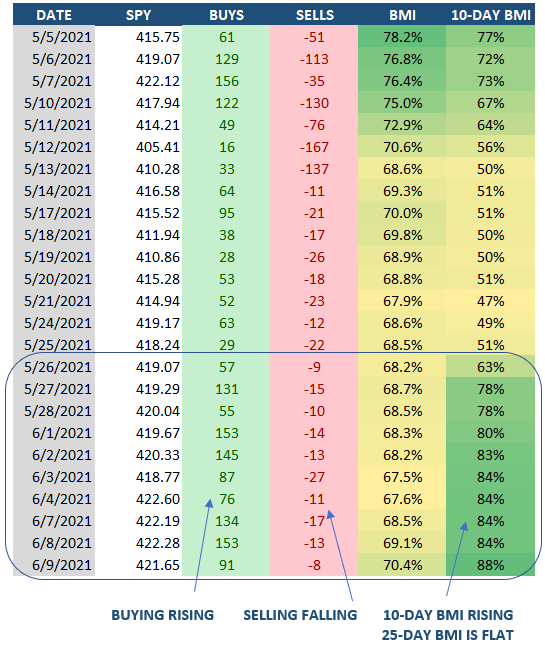
A lot of this new green we see on the right are prior growth stocks seeing newfound attention. This means that if there will be a big market run-up, odds are that growth stocks are going to lead the buck higher.
Our Top 20 lists have begun the shift from popular reopen names to growth leadership.
And there are other signs telling us to saddle up.
Real Estate And Energy Stocks See Big Buying
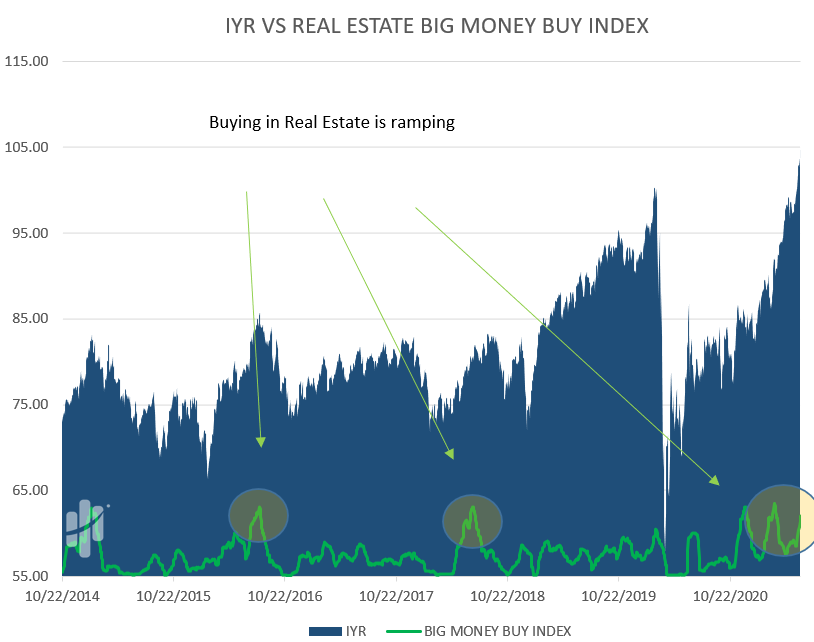
If the BMI is about to rise, you can bet there are sectors leading the way. For well over a month, Energy and Real Estate stocks have attracted the most Big Money on a relative basis.
We can see the buying momentum by sector in our Big Money Sector Indexes. If the green line rises, that means buying is accelerating.
Real Estate is up first:
Now Energy:
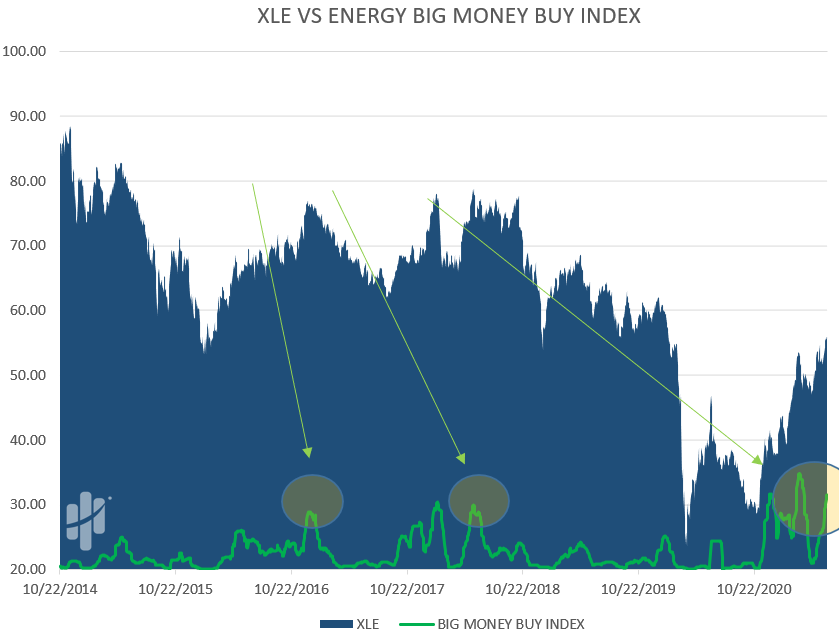
Again, I’ve circled what’s important. Buying is bucking in a big way. And odds are that more sectors will follow too.
Ride the bull market, baby!
So, let’s finish up.
Here’s the bottom line: The bulls are snorting at the gate. They’re ready to run again. Our data paints a clear message: Get ready for the Big Money Index to race higher. Get your boots on and saddle up!
Stock buying is accelerating but more importantly… it’s what’s being bought that’s important: high-quality companies. If you’re anxious and ready to ride this bull market, a great place to get stock ideas is our monthly MAP 50 report.
It’s full of our best names for riding this bull market.
Look, many investors got bucked off the bull market with the last growth scare. It happens. But heed the words of the great rodeo announcer Bob Tallman when he was asked, what do you do “…if you fall off” the bull?
His answer was simple: “you get back on!”
That’s great advice… take it from us… this clearly ain’t our first rodeo: