• Menu
  • Skip to right header navigation
  • Skip to main content
  • Skip to primary sidebar
  • Skip to footer

MAPsignals

We map big money.

  • Latest Insights
  • Power of MAP
    • MAP Products
    • MAP System
    • MAP White Papers
    • Videos & Interviews
  • Profit with MAP
  • About
    • About MAP
    • MAP Team
    • Authors
    • MAP System
    • MAP Products
    • Big Money Index
  • Members
    • Get Started With MAP
    • My MAP
    • Big Money Charts
    • MAP View
    • MAP View Options
    • MAP Top 20 Weekly
    • MAP 50
    • Member Updates
    • Platinum Updates
    • Members Only Posts
    • Performance
  • Portal

Rips And Hips Don’t Lie

September 12, 2019 //  by MAPsignals Staff//  Leave a Comment

Shakira claims that “hips don’t lie” – Mapsignals can’t speak to hips, but we can speak to rips…rips in big money buying.

As we prepared for a 5% dip in the market, under the surface, our data was saying that big money was stepping in to buy. Big money buying can precede a rip in stocks. Remember, when you look at big money buying on thousands of stocks each day, when it starts to shift – we shift.

Our readers were prepared. We got out in front of this – in fact, we pointed to big money buying last week…the kind that we haven’t seen in 6 weeks. Check this out:

Before last week, we saw more selling than buying for 5 straight weeks (August). Typically, big selling lasts for a while. It comes in clumps. Then, it slows. Then, buying grows. Rinse and repeat.

So, what does big selling and big buying look like?

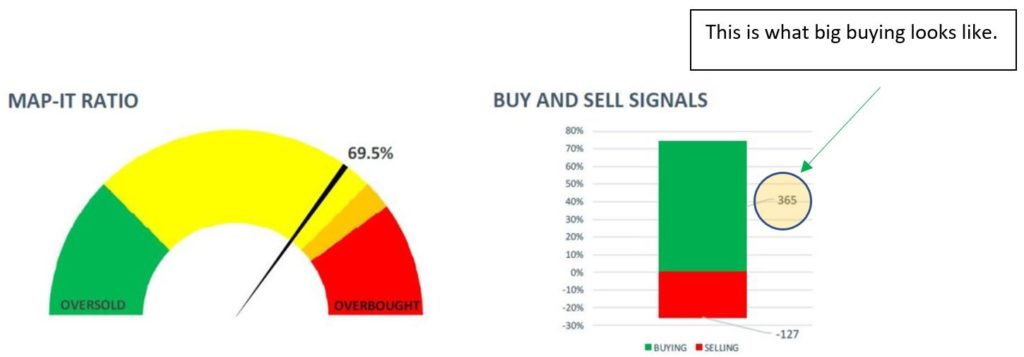
Let’s go back to late July for a moment. Up until then, week after week we were seeing more buying than selling. It looked a lot like the below from July 28th:

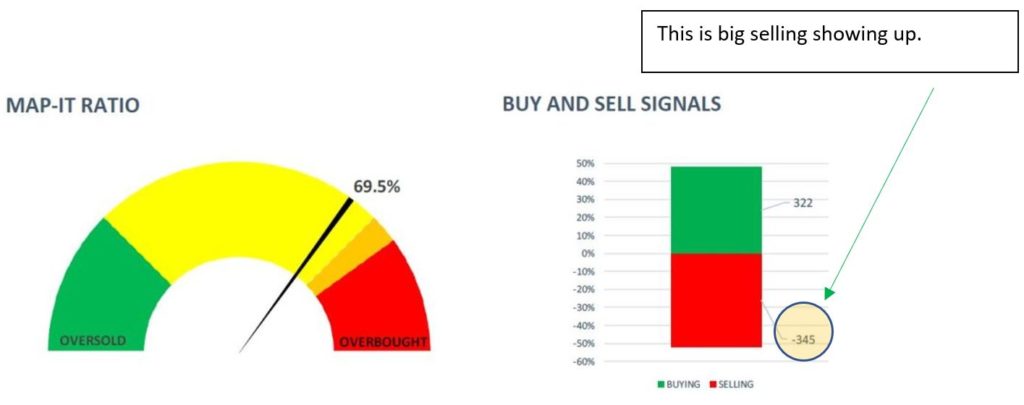
But then something shifted. Below is what tipped us off that something was changing in August. Big selling was bigger than buying – that was different…that’s the shift. This is from August 4th:

As we all know, the month of August was ugly. Selling got bigger and bigger. I’ll spare you the charts of what big selling looks like. It’s a lot of red.

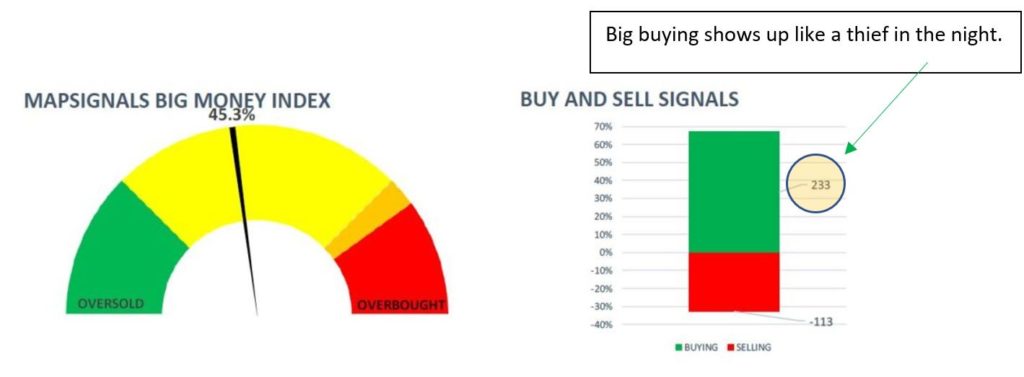
Then we hit a level that historically says a ~5% dip could be coming. It didn’t come. Check out what did come, though – big buying showed up again out of nowhere. This is from last week. This was the shift:

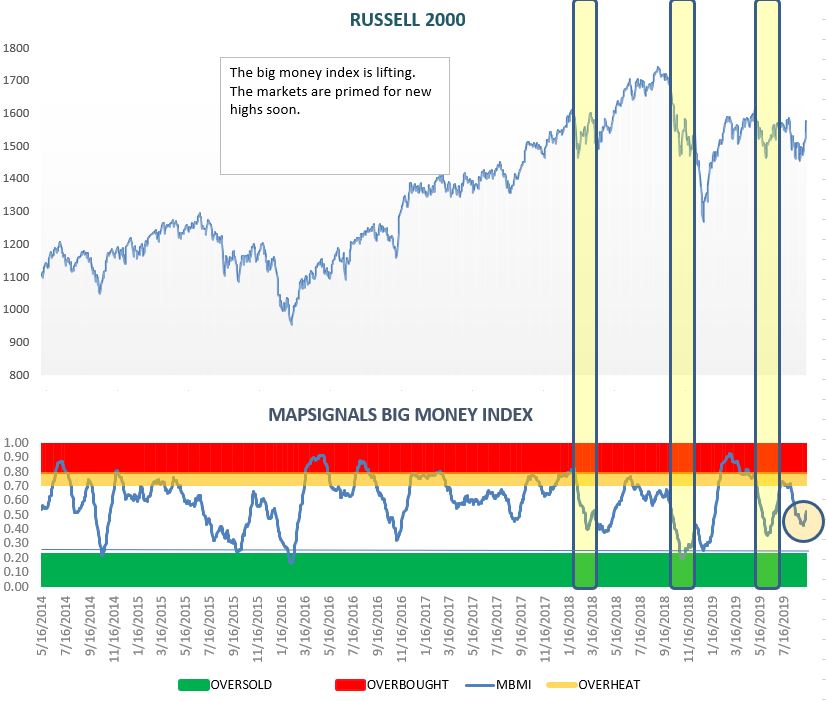
This new information led us to believe that “rips don’t lie” – rips in buying. Our big money index stopped heading lower. We even went out with this message on Sunday (9/8/19):

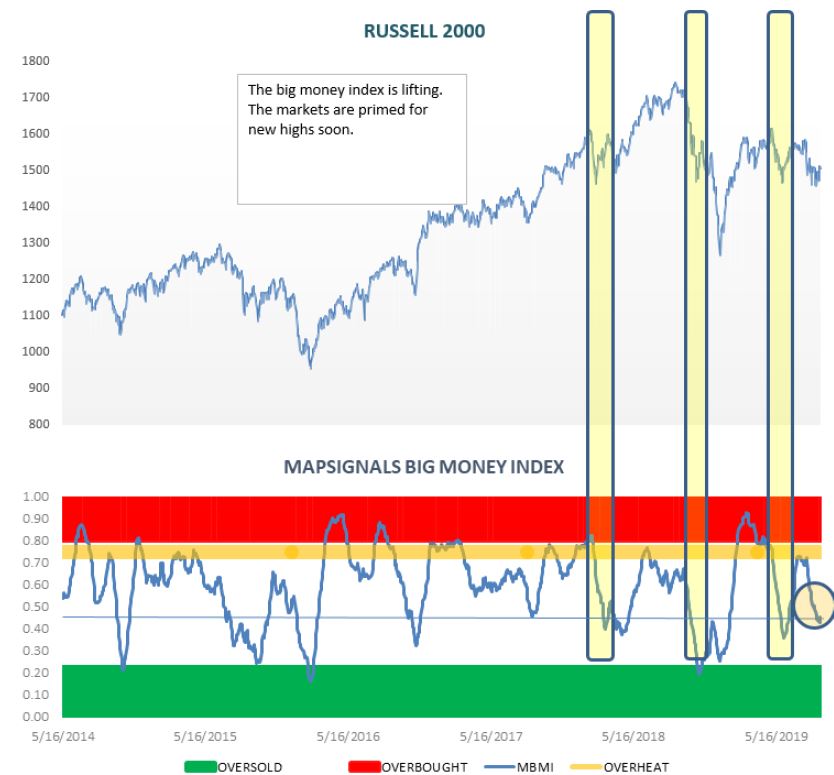
So, where are we now? Well, buying this week has been big. The big buy signals started last Wednesday – that’s when the story started to change. Since then, IWM (Russell 2000 ETF) has ripped 6.2%! This looks a lot like a massive unwind…a wicked reversion.

Here’s where we stand mid-week:

Bottom line: our data is showing very big buying. This is very bullish. Big buying can tip you off to a market ready to rip.


we map big money
MAPsignals Staff

The MAPsignals staff are the true heroes of our firm.

Spread the word!

Category: All, Big Money Insights Weekly, Special Reports

Previous Post: « Big Money Buying Slows To Key Level
Next Post: How We Buy On Dips »

Reader Interactions

Leave a Reply Cancel reply

Your email address will not be published. Required fields are marked *

Primary Sidebar

Get Big Money Insights for FREE

Want to know where the Big Money is headed?

Just enter your email address below. You'll get our FREE NEWSLETTER sent directly to your inbox.

We call it Big Money Insights... It’s your weekly sneak peek at the powerful market-moving forces that are hidden from 99% of investors.

"*" indicates required fields

This field is for validation purposes and should be left unchanged.

Categories

  • All
  • Big Money Insights Weekly
  • Big Money Series
  • Macro Insights
  • MAP In The Media
  • Members Only
  • Performance
  • Podcast
  • Special Reports
  • Stocks
  • Videos & Interviews
  • White Papers

Archives

  • February 2023
  • January 2023
  • December 2022
  • November 2022
  • October 2022
  • September 2022
  • August 2022
  • July 2022
  • June 2022
  • May 2022
  • April 2022
  • March 2022
  • February 2022
  • January 2022
  • December 2021
  • November 2021
  • October 2021
  • September 2021
  • August 2021
  • July 2021
  • June 2021
  • May 2021
  • April 2021
  • March 2021
  • February 2021
  • January 2021
  • December 2020
  • November 2020
  • October 2020
  • September 2020
  • August 2020
  • July 2020
  • June 2020
  • May 2020
  • April 2020
  • March 2020
  • February 2020
  • January 2020
  • December 2019
  • November 2019
  • October 2019
  • September 2019
  • August 2019
  • July 2019
  • June 2019
  • May 2019
  • April 2019
  • March 2019
  • February 2019
  • January 2019
  • December 2018
  • November 2018
  • October 2018
  • September 2018
  • August 2018

Follow us on Twitter

MAPsignals Follow 1,449 1,070

MAPsignals is a data platform that tracks institutional money flows in stocks and ETFs. Sign up for free insights here: https://t.co/SaAVHjKC9J

mapsignals
mapsignals avatar; MAPsignals @mapsignals ·
18h 1622987016957820928

One of my favorite #dividend #stocks having a day - Skyworks Solutions $SWKS - owned it for years

The $2B buyback is pretty significant given the market cap is sub $19B

#Semiconductors continue to see major inflows

Reply on Twitter 1622987016957820928 Retweet on Twitter 1622987016957820928 0 Like on Twitter 1622987016957820928 2 Twitter 1622987016957820928
Load More...

Footer

© 2021 Mapsignals.com

  • Home
  • Contact & Disclaimer
  • Privacy Policy
  • Terms & Conditions
  • Opt-out preferences
  • FAQ

Copyright © 2023 · Mai Law Pro on Genesis Framework · WordPress · Log in

✕
What Happened to Risk Assets White Paper is Here

Get your copy here and take a journey through our thoughts on margin and leverage.

Enter your email address below and you'll get our FREE NEWSLETTER sent directly to your inbox. 

 We call it Big Money Insights... It’s your weekly sneak peek at the powerful market-moving forces that are hidden from 99% of investors.