
Searching for Out of This World Stocks
Stocks remain subdued, bobbing and weaving daily.
There are reasons to believe the trendless behavior will continue.
Even still, keep searching for out of this world stocks.
Consider this, for thousands of years humans have looked to the night sky in search of answers.
According to Northern Arizona University, astronomical observations are believed to go back as far as 30,000 years ago.
Cavemen painted walls, detailing celestial illustrations. Early humans used stones to chart the movement of stars. Even the formation of the calendar can be traced back to the windows of light twinkling in the black of night.
Stargazing offered signals.
To be human is to find meaning in patterns.
When it comes to the stock market, we also can observe repeatable patterns. Charting flows of money reveals a beautiful continuous cycle.
As money rushes into markets, stocks zoom. When capital rotates, equities stall.
Today, we’ll focus our data-driven lens on the latest observable pattern, a falling Big Money Index (BMI). We’ll look to history to get clues on what’s likely ahead.
The evidence signals more chop before the pop.
Searching for Out of This World Stocks
Stocks and markets are guided by one principle: Supply and demand. This is the ultimate power law.
When demand is high for equities, stocks rip. When supply increases, stocks slip.
There’s no better way to illustrate this cyclical pattern than with the Big Money Index (BMI). This is the market’s North Star.
Flows ultimately determine market movements.
Lately, the BMI has been stalling, approaching the 70% level:
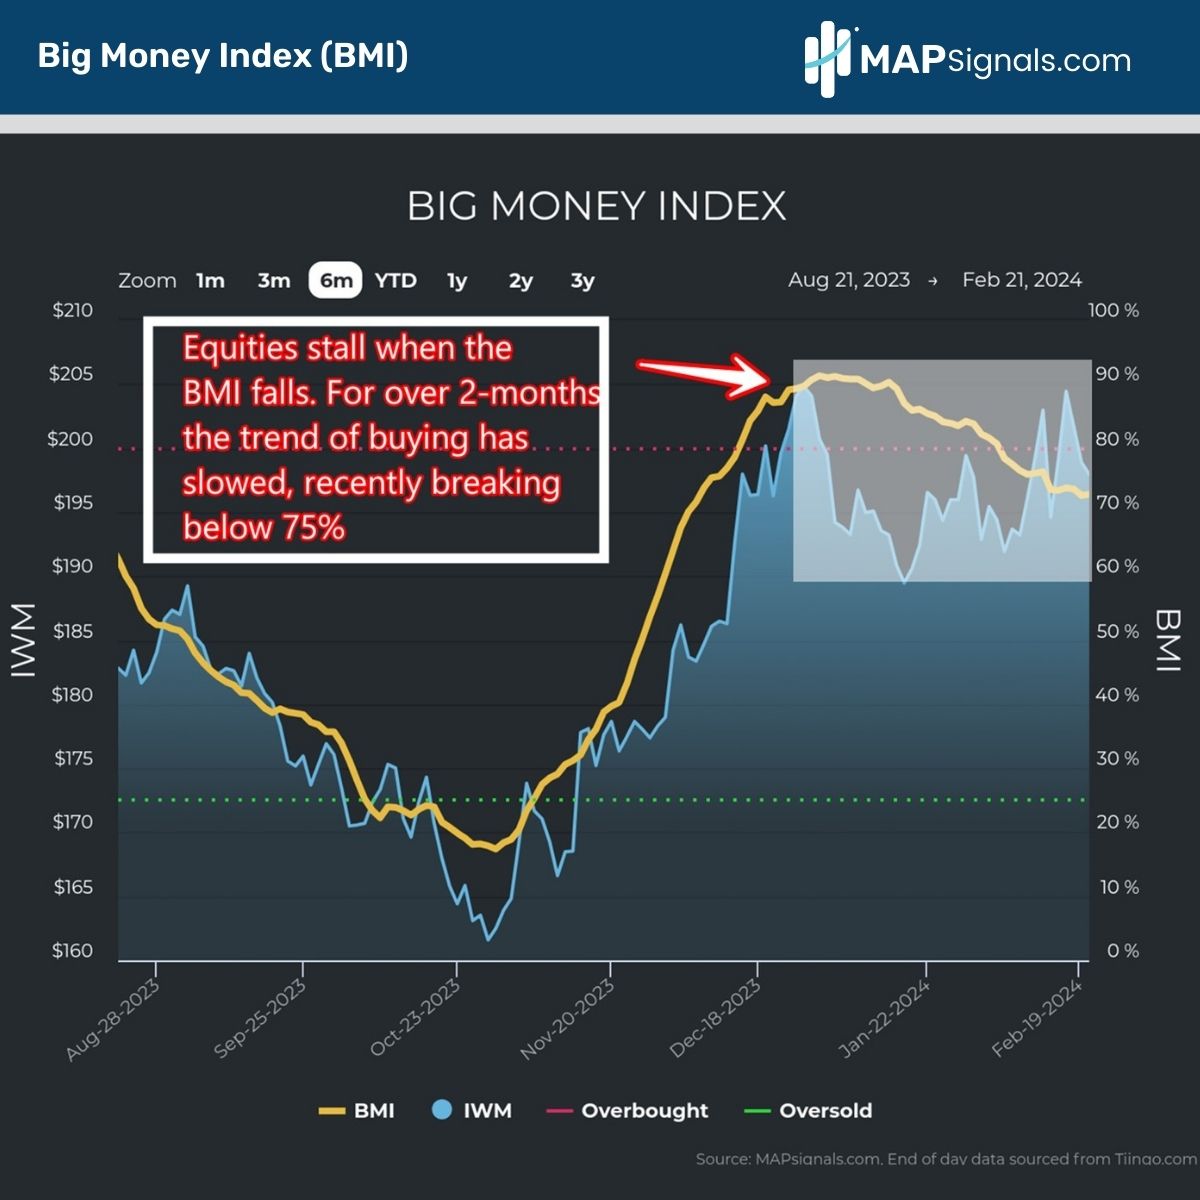
This line of truth tells us a few things:
- 1. Equity selling has increased modestly.
- 2. Stock buying has decreased modestly.
- 3. Small-cap stocks as tracked by the Russell 2000 ETF (IWM) are clearly seeing rotational action.
As we highlighted 2 weeks ago, in our piece titled a stock market pullback is underway, equities move in phases.
A falling BMI illustrates a change in our data as we’ve fallen out of overbought territory. If selling ultimately keeps climbing, we could shift from phase 2 to phase 3 soon:
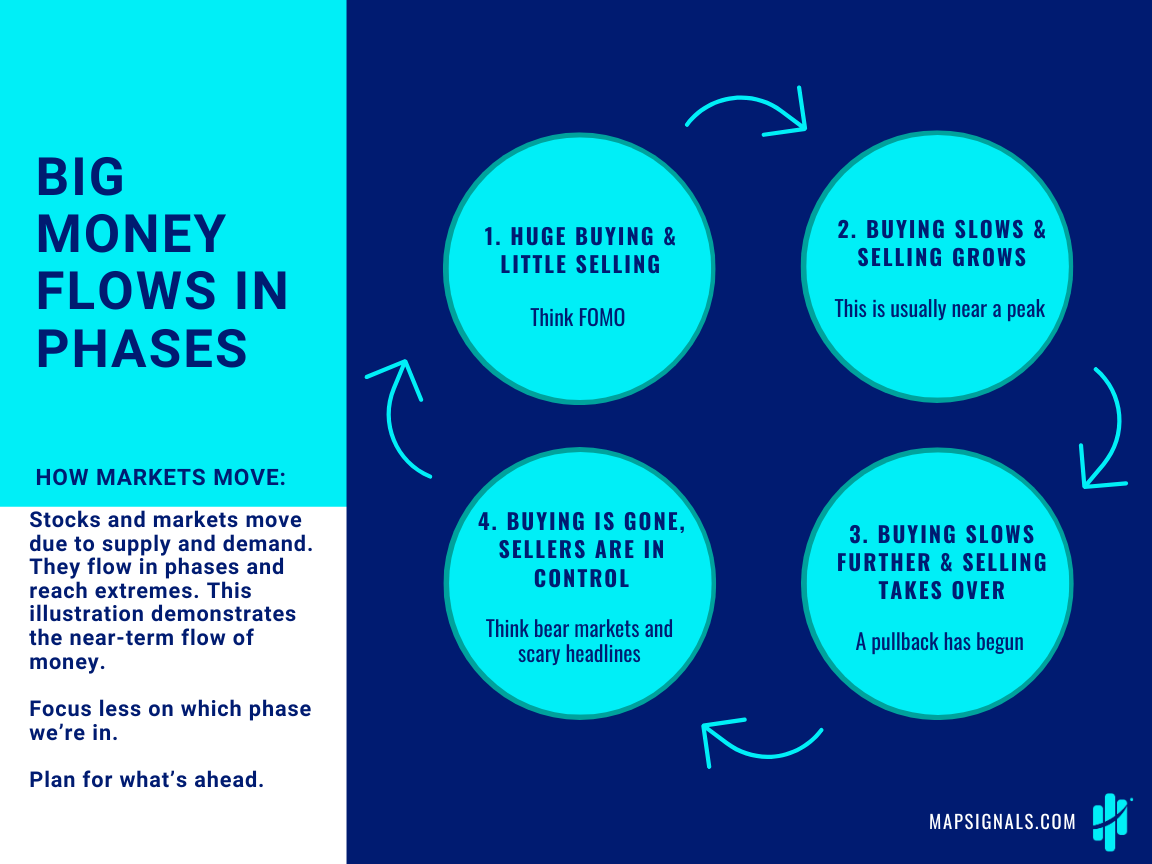
While this diagram offers us a theoretical framework for the cyclical nature of the market, let’s take it a step further and stargaze into cold hard data.
Market clues point to continued choppiness for stocks.
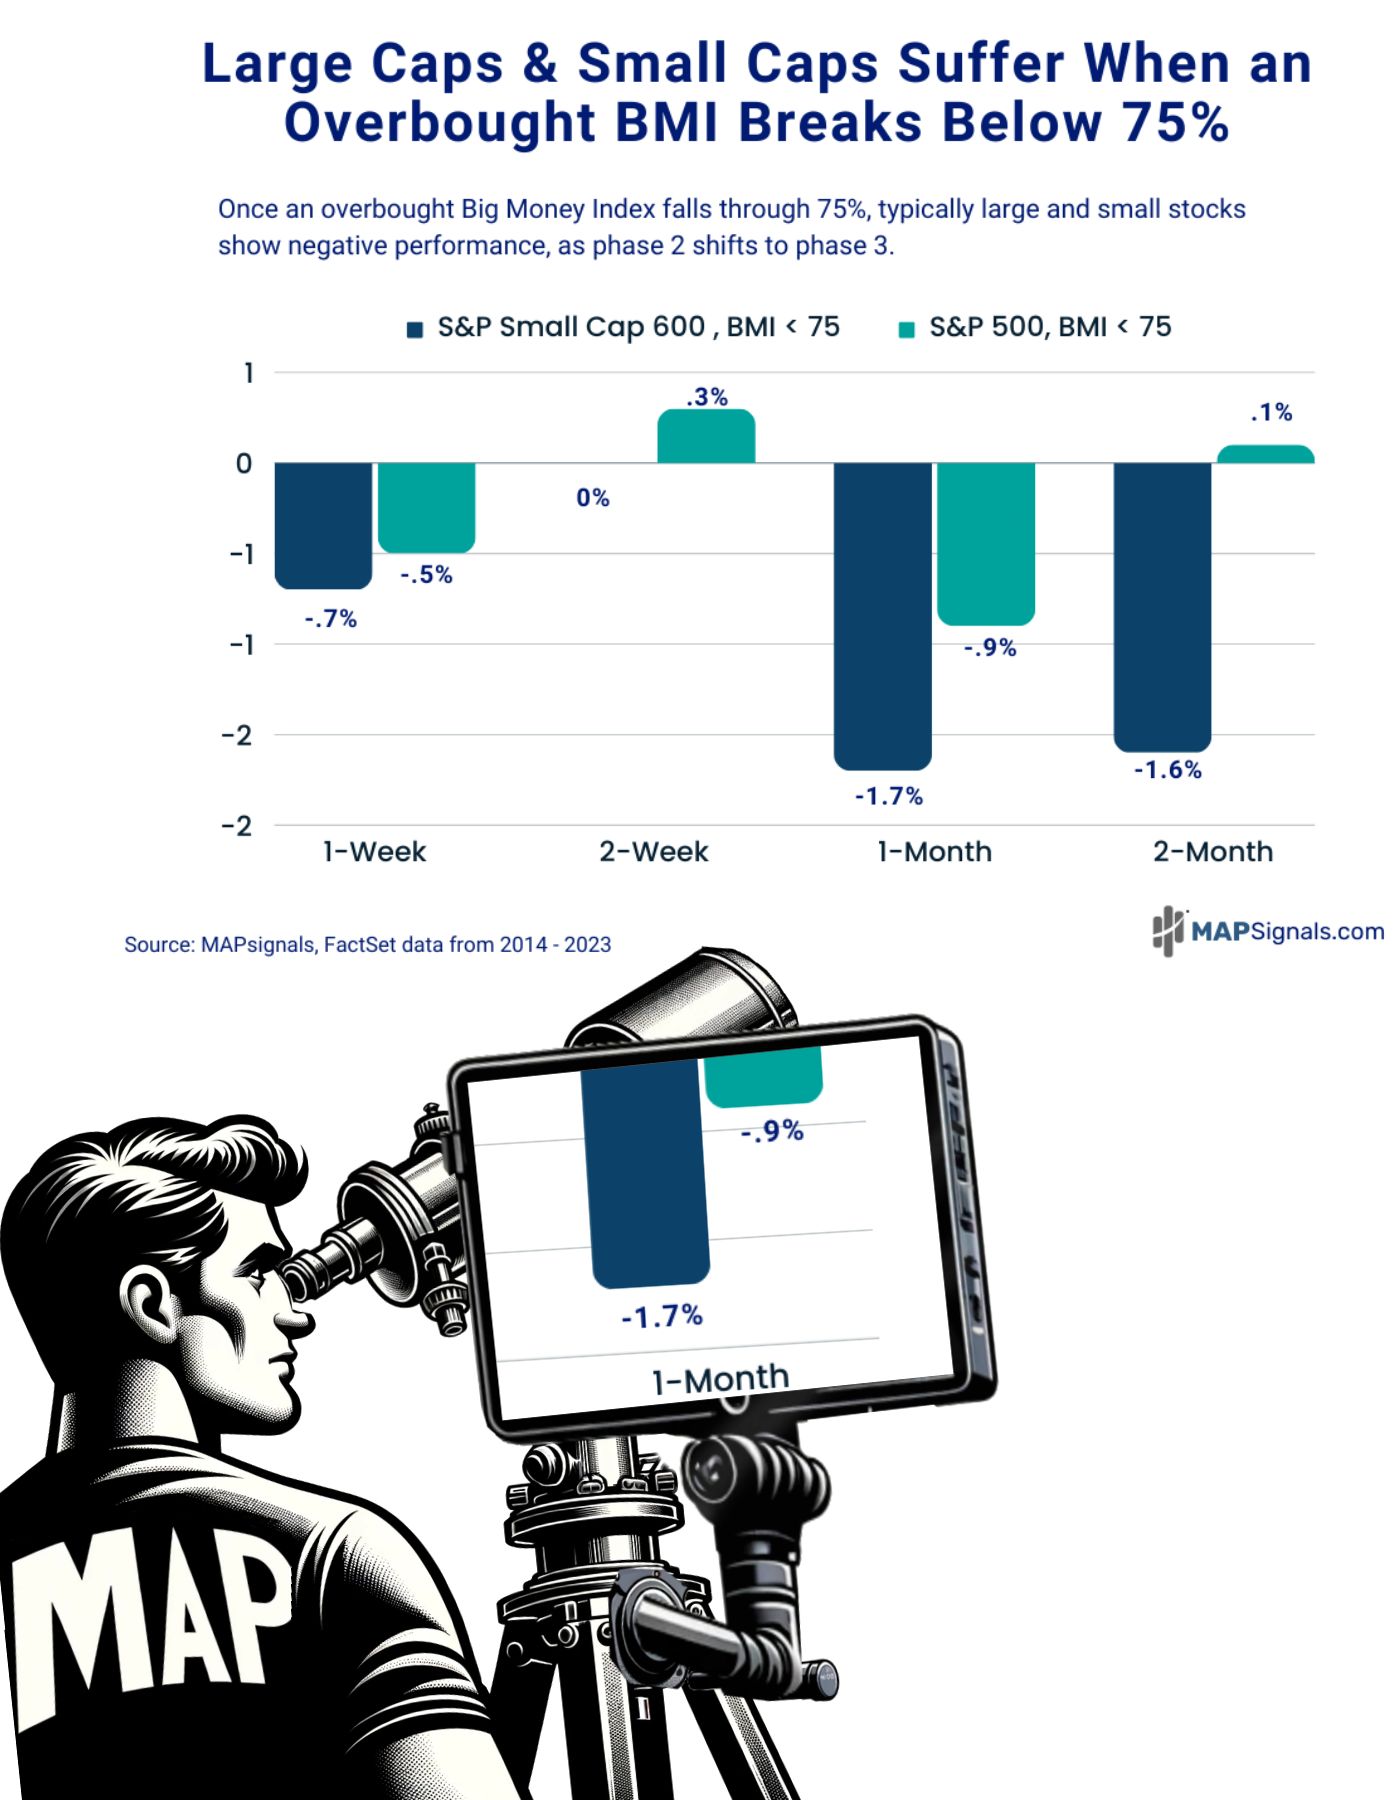
Given that the BMI broke into the low 70s this week, I went back and studied prior instances when the BMI fell out of overbought conditions and ultimately dropped below 75%.
Turns out, stocks stall when this threshold is breached.
Since 2014, whenever an overbought BMI falls below 75%, the forward performance for both large and small caps is lackluster to say the least:
- A week later the S&P Small Cap 600 dips .7%, while the large cap S&P 500 falls .5%
- A month later isn’t any better with small-caps off -1.7% while the S&P 500 drops .9%
Our friend Marty McMap has his telescope aimed at what’s important:
Now, clearly this dataset averages a negative expected return. Of the 14 historical instances this study entails, out to 1-month sees a positive hit ratio of 50% or lower.
In other words, it’s a coin flip whether stocks will be up or down a month from now. Those aren’t exciting odds if you ask me.
So, what’s an investor to do given this setup? Follow the Big Money!
As expressed last week, even with the near-term far from certain, these are the moments to search for superior stocks with outstanding sales and earnings.
One notable name that’s getting a lot of attention after yesterday’s earnings announcement is outlier stock, NVIDIA Corp. (NVDA).
This is a name we know extremely well over the years given it’s a monster Big Money favorite. In fact, when the BMI was last oversold in October, it was one of the top 5 stocks we recommended to our subscribers.
That wasn’t a moonshot. That was based on NVDA being a prior all-star name. The below arrow shows you how the October choppiness was an opportune time to make a bullish wager:
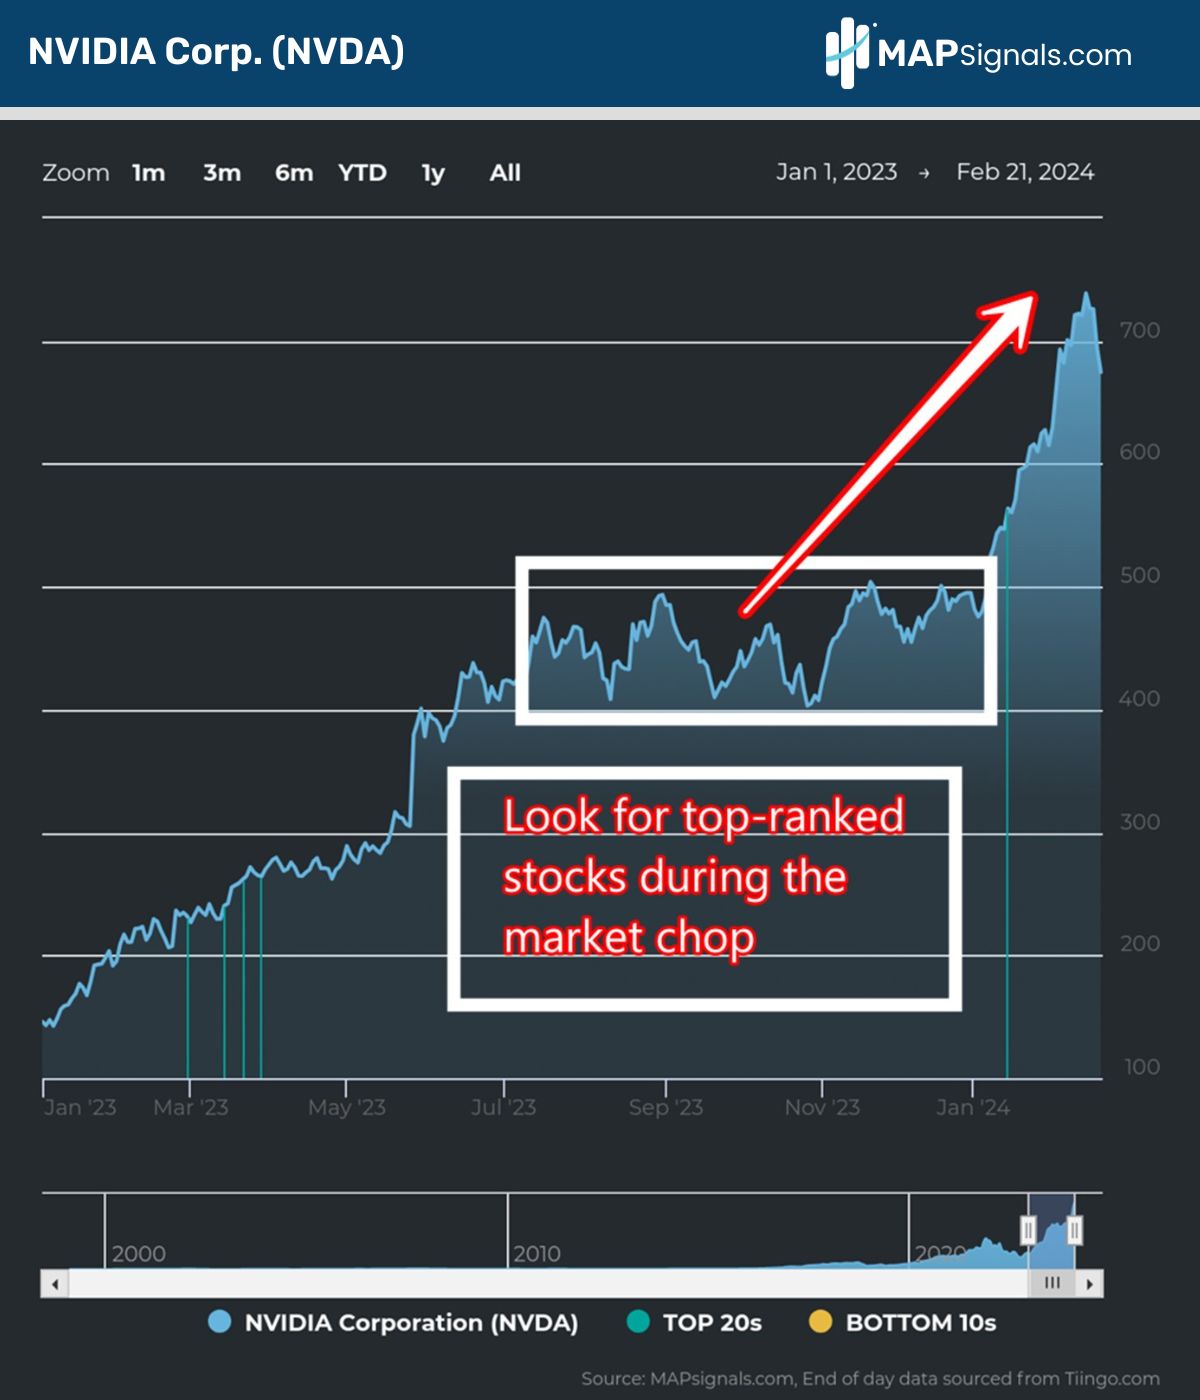
This puts the expected market chop in perspective.
Let’s wrap up.
Here’s the bottom line: A falling Big Money Index (BMI) tells us all isn’t well under the surface of the market.
A break below 75% tends to signal a trendless market out to 2-months.
But don’t get bearish searching for out of this world stocks. There are still shooting stars, like NVIDIA from last October. You just have to aim your market telescope at the names beating and raising guidance, under heavy institutional accumulation.
Humans have been mapping the night sky for thousands of years.
At MAPsignals, we search for market leading stars with our unique data-driven lens.
If you’re a Registered Investment Advisor (RIA), professional, or are serious about investing, start mapping the markets with a MAP PRO subscription today!
Don’t let your portfolio moonwalk 2024 alone.