• Menu
  • Skip to right header navigation
  • Skip to main content
  • Skip to primary sidebar
  • Skip to footer

MAPsignals

We map big money.

  • Latest Insights
  • Power of MAP
    • MAP Products
    • MAP System
    • MAP White Papers
    • Videos & Interviews
  • Profit with MAP
  • About
    • About MAP
    • MAP Team
    • Authors
    • MAP System
    • MAP Products
    • Big Money Index
  • Members
    • Get Started With MAP
    • My MAP
    • Big Money Charts
    • MAP View
    • MAP View Options
    • MAP Top 20 Weekly
    • MAP 50
    • Member Updates
    • Platinum Updates
    • Members Only Posts
    • Performance
  • Portal

Shaking Out the Weak Hands

February 3, 2022 //  by Lucas Downey//  6 Comments

Investing isn’t always balloons and buttercups. Sometimes it’s outright painful.

Many stocks are down massively. Mr. Market has a way of shaking out the weak hands.

Investing isn’t always balloons and buttercups. Sometimes it’s outright painful. Many stocks are down massively. Mr. Market has a way of shaking out the weak hands.

Look, we are in the midst of a nasty selloff. Many stocks are down well over 50%. It’s one of the deepest growth pullbacks I’ve ever sat through. And I’ve been through plenty!

Last week I laid out my game plan for an oversold market. In it, I showed how selling of this magnitude has a bullish setup literally across the board. Guys and gals, this is not the time to throw in the towel.

So, while waiting for a true oversold market can take time to play out – being proactive is the best strategy. Because let me be clear: Markets won’t always be in free-fall. Eventually they’ll settle down and a bullish catalyst will stop the red.

As my favorite investor of all-time, Peter Lynch put it, the real key to making money in stocks is not to get scared out of them. And he’s right. The best stock investments of all-time required perseverance and conviction.

Drawdowns are part of the game.

And while the data suggests that Mr. Market isn’t done shaking out the weak hands, today I’ll show you why you want to be proactive in this type of environment.

But, first let’s look at the data.

Big Money Index Did Not Rise Last Week

Over the past 5 trading days, the S&P 500 (SPY ETF) rose 6%. Normally, that’s very bullish. But, when the data doesn’t confirm it, I take notice.

Look how the latest bounce did not lift the Big Money Index.

big money index

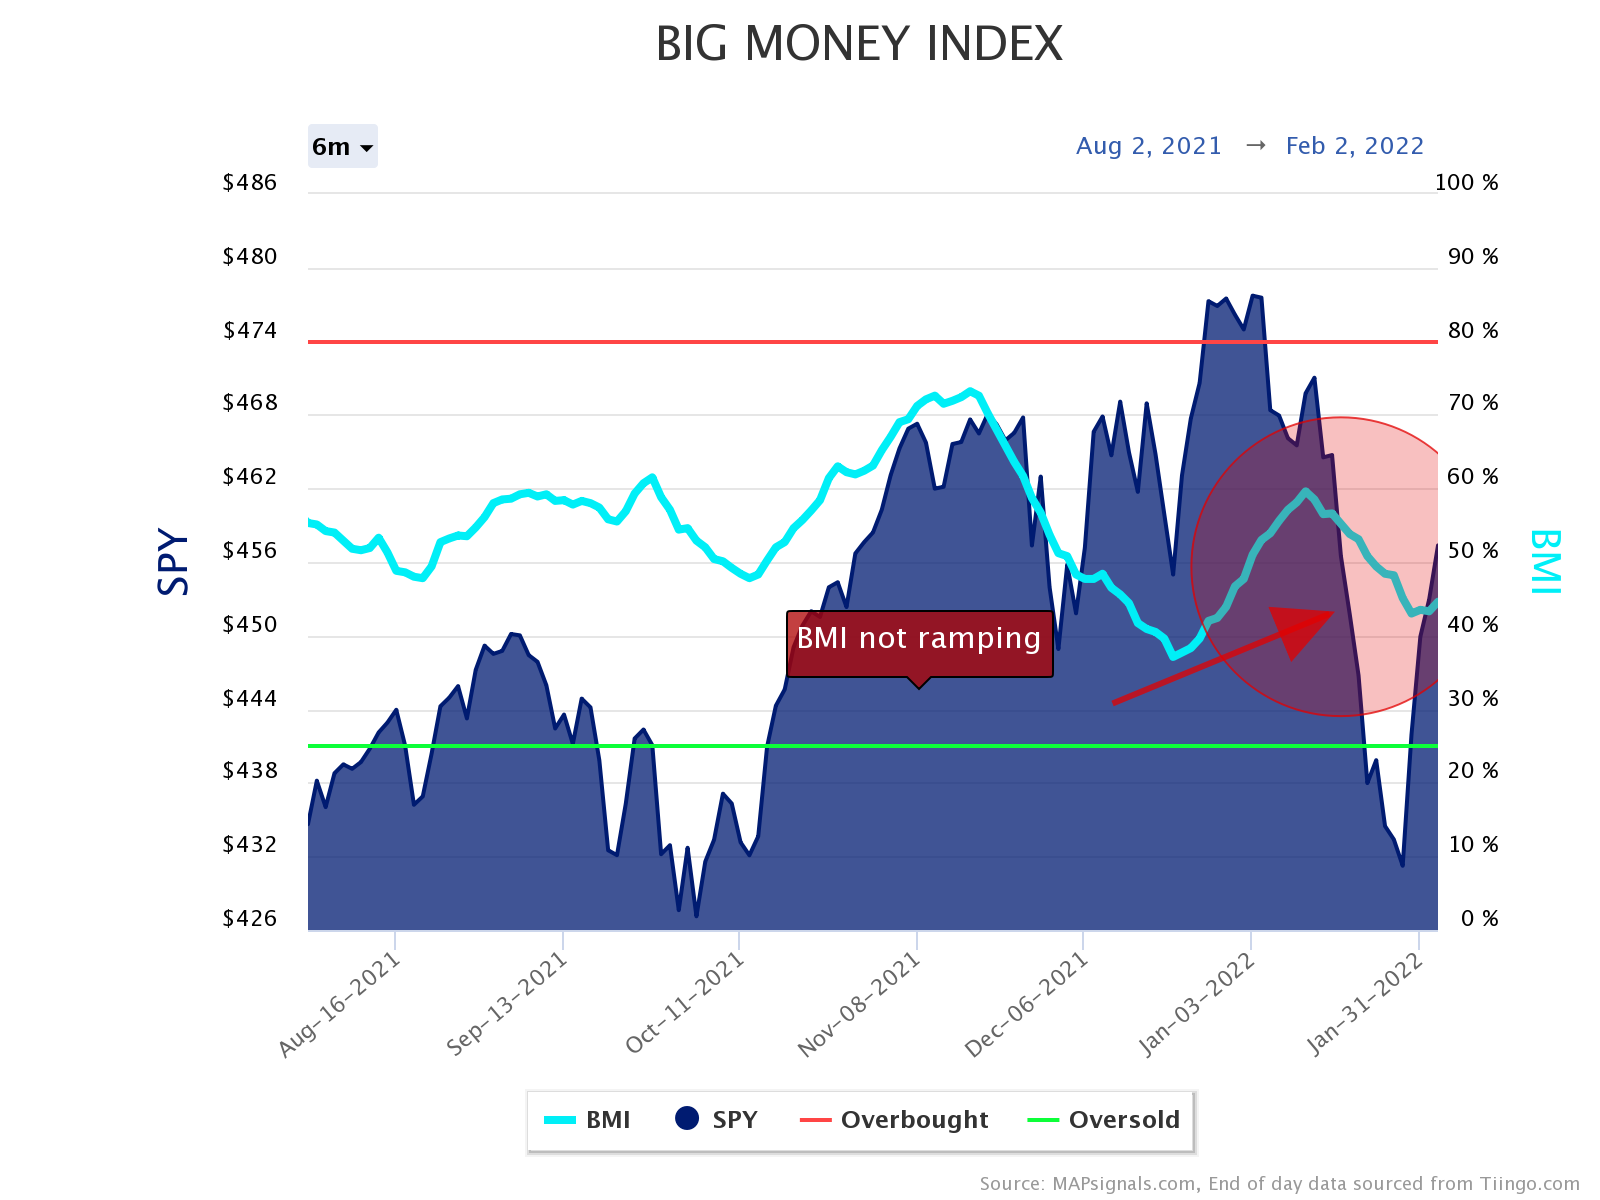
And you may be wondering why it didn’t lift. Well, it’s because the latest ramp in stocks is due to selling slowing…not because buyers stepped in. Let me show you what I mean.

Below are the daily buys and sells. The main takeaway is that selling vanished:

Big Money Buys & Sells | selling set to resume

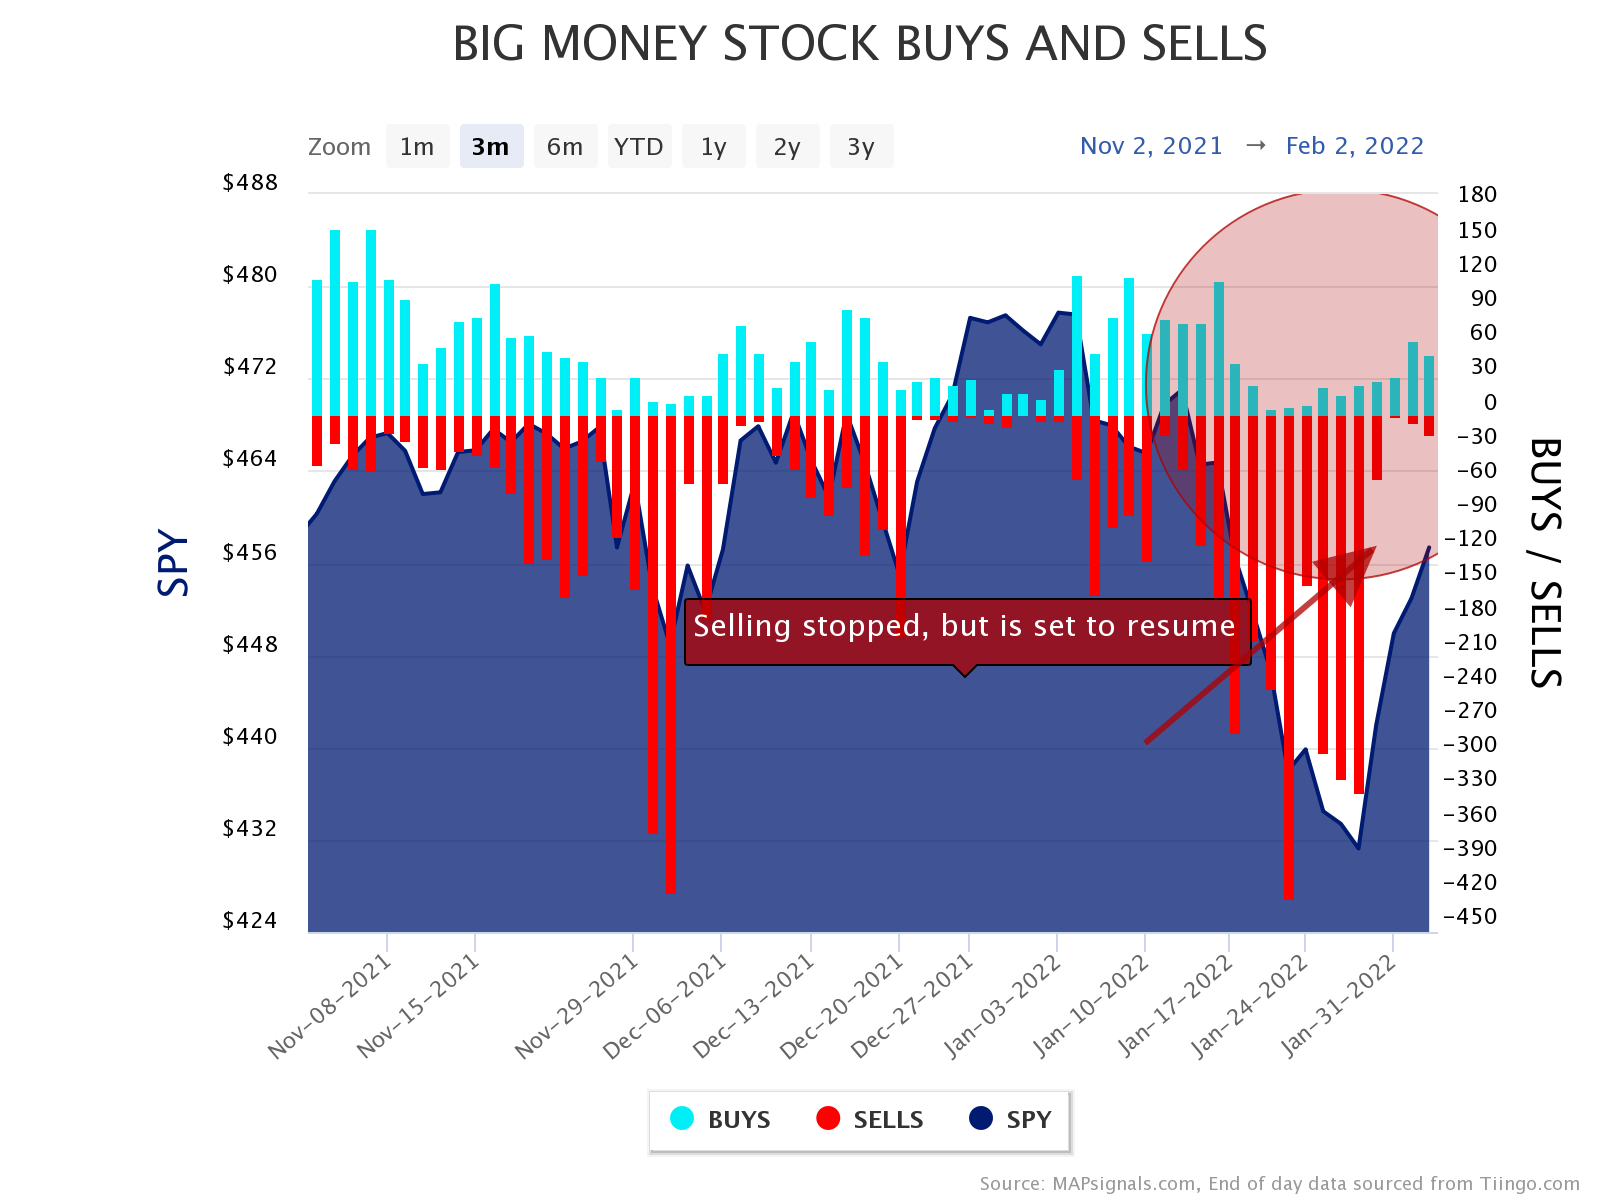
Normally I’d be jumping for joy. But, we’re missing one key ingredient for a real rally to take hold: buyers.

And looking at sectors tells the story. Technology, Healthcare, and Discretionary stocks bounced hard last week. But notice how there’s no buyers to speak of.

Up first is Technology:Big Money Signals | zero buying in Technology stocks

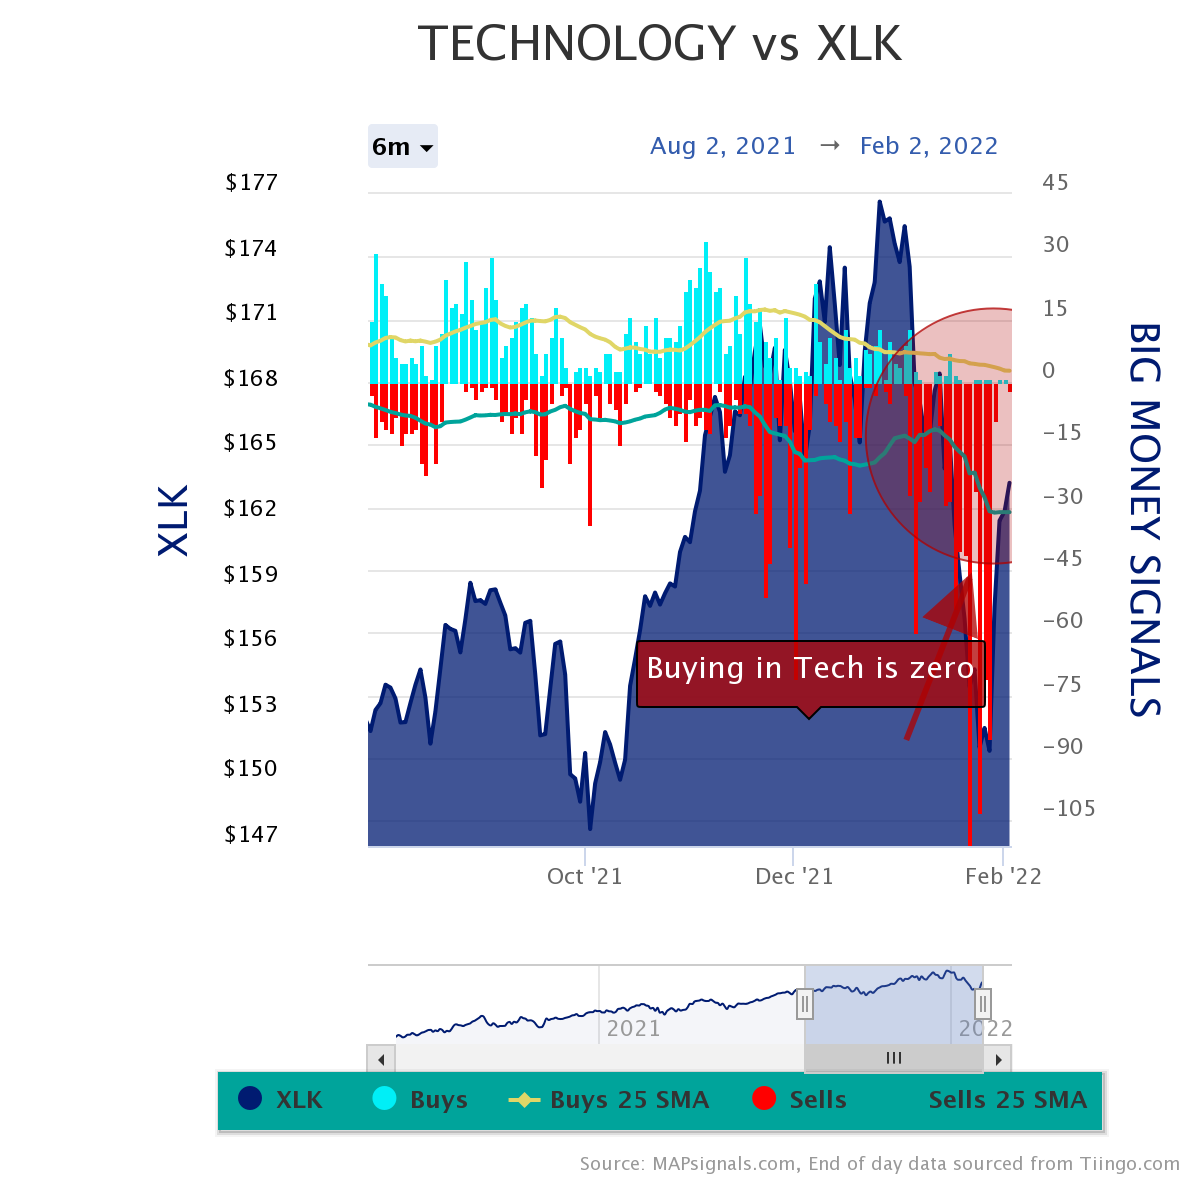
And the same happened in Healthcare too:

healthcare


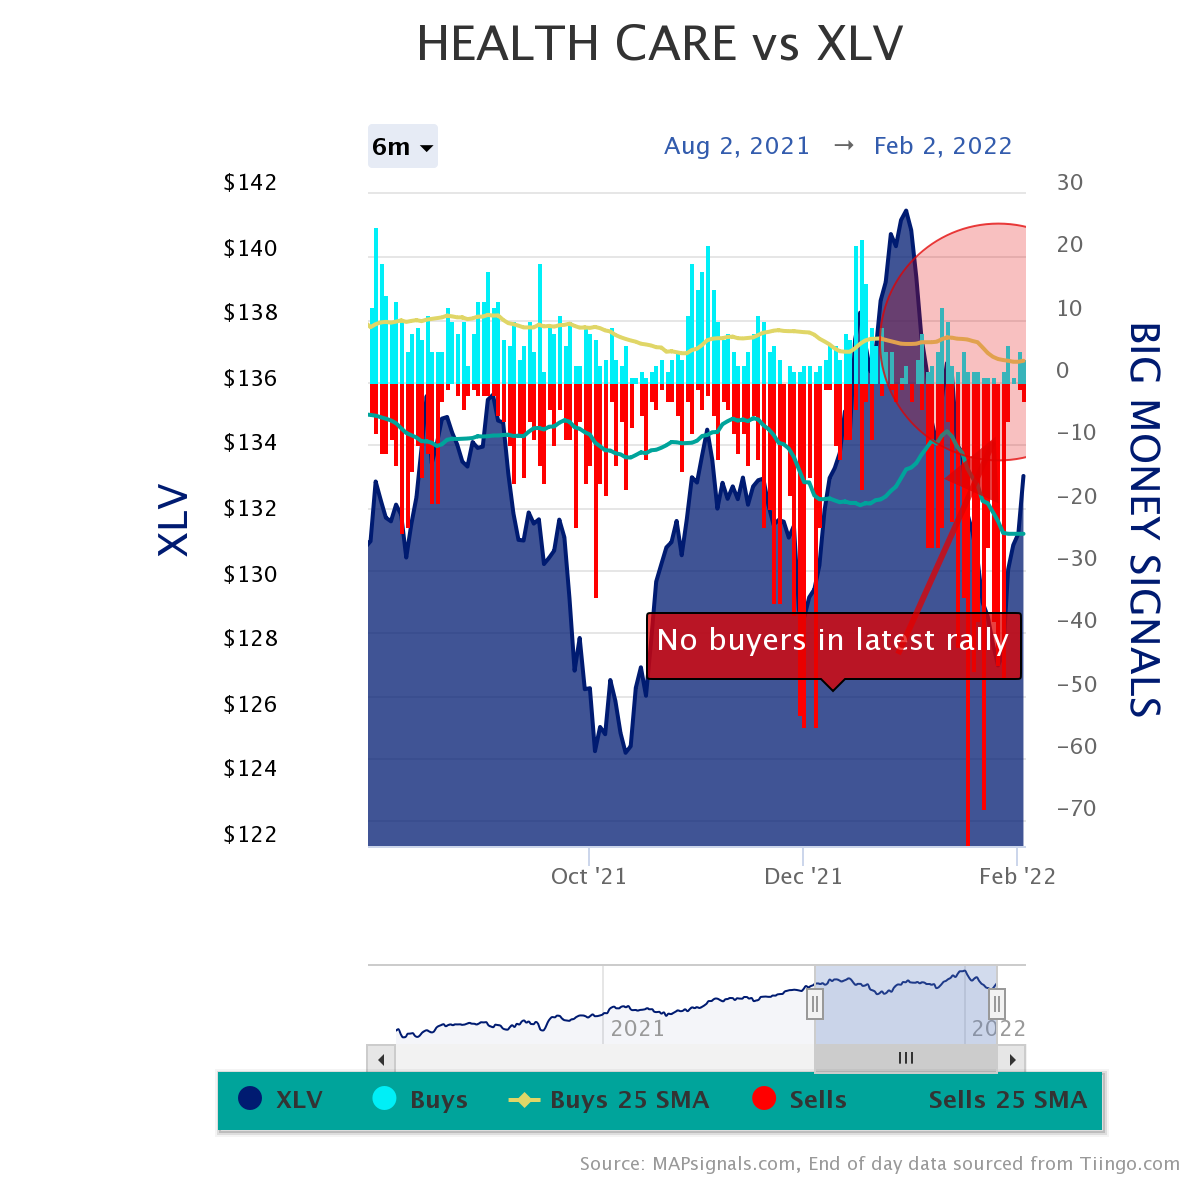
And the same action happened in Discretionary stocks:

discretionary

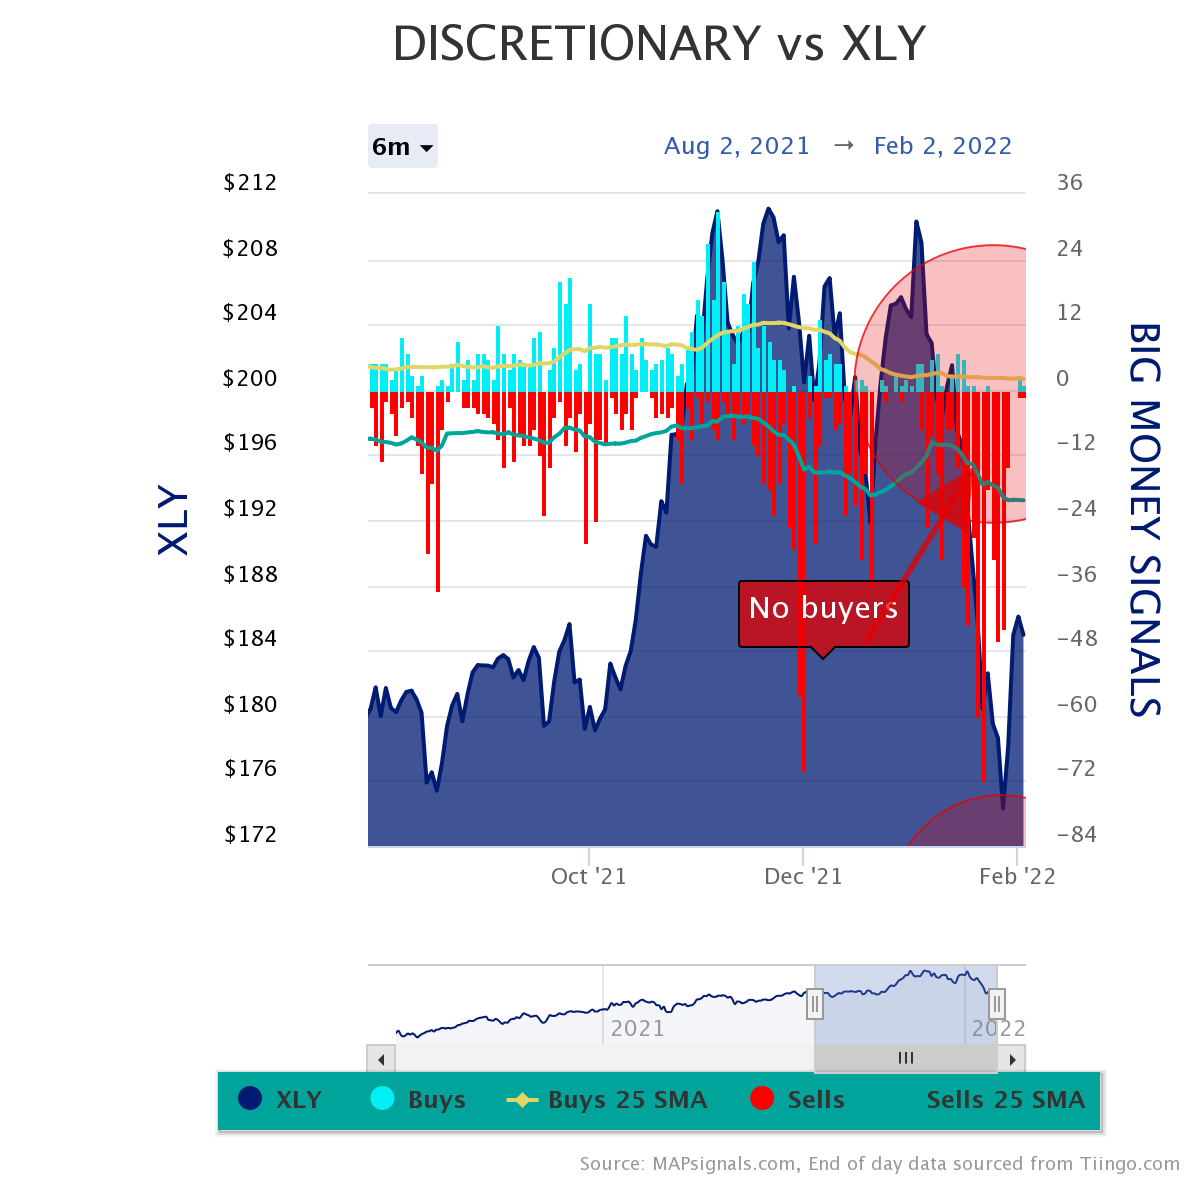
I’ve circled areas in red for a reason. If the rally was real, we’d be seeing green bars in these troubled areas.

To me, the coast isn’t clear. The data suggests Mr. Market isn’t done shaking out the weak hands.

But now let’s turn our frown upside down. I want to remind you of why you don’t want to give up on outlier stocks.

Shaking Out The Weak Hands

Now, I’m going to drive home the long-term bullish message. We’re all about 2 things at MAPsignals: first, we look for outlier stocks and second, we love following the Big Money.

Below is a basket of our Top 20 stocks from the second half of 2019 and the bottom ranked stocks. I picked this area to showcase for 2 reasons. First, many of the stock in this basket are down big right now and second I want to show how the basket performed heading into and out of the pandemic…the nastiest selloff in recent memory.

The electric blue line is the outlier portfolio, the dark blue is the S&P 500 (SPY ETF), and the red line is the bottom ranked stocks portfolio.

The left circle shows how no stocks were spared during the March 2020 pullback. This is important because I want you to see that we’ve seen nasty pullbacks before.

But also notice once the market sprung back, outliers resumed their dominance while the red portfolio sagged:

outliers

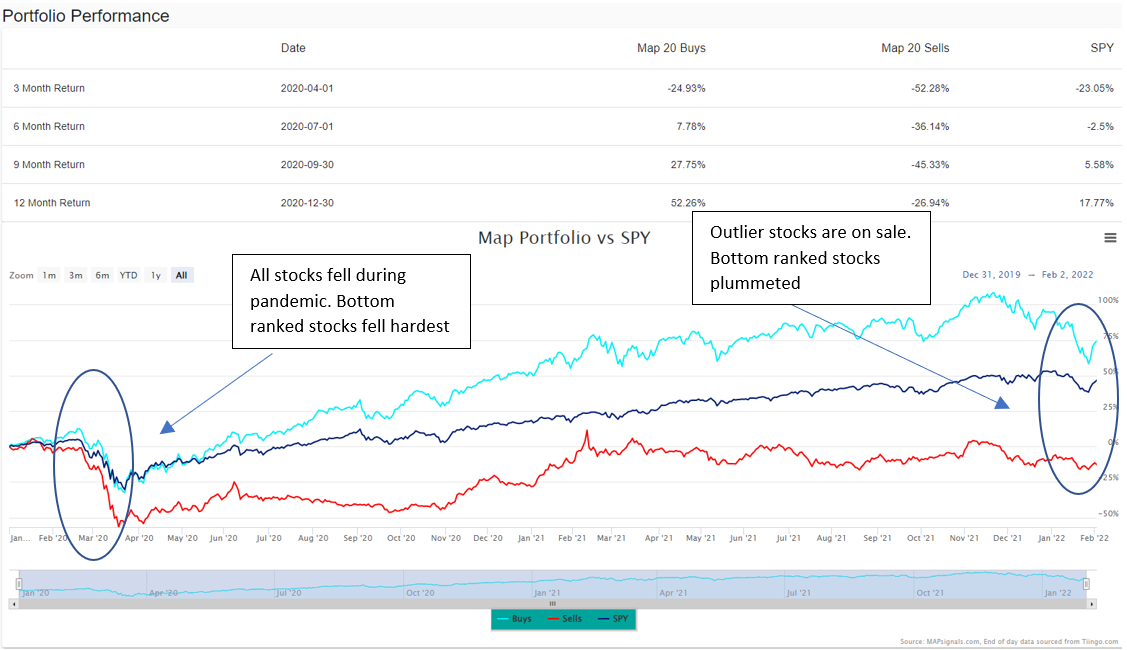
And off to the right is another circle. Clearly outlier stocks have pulled back massively recently. And herein lies the opportunity.

Mr. Market is still shaking out the weak hands. But, don’t let him shake you out of great stocks!

Last week I dropped in my game plan for an oversold market. I’m going to add it here today as a reminder of why we’re setting up for a monster leg higher once the bottom is formed:

shaking out the weak hands

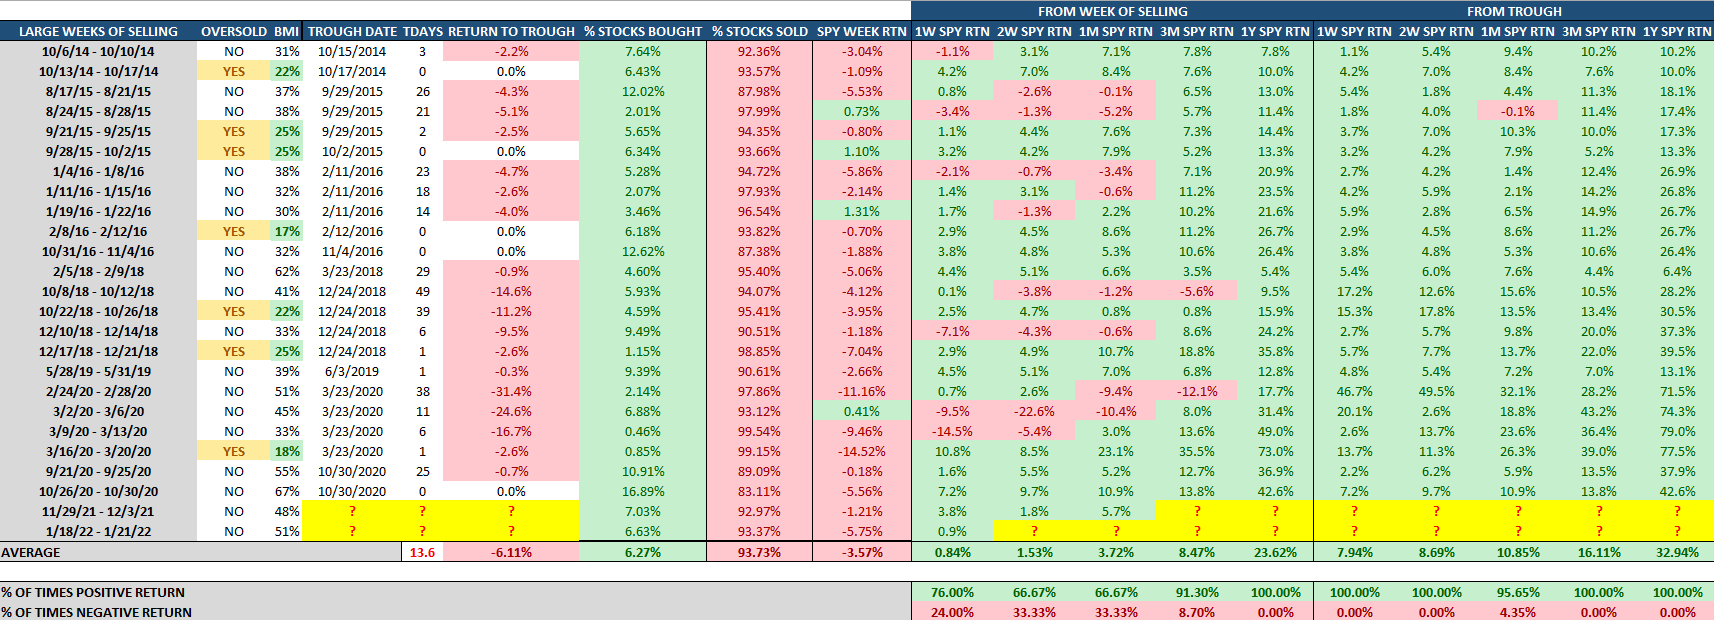
You can see that after selling of this magnitude hits, it’s uber bullish across the board.

Man, that’s a lot of green.

Let’s wrap up.

Here’s the bottom line: The latest rally in the market doesn’t have me convinced the selling is over. My bet is that Mr. Market will be shaking out the weak hands in the coming weeks. That’s the bad news.

The good news is that times like now are incredible opportunities. Great stocks will fly again!

If and when we reach oversold (25% in the BMI), it’s like being dealt pocket aces. I’ve learned to bet big when it triggers.

The last 2 times we went oversold were March 19th, 2020 and December 24th 2018. The markets then were ugly. Those were not times for weak hands.

And neither is now.

***And here’s our latest video: Best Oversold Stocks to Buy for February 2022. These are the times to focus on best of breed companies. Eventually the selloff will pass.

Make sure to follow our YouTube channel here so you never miss any of our videos.

Also, you can find our other videos here.

Lucas Downey
Lucas Downey

Lucas is co-founder of MAPsignals. His full bio can be found here.
Prior to MAP, he was Head of ETF Sales at Cantor Fitzgerald & SVP of Derivatives at Jefferies, LLC.

Spread the word!

Category: All, Big Money Insights Weekly

Previous Post: «Best Stocks to Buy Now for February 2022 Best Stocks to Buy Now for February 2022
Next Post: Best Way to Invest Globally Best Way to Invest Globally»

Reader Interactions

Comments

  1. Titus

    February 3, 2022 at 8:57 pm

    Good to know the bottom is not in yet.

    Where does your data come from?

    Reply
    • MAPsignals Staff

      February 4, 2022 at 5:48 am

      Hey Titus-

      For now it appears the sellers aren’t done. But we still feel there’s opportunity on the journey towards an oversold BMI.

      For data, we use a number of providers, but our signals and charts are based on our algos.

      Reply
  2. ayesa

    February 4, 2022 at 10:08 am

    I have only two ETFs in my long-term portfolio – SPY and QQQ. I am okay-ly happy with their returns so far. After all, the broad market seems to keep going up over the years.

    However, I want to get into individual stocks. I am afraid of losing money by making bad investments especially looking at DOCU and FB.

    Can I use MAPs to create a ‘core’ portfolio of SPY and QQQ and then the ‘branches’ with individual stocks? Do these stocks need to have high daily volume of 1 or 2 million shares per day?

    And not asking for your secrets! How do you determine buyers vs. sellers when there is only a total volume for each day? Do you monitor the price movement for each stock with your algos?

    I don’t trust financial advisors (burned a few times) but being a lady, I find value, growth and dividend investing so confusing. How do I figure out capital allocation?

    Reply
    • MAPsignals Staff

      February 4, 2022 at 11:28 am

      Hi Ayesa,
      Thanks for writing in! First off to get the legal stuff out of the way, unfortunately we are not allowed to dispense individual investment advice. That is for the very financial advisors that you speak of who are registered to do so. So, the general stock answer we must give is that you must evaluate your own individual circumstance and risks when assessing how to allocate your own capital. With that out-of-the-way let me get the rest of your questions:
      As far is passive investing goes (just investing in an index) I believe in my opinion you made great choices with SPY and QQQ. People like Warren Buffett would likely agree.
      We at MAPsignals certainly like to use our MAPsignals portal to identify great outlier stocks. That’s what we’re all about! In terms of getting into individual stocks it’s a double edge sword right now. When great stocks go on sale it’s an excellent time to jump in for the long-term investor. But the flipside is if you have little to no experience with individual stocks may pay to so-called “paper trade“ for a while. This way you can get a feel for the volatility and the behaviors of individual stocks that you like. The benefit of paper trading is not risking loss. The downside is you forgo any potential gains.
      As for stocks that appear in MAPsignals research, things like the top 20 reports, they must have a minimum liquidity of 500,000 shares per day and the companies that are $500 million or more in market capitalization.
      As for how buy and sell signals are determined, we use a proprietary algorithm that looks to replicate large institutional orders that we used to handle when we worked on Wall Street. What goes into it (not giving any secrets away) is a mixture of price, volume, volatility, and various other technical metrics such as near-term highs and lows. Just think of it as a filter: we are trying to only focus on unusually large trading.
      As for capital allocation, again every individual has individual needs and goals what works for some may not work for others.
      I hope that helps and if you need anything, please don’t hesitate to reach out again!
      -The MAPSignals Team

      Reply
      • ayesa

        February 6, 2022 at 8:50 am

        Do you use technical analysis? I’ve heard people saying it’s nonsense.

        Do you also look at ETNs and REITs?

        You suggested in one of your white papers that quarterly rebalancing works the best but the MAPS report comes out every week. How do I reconcile the difference, in other words, when do I buy the juicy stocks?

        Lastly, how do you quantify moat? I like how MSFT operates – they’re everywhere from cloud to gaming console to Windows and Office software. How can we find more companies like them?

        Reply
        • MAPsignals Staff

          February 6, 2022 at 7:37 pm

          Technicals are just one of many things we look at to identify great outlier stocks and ETFs. We do, from time to time, see opportunities in ETNs. However, we mostly focus on data as our core driver and favor indexes that hold true assets like ETFs, as well as REITs.
          We have a white paper that looked at a back-tested 6-month rolling strategy of rotating 20 stocks. It showed a great performance. Obviously it’s looking at 30+ years. So, that includes a lot of rotations… and obviously some pullbacks.
          And we do look at each company we personally invest in and look for moats. Nothing is bullet-proof. The key is to build a solid portfolio and if you can find a few monster winners, the performance will be awesome. -The MAPsignals Team

          Reply

Leave a Reply Cancel reply

Your email address will not be published. Required fields are marked *

Primary Sidebar

Get Big Money Insights for FREE

Want to know where the Big Money is headed?

Just enter your email address below. You'll get our FREE NEWSLETTER sent directly to your inbox.

We call it Big Money Insights... It’s your weekly sneak peek at the powerful market-moving forces that are hidden from 99% of investors.

"*" indicates required fields

This field is for validation purposes and should be left unchanged.

Categories

  • All
  • Big Money Insights Weekly
  • Big Money Series
  • Macro Insights
  • MAP In The Media
  • Members Only
  • Performance
  • Podcast
  • Special Reports
  • Stocks
  • Videos & Interviews
  • White Papers

Archives

  • February 2023
  • January 2023
  • December 2022
  • November 2022
  • October 2022
  • September 2022
  • August 2022
  • July 2022
  • June 2022
  • May 2022
  • April 2022
  • March 2022
  • February 2022
  • January 2022
  • December 2021
  • November 2021
  • October 2021
  • September 2021
  • August 2021
  • July 2021
  • June 2021
  • May 2021
  • April 2021
  • March 2021
  • February 2021
  • January 2021
  • December 2020
  • November 2020
  • October 2020
  • September 2020
  • August 2020
  • July 2020
  • June 2020
  • May 2020
  • April 2020
  • March 2020
  • February 2020
  • January 2020
  • December 2019
  • November 2019
  • October 2019
  • September 2019
  • August 2019
  • July 2019
  • June 2019
  • May 2019
  • April 2019
  • March 2019
  • February 2019
  • January 2019
  • December 2018
  • November 2018
  • October 2018
  • September 2018
  • August 2018

Follow us on Twitter

MAPsignals Follow 1,449 1,070

MAPsignals is a data platform that tracks institutional money flows in stocks and ETFs. Sign up for free insights here: https://t.co/SaAVHjKC9J

mapsignals
mapsignals avatar; MAPsignals @mapsignals ·
19h 1622987016957820928

One of my favorite #dividend #stocks having a day - Skyworks Solutions $SWKS - owned it for years

The $2B buyback is pretty significant given the market cap is sub $19B

#Semiconductors continue to see major inflows

Reply on Twitter 1622987016957820928 Retweet on Twitter 1622987016957820928 0 Like on Twitter 1622987016957820928 2 Twitter 1622987016957820928
Load More...

Footer

© 2021 Mapsignals.com

  • Home
  • Contact & Disclaimer
  • Privacy Policy
  • Terms & Conditions
  • Opt-out preferences
  • FAQ

Copyright © 2023 · Mai Law Pro on Genesis Framework · WordPress · Log in

✕
What Happened to Risk Assets White Paper is Here

Get your copy here and take a journey through our thoughts on margin and leverage.

Enter your email address below and you'll get our FREE NEWSLETTER sent directly to your inbox. 

 We call it Big Money Insights... It’s your weekly sneak peek at the powerful market-moving forces that are hidden from 99% of investors.