
Stock Market Selloff Is Off the Charts
The level of damage is reaching epic levels.
The stock market selloff is off the charts.
In 2022, the stock market is off to an ugly start. The S&P 500 is off 10.2% and the NASDAQ is down 15.3%. In a tape like this, just about all stocks are under pressure.
And while value stocks have been one of the best areas YTD, the level of selling seen this week is some of the biggest we’ve ever witnessed. Over 30% of the universe we track was sold. That’s extreme.
It’s rare to see this amount of red. Most of the time it screams opportunity. Today we’ll cover the Big Money landscape and put 2022’s selloff into perspective…and what it likely means for stocks going forward.
Let’s first look over the data.
Stock Market Selloff Is Off the Charts
The world is facing a barrage of problems. Some of the biggest issues are rising interest rates, out-of-control inflation, a war, and ever-increasing commodity prices. It’s a perplexing time indeed.
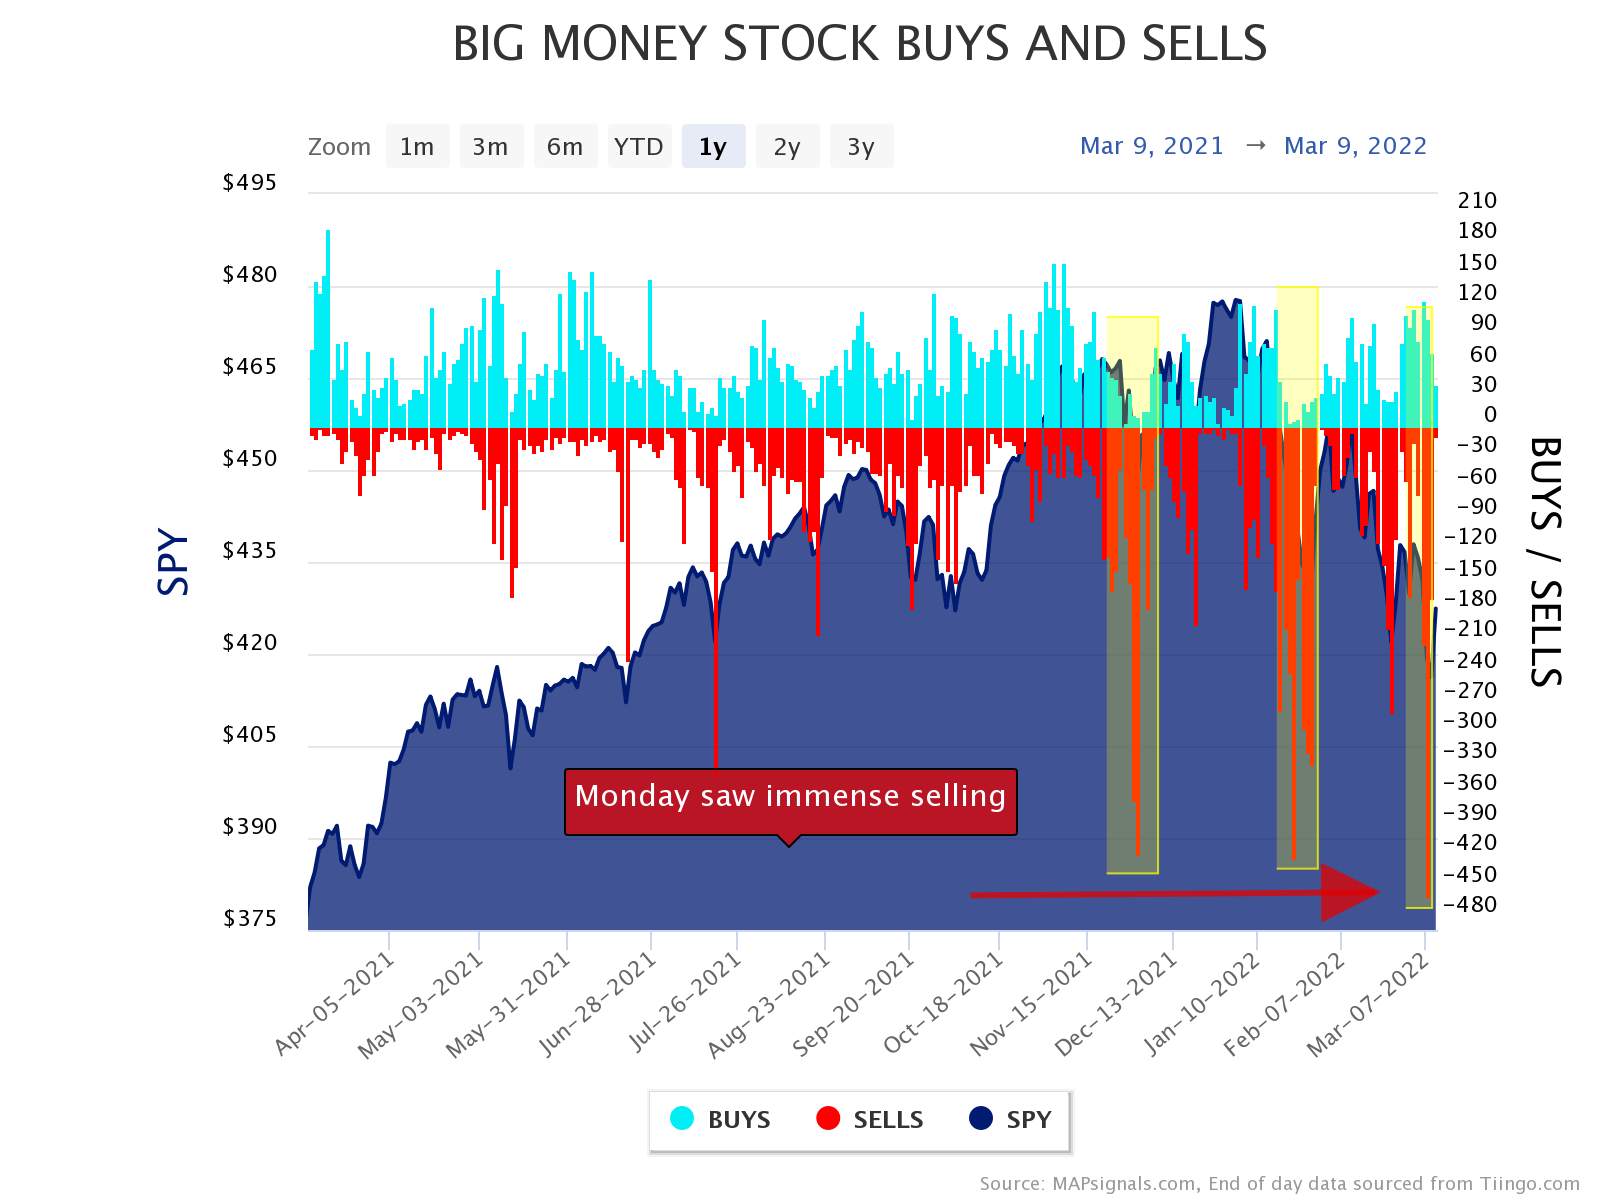
Investors are worried. Monday’s selloff trigged tons of selling.
So, get this, out of 1339 stocks that traded on big volumes, 461 logged sell signals.
To put that into context, nearly 35% of the institutional universe we track… was sold. That’s a big selloff to say the least.
In fact, it eclipsed the huge days of selling we saw recently back on January 21st and December 1st. Monday was the single biggest day of selling since the pandemic lows. Have a look:
But let me put that into context compared to the pandemic. As you can see, it wasn’t anywhere close to the red we saw back in March of 2020:
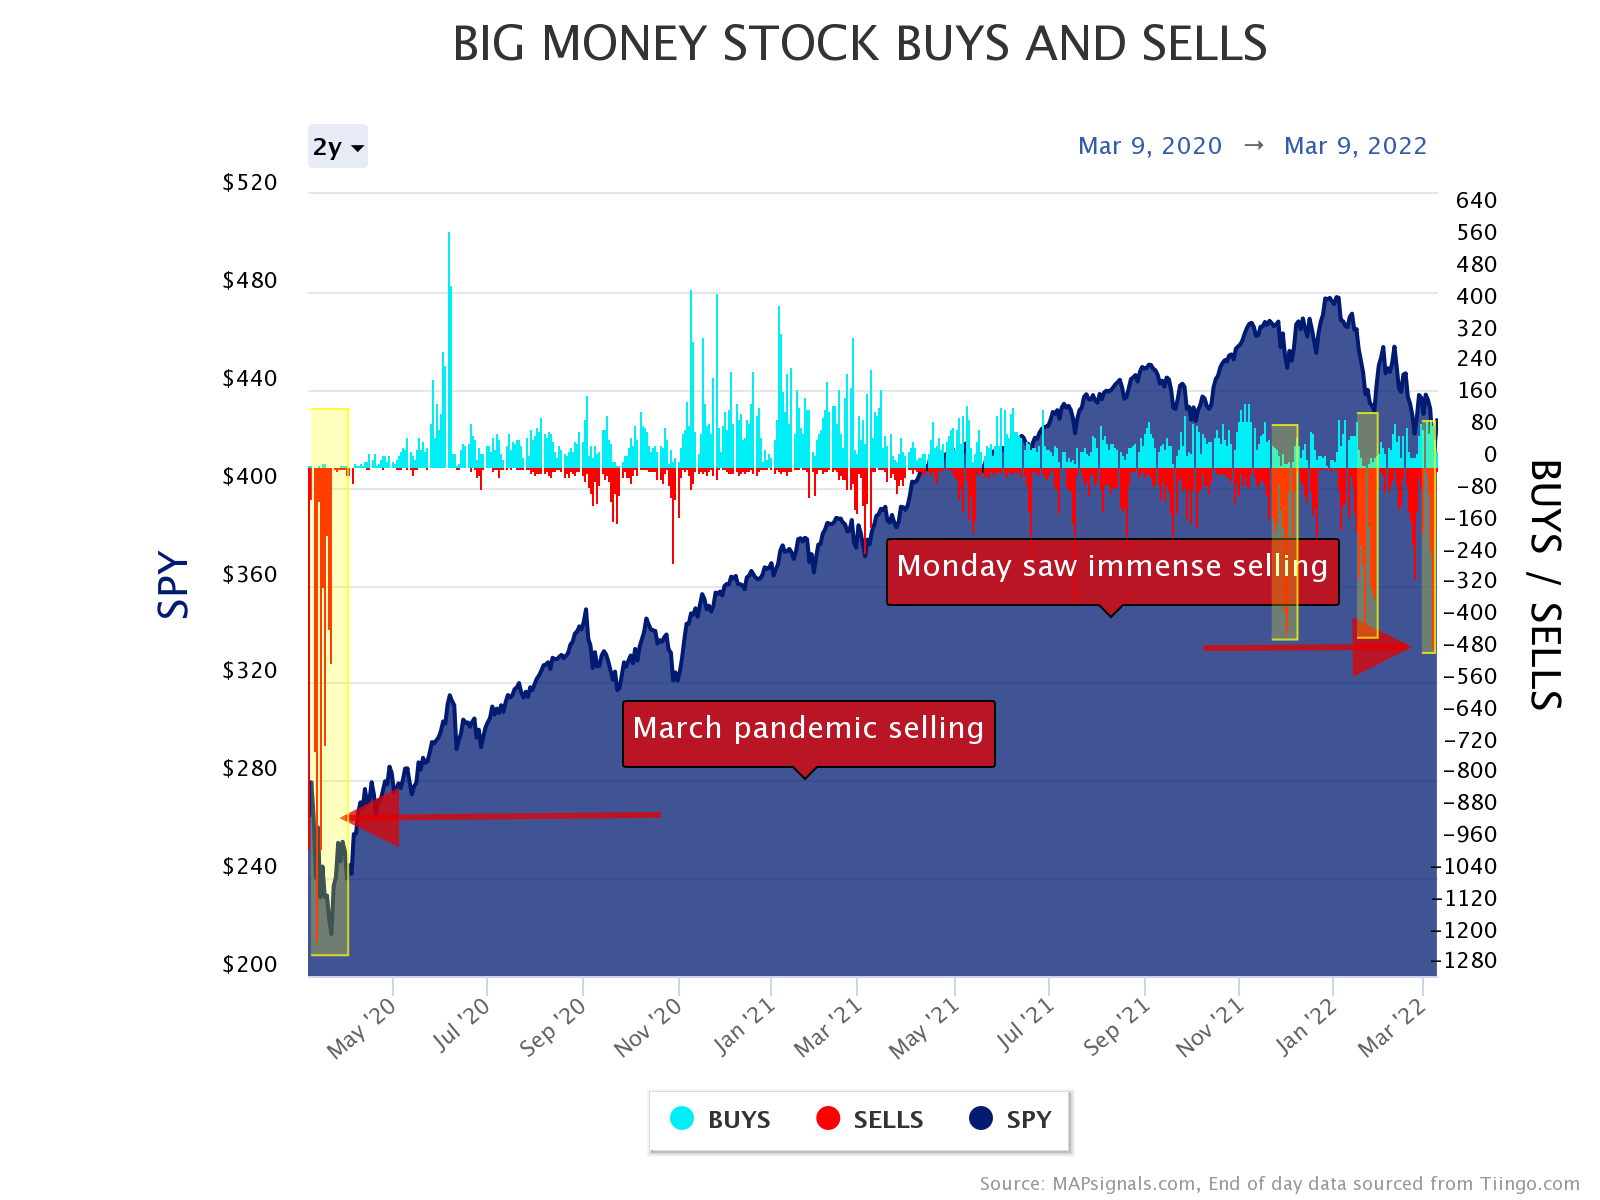
This week has been awful for long-only investors. This chart alone shows how the stock market selloff is off the charts. Clearly, we’ve seen similar kinds of selling before.
But the million-dollar question is where do we go from here? To help answer that, let’s turn to data for clues.
Massive Stock Market Selloffs and Forward Returns
When I woke up Tuesday morning, I didn’t expect to see this amount of selling. From a guy that looks at data every day, this was extraordinary.
And it got me thinking, “What does the market do after monster sell days?” So, I did a study. And believe it or not, you should expect greener pastures after wicked selloffs like this.
Here’s how I constructed my study. I went back in our data and singled out days where there were at least 400 stocks were sold in a day. I was really hunting down the ugliest sell days. And that usually means to look for days where 30% of our universe gets sold.
What I found was that since 2002, we’ve had 61 actual days with this amount of selling (including Monday). So, it’s a rare event to say the least.
Here’s a quick summary. Below are the 1 week, 1-month, 3-month, 6-month, and 12-month forward returns for the S&P 500 (SPY ETF) after a similar selloff to Monday:

Source: MAPsignals, FactSet
Right off the bat, you can see that a week later, stocks were flat on average. But it’s very bullish looking out 3-12 months. Considering that stock markets average a 10% return each year, after this signal you can expect double that at 20%.
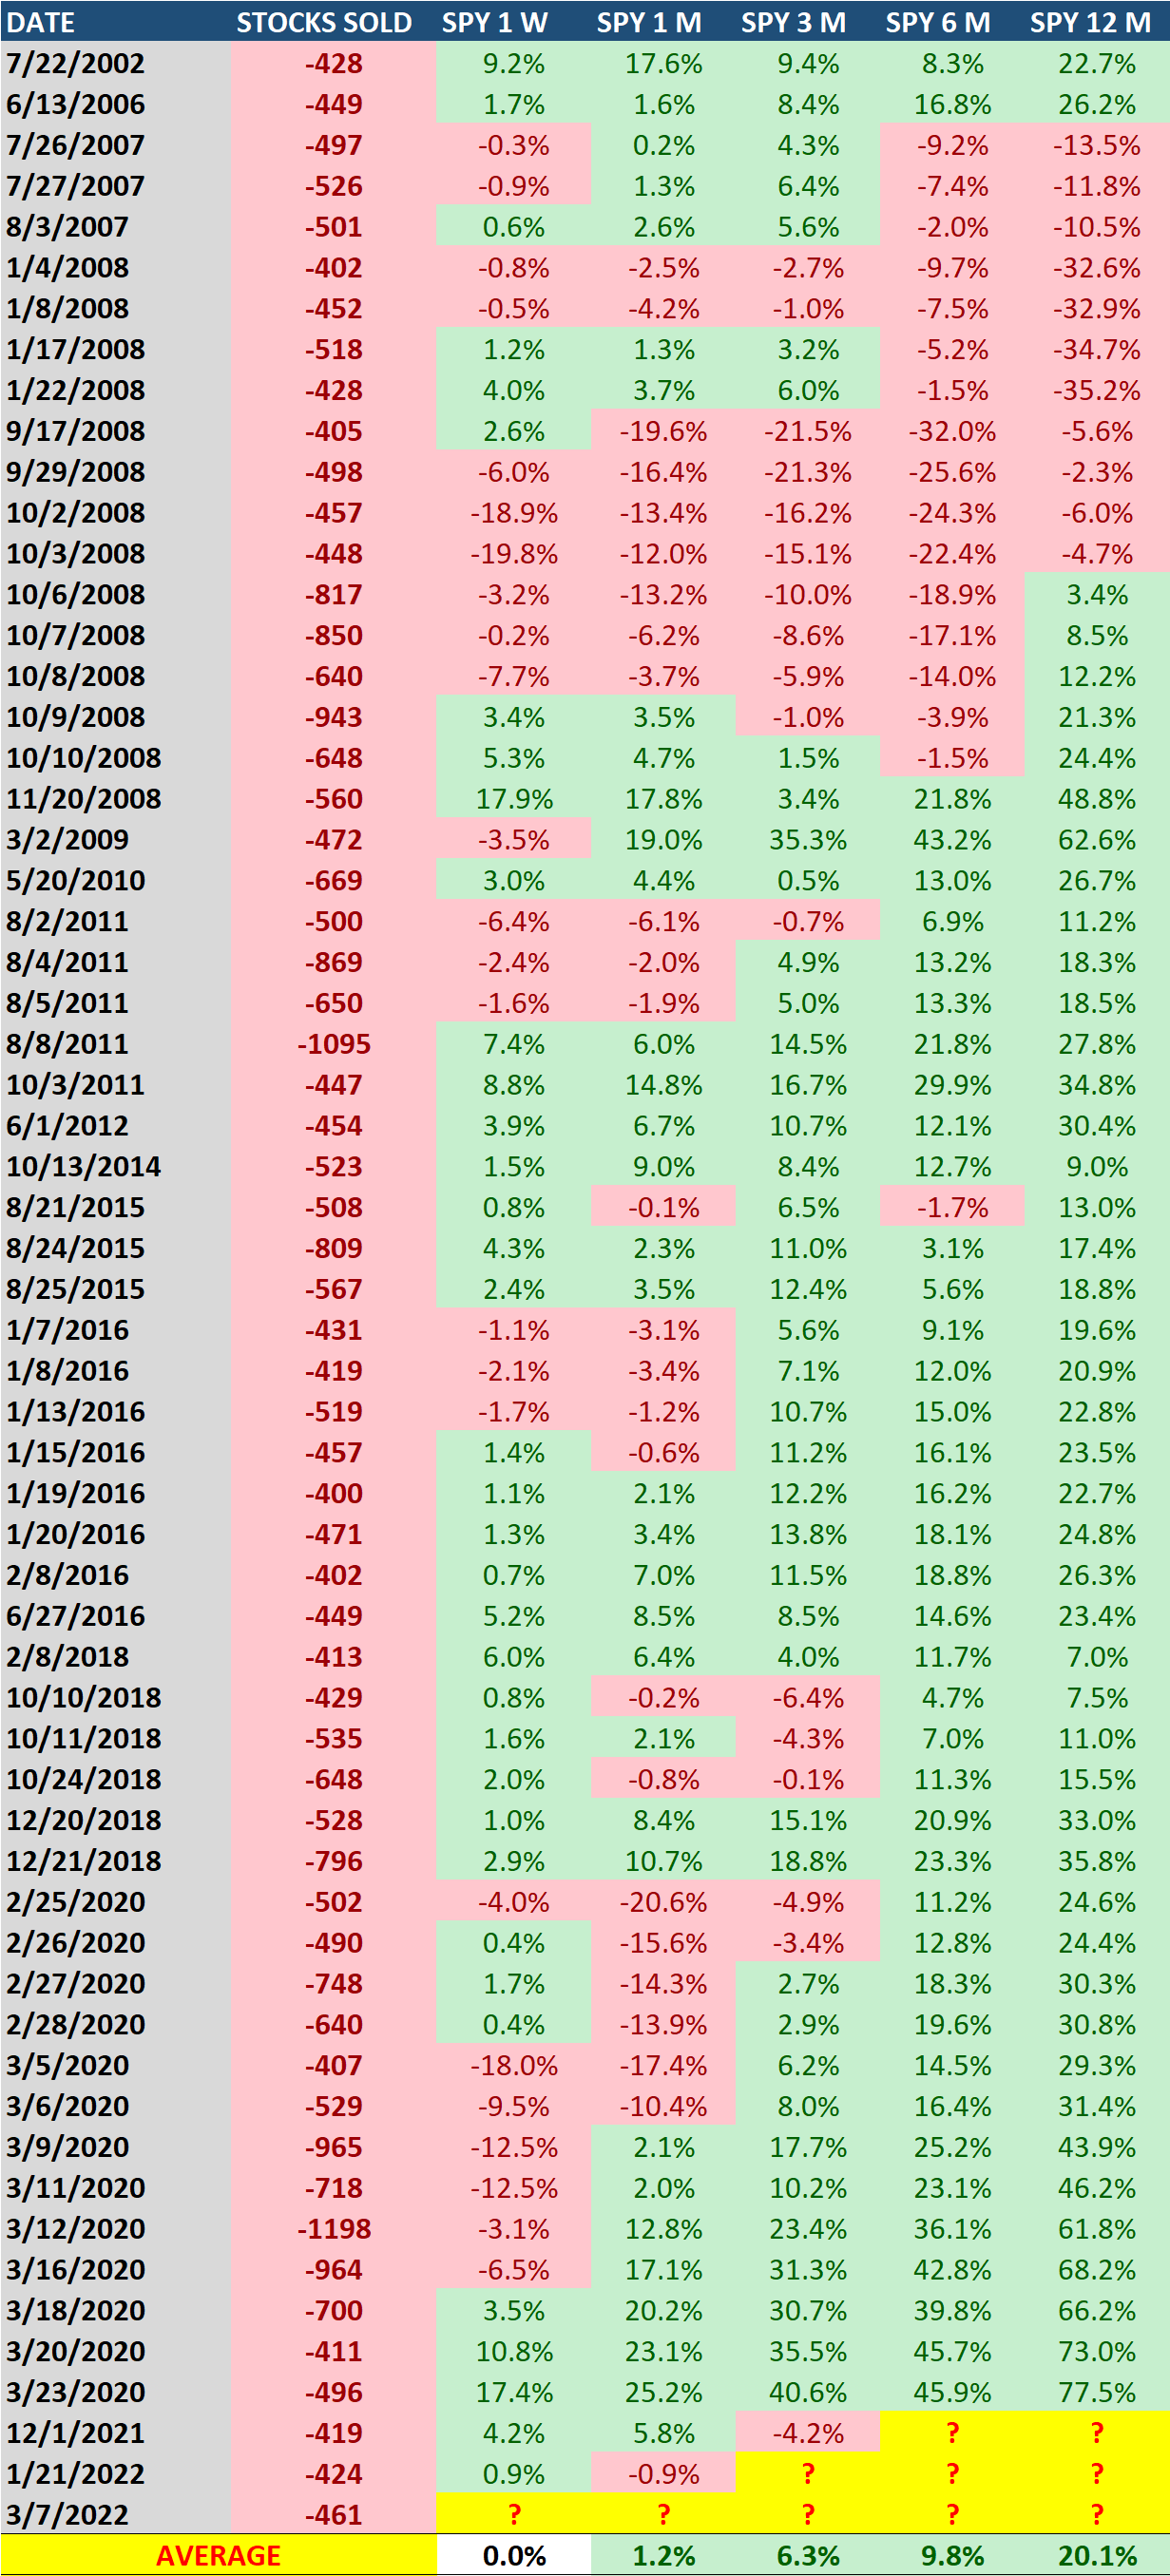
So, does that mean the all-clear is here for stocks? Of course not. But, from a data standpoint, you can’t argue with the historical average. Let’s look at all 61 instances: (Click image to enlarge)
Source: MAPsignals, FactSet
At first glance, you should notice a ton of green. Over nearly 20 years, it’s paid off to buy stocks after such a selloff. 47 out of the 58 times (once a year has passed), investors have been rewarded to buy the dip. That’s batting 81%.
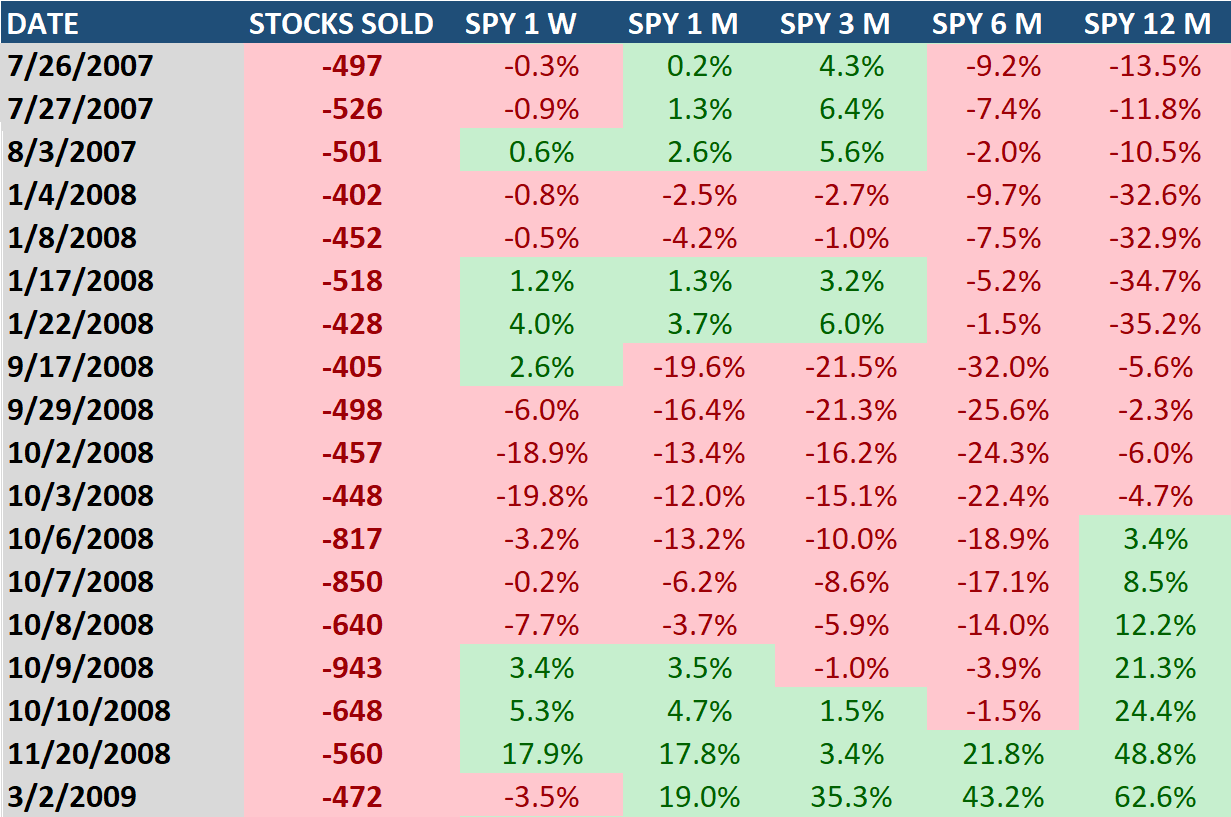
The only time this level of selling prefaced darker days was in 2007 – 2008. The Global Financial Crisis was one of the worst selloffs ever. Below you can see what I mean. There was a stretch where 12-month returns were quite negative.
Below I’ve singled that area out. I was sitting on a Wall Street trading desk during this time…it was a painful time:
Source: MAPsignals, FactSet
Some of the darkest moments in recent history were in 2008. You can see how selloffs in January, September, and October 2008 led to a lot more selling 12 months later.
Will this selloff be more of the greener kind or will it end in a 2008 style event? Only time will tell. It’s important to be informed. The great news is that any other period outside of 2008 ended up seeing a massive rally.
So, does this selloff get me more bullish than last week? Yes it does.
Based on history, over 80% of the time markets are higher a year from now…and a lot higher at that. History says that betting on stocks now, is worth the shot. Outside of a major financial crisis, stocks usually find their footing.
So, when I see that the stock market selloff is off the charts…I start looking for bargains. Prior outliers are on sale. Great companies are on sale.
Eventually, Big Money investors are going to chase awesome stocks again, the ones that grow their sales and earnings year after year. I personally don’t want to miss out when that time comes.
Let’s wrap up.
Here’s the bottom line: the stock market selloff is off the charts. It’s one of the worst pullbacks I can remember. But, I choose to focus on the positives. Based on 20 years of history, 81% of the time stocks are higher a year from now.
I say look for opportunities. Take your time, too. Find a process that makes sense for you. It won’t always be doldrums for stocks. Proactive investors will come out ahead in the end.
And if you’re looking for data to help your investing, consider a MAPsignals subscription to help your process.
You all hang in there.
***And if you want even more cool data, check out my latest video: Best Growth Stocks to Buy Now for March 2022. I use our data to spot 5 potential opportunities.
Always remember that the process is more important than the picks.
Make sure to follow our YouTube channel here so you never miss any of our videos. If you enjoy these Big Money Insights, tune in each Sunday for my Big Money recap.
Also, you can find our other videos here.