
Stocks Are Setting Up For More Highs
They say the trend is your friend. Well we say, the Big Money trend is your friend.
And looking at Big Money data, stocks are setting up for more highs.
For weeks, we’ve been harping on the blastoff coming for growth stocks. In May, our data suggested that growth stocks are climbing back. And boy have they!
The NASDAQ 100 (QQQ ETF) rose 6.6% since we made that call on May 27th…easily trouncing the S&P 500’s (SPY ETF) gain of 2.43%. We didn’t make that bullish call based on feel…we interpreted the data.
That’s been the key to staying ahead of the market’s next moves for us since 2007. That’s why we always say, “don’t follow the news, follow the Big Money!”
And right now, our data has a clear message: Stocks are setting up for more highs.
Big Money Index Stocks Are Setting Up For More Highs
Each week we like to start from the top and work our way down. The Big Money Index tells us the overall flow of money in and out of stocks.
And the BMI has been rising, which means, there’s a healthy bid for stocks…
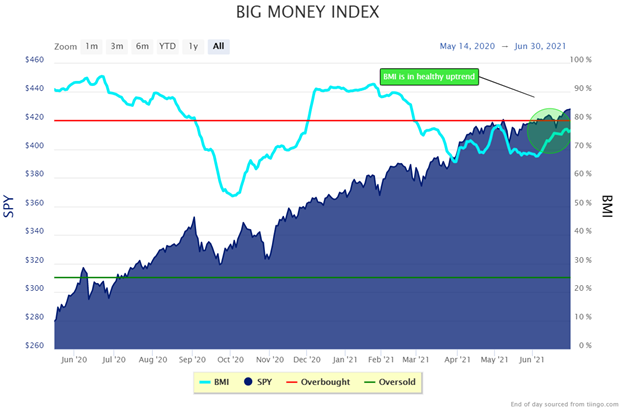
The chart shows us 2 important things:
- The BMI’s trend is up
- It’s nearing overbought
First off, you want to be on the right side of the BMI. If it’s heading up, to us that means be long stocks.
But we’re approaching that red overbought area. Once it breaks out above 80%, we are officially overbought. But that doesn’t mean we are immediately due for a pullback. The key to an overbought BMI is to pay attention to when the index starts falling. That’s the clue that the rally may be losing steam.
But, let’s keep diving deeper.
Stocks and ETFs See Inflows of Big Money
Below the surface of the BMI are stocks. The index is constructed on a 25-day moving average of buys and sells. Below you can see the daily trend in our Big Money Stock Buys & Sells chart.
There is healthy buying going on:
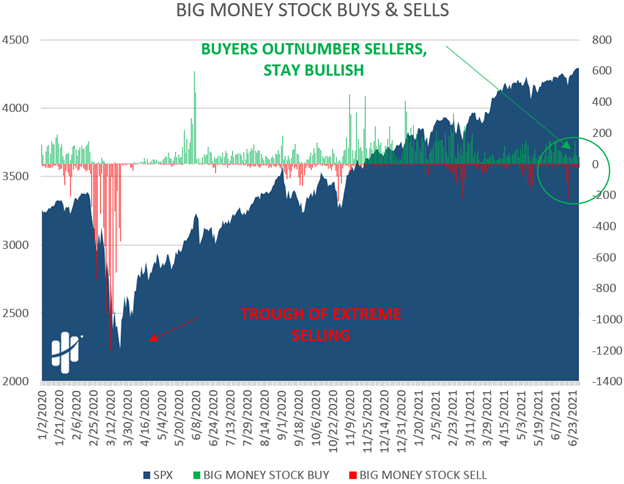
Buyers beget buyers. This trend can also be seen in ETFs.
A strong bull market will have more ETFs being bought than sold. We can see that’s clearly the case in our ETF Buys & Sells Chart:
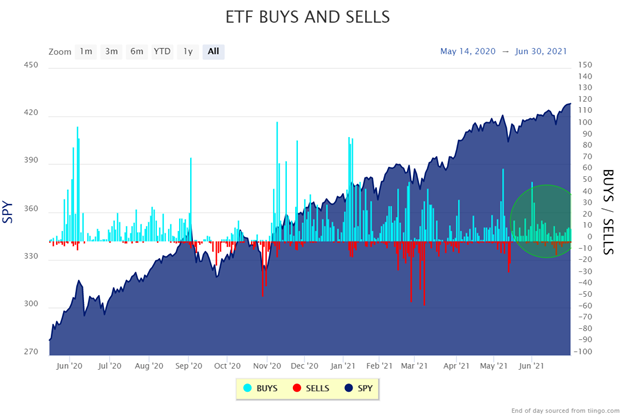
That circled buying is what we call the juice!
So, which ETFs are getting bought you ask? Let’s start with the iShares Core S&P 500 ETF (IVV). If the S&P 500 is making new highs, it stands to reason that buyers would jump in this ETF.
And they are. You can see all of the green signals this past year. That’s the stairway to heaven! Notice how there’s not a single sell signal in the past year:
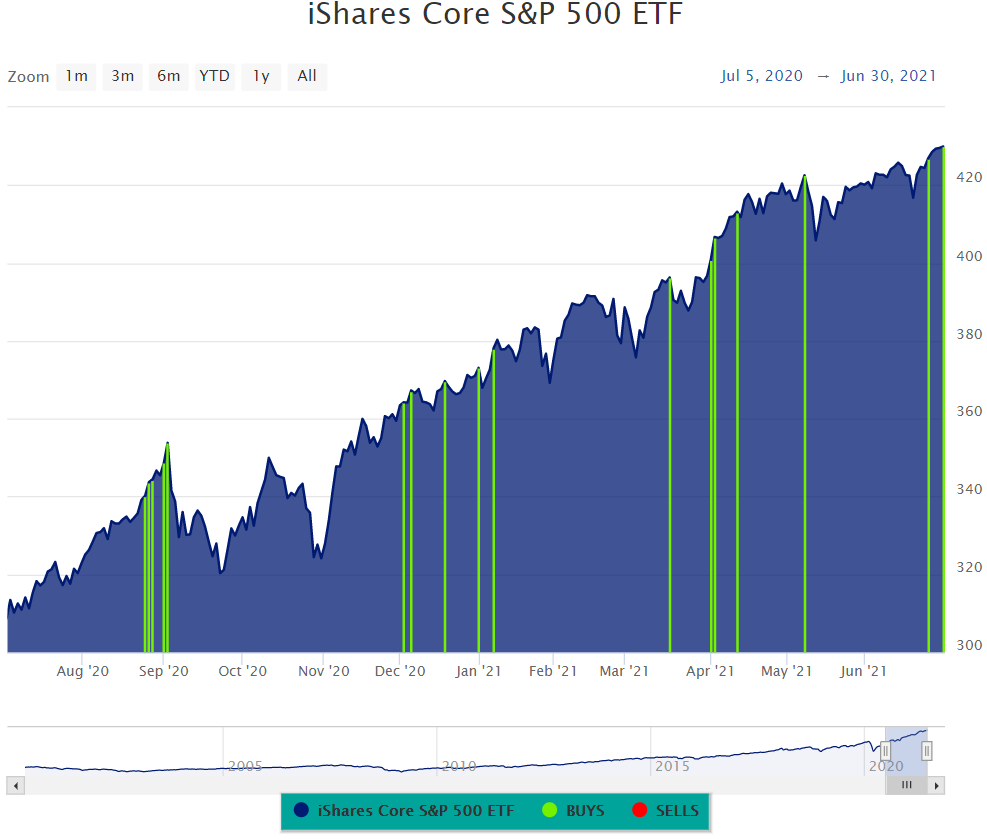
That just shows how strong this rally has been.
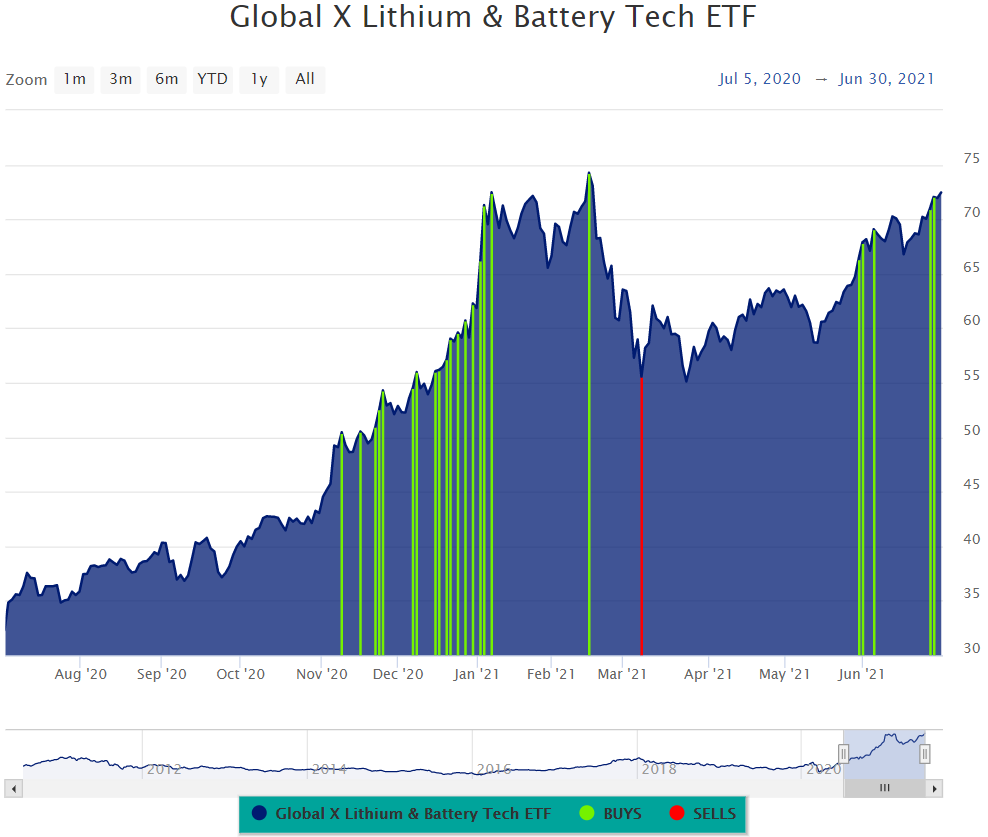
Up next is the Global X Lithium & Battery Tech ETF (LIT). Clearly many of the stocks in this fund are ripping higher with Big Money:
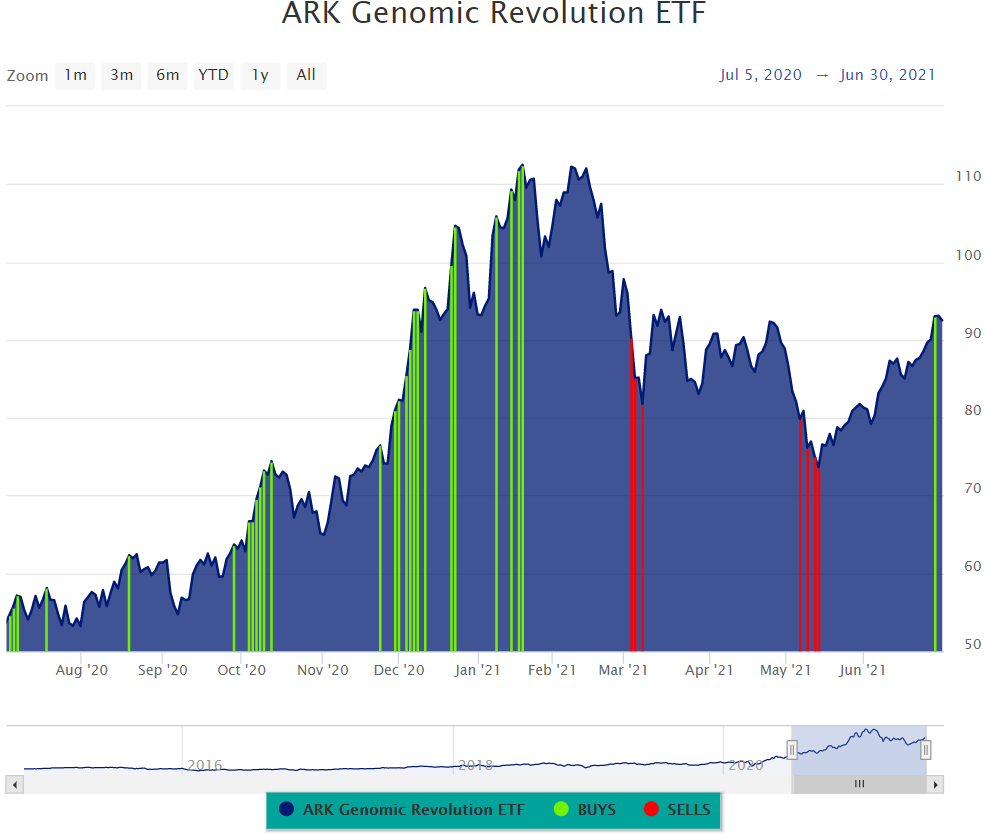
And finally, Cathie Wood’s ARK Genomic Revolution ETF (ARKG) is getting the love too. You can see how it was getting pounded months ago during the growth scare.
Looking back, that may have been a great time to go shopping. Buyers are showing back up as you can see off to the right:
So, why am I telling you all of this? It’s because our data tells us all we need to know: stocks are setting up for more highs.
Let’s wrap this up.
Here’s the bottom line: The Big Money Index is trending higher, stock and ETF buying is robust, and growth ETFs are getting the juice. That’s a great narrative for further upside folks.
Until the data changes, we’ll lean long and strong. It’s the only way to play in a big bull market.
Finally, our latest Big Money 20 report for the 1st half of 2021 is here.
The Big Money trend truly is your friend!
Finally, if you want more, check out our latest video from Luke: Best Dividend Stocks for July 2021. In it, he shows why it pays to focus on dividend growth stocks for the long-term.