Summer’s Over
Labor Day has come and gone and in the North-East. That means that it’s time to get back to the real world. Summer’s over.
September normally means Wall Street traders return to “work-mode”, and we were eager to find out if that would be true during this pandemic year which is anything but normal.
So when Tuesday came, it was a painful reminder of how fast summer can end, and how fast risk can change. No doubt Tumbleweed Tuesday brought the blues to many traders wrapping up their vacations.
That’s the Tuesday after Labor Day out in The Hamptons where Wall Streeters go to relax and play. After Labor Day, the rosé dries up and they all head back to the city. They say that the towns get so quiet that all you hear are tumbleweeds rolling down the streets.
Market veterans know that when things get quiet in stocks, watch out! Traders need action and volatility. The big summer bull market made things too easy. But Tuesday’s message was clear: Summer’s over…time to get back to work.

Summer’s end is a great excuse, but we know the real reason for the market drop was from too much froth and greed. We saw that last week looking at ETFs. The summer’s official close just allowed crabby traders to take advantage of complacent and unsuspecting day-traders.
But before you get bearish, you should know plenty of “buy the dip” believers still remain… MAPsignals firmly being one of them.
Summer’s Over, Pay Attention To Big ETF Buying
Remember, last week we told you about the market’s Animal Spirits. Big Money was howling at the moon. We saw it clearly in ETFs: we always pay attention to big ETF buying.
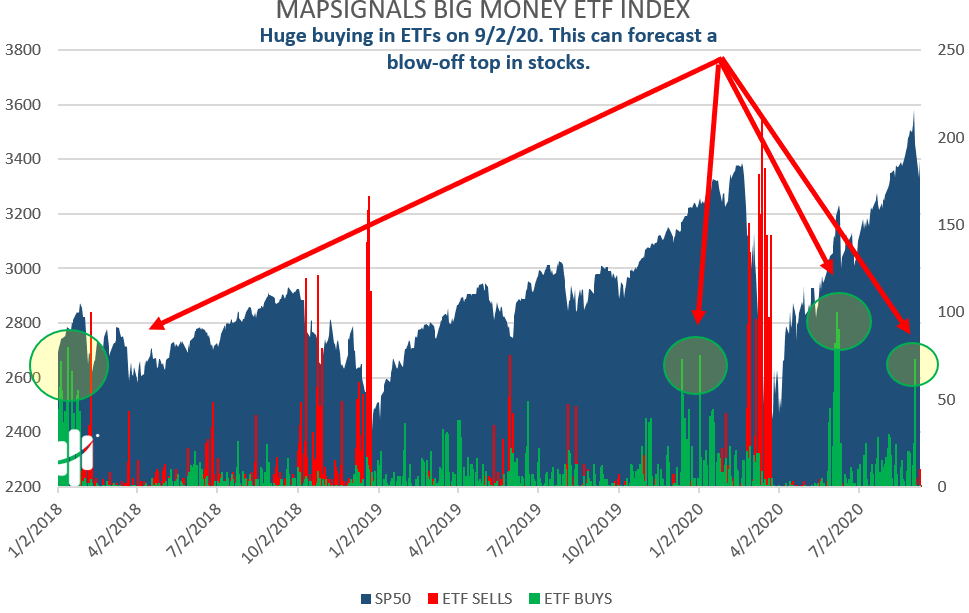
Below is the Big Money ETF Index which shows net buys and sells of ETFs each day. When we see big green bars, that huge buying can mean a blow-off top is near.
What Is a blow-off top? Investopedia defines a blow-off top as a chart pattern that shows a steep and rapid increase in a security’s price and trading volume followed by a steep and rapid drop in price usually on significant or high volume as well.
That looks a lot like these circles:
There’s a reason we get bearish near-term after huge retail buying. Below are the forward returns for the S&P 500 immediately after a very big buy day in ETFs. We’ve only had 10 historical days with 70 or more ETFs being bought in our 30-year history (back-tested) starting before ETFs even existed:
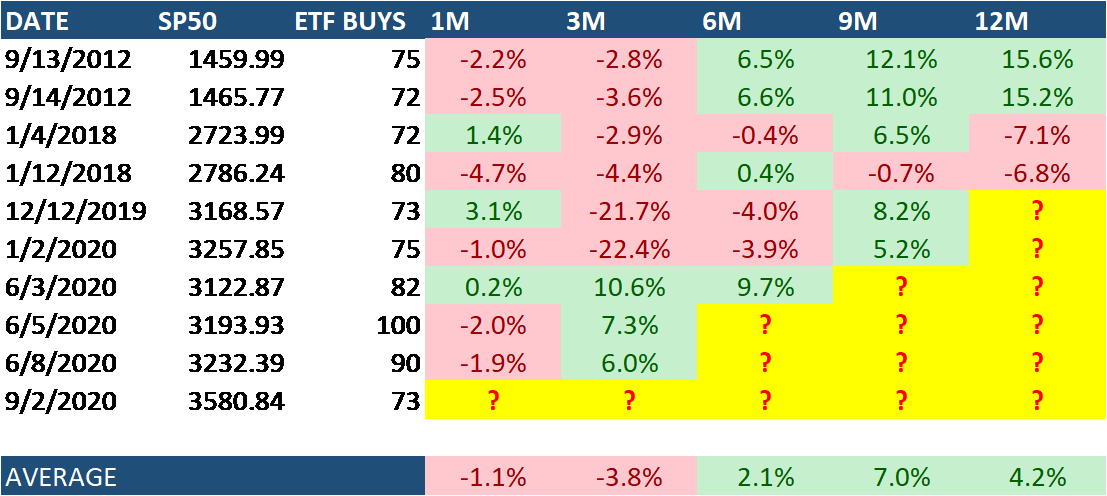
Source: MAPsignals, FactSet
Now, keep in mind that 2 of these days were back in December of 2019 and January of 2020 prior to the huge drop in March. But regardless, the returns are rather muted.
The signal worked like a charm this go ‘round. At MAPsignals, we’ve observed that there tends to be an inverse relationship to big ETF buying and stocks.
We think that it was the perfect setup for the grumpy, Summer’s over, traders.
But, let’s look at another data point that was flashing a red warning light.
Big Money Index Heads South
In a big bull market, it can be challenging to anticipate a pullback with accurate timing. That’s why we are patient. We knew not to jump in to call a top. We knew to allow the already heavily overbought market even more room to run.
The Big Money Index has slowly been heading south. With the addition of ETF froth, it made the case stronger for an imminent pullback. Check out where the BMI sits now:
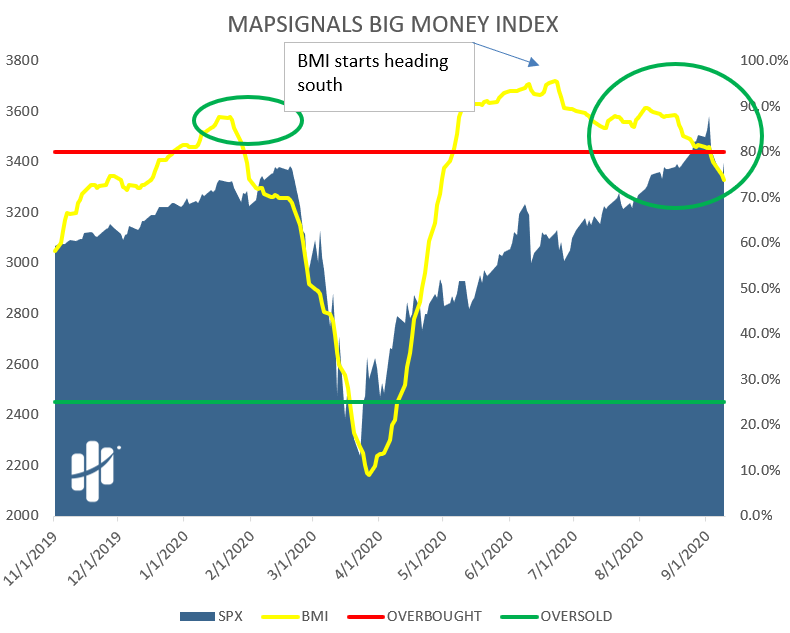
The BMI has been trending down for a while. And it recently finally fell out of overbought territory. Despite the optics and implications of lower market prices, recent action actually suggests that there’s a healthy bid for stocks on decent pullbacks. Meaning the 4% kind we saw late last week and Tuesday.
But, we still aren’t necessarily out of the woods, yet. Even though Summer’s over, the vibe tends to last for a few weeks.
Sector Selling To Watch
It’s like being on summer vacation as a kid. When he’s been at the beach so long, he forgets home. Stocks were in solid summer vacation fantasy land. They stayed overbought for so long that it’s easy to forget what selling looks like. That happens when you break the record for consecutive days overbought (84 days).
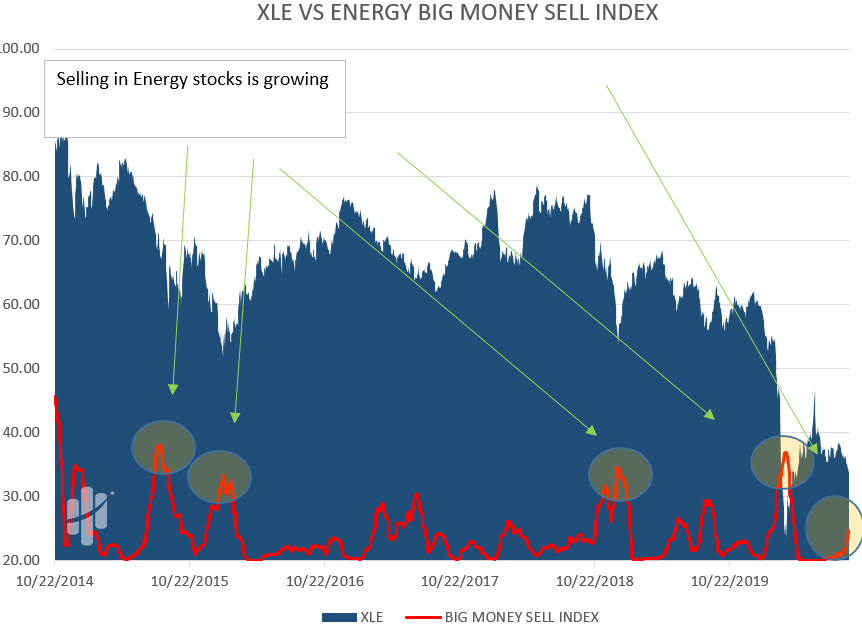
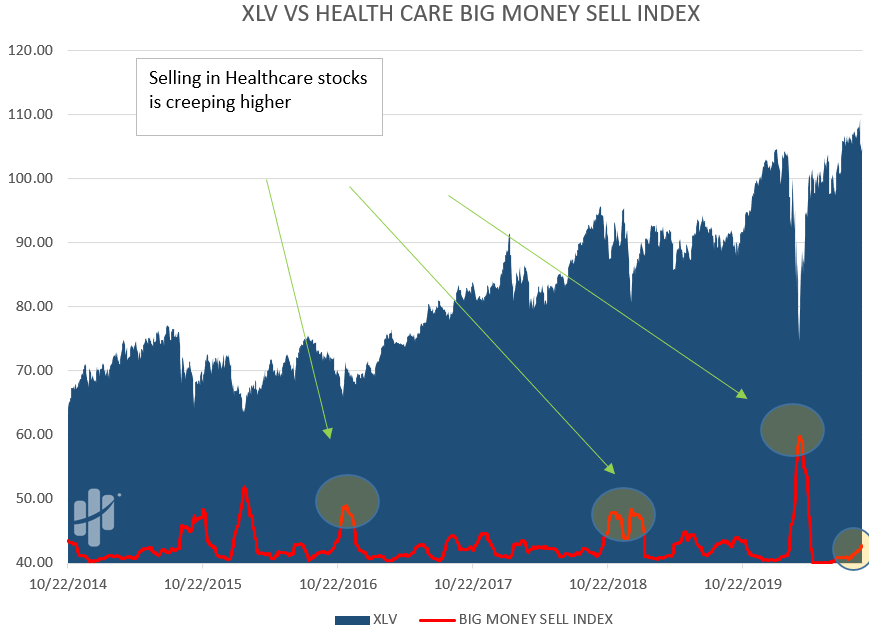
3 sectors are signaling weakness in our data. While they are not major alarms, Energy, Healthcare, & Technology show small signs of sellers appearing.
Below are Big Money Sector Indexes that track the rate of selling. If the red line rises it signals selling is increasing. If it is falls, selling is slowing.
First up is Energy:
Next is Healthcare:
Lastly, Technology:
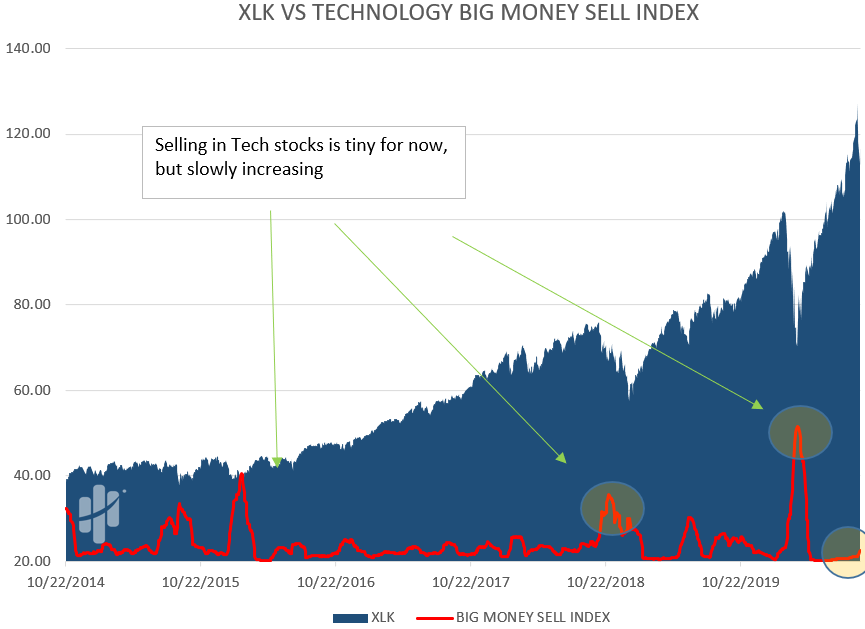
Notice the pickup in selling is small. This partially accounts for the weakness in the BMI, but we aren’t too concerned for now.
Bottom line: It’s easy to get cranky when Summer’s over. But don’t get upset because the market is cranky: it’s a technical selloff. The parabolic rise in the market needed to vent some steam and reset.
The pandemic brought a rise of new day-traders suddenly homebound with stimulus money. Enter a fresh crop of unsuspecting and falsely-confident market bandits. Old pros are using this selloff to teach those newbies a lesson.
The good news for you: buy the dip is still the name of the game.
CHECK THIS OUT – our very own Lucas Downey will be presenting next Wednesday, September 16th at 10:40 AM ET for the MoneyShow Virtual Expo.
He’s presenting, Be in the 1% with Outlier Stocks.
It’s free and you can hear our thoughts on the market and which stocks are on our radar. Click the image below to reserve your seat!