• Menu
  • Skip to right header navigation
  • Skip to main content
  • Skip to primary sidebar
  • Skip to footer

MAPsignals

We map big money.

  • Latest Insights
  • Power of MAP
    • MAP Products
    • MAP System
    • MAP White Papers
    • Videos & Interviews
  • Profit with MAP
  • About
    • About MAP
    • MAP Team
    • Authors
    • MAP System
    • MAP Products
    • Big Money Index
  • Members
    • Get Started With MAP
    • My MAP
    • Big Money Charts
    • MAP View
    • MAP View Options
    • MAP Top 20 Weekly
    • MAP 50
    • Member Updates
    • Platinum Updates
    • Members Only Posts
    • Performance
  • Portal

The Best Offense is a Good Defense

April 18, 2022 //  by Alec Young//  Leave a Comment

There’s no shortage of risks spooking investors these days.

Today, I’ll show you why the best offense is a good defense.

The Best Offense is a Good Defense

Between inflation, rising rates, Fed tightening, the war in Ukraine and a fresh COVID crackdown in China, it’s ugly out there!

But believe it or not, plenty of stocks are doing well. You just need to know where to look. Today, I’ll show you how to get the most out of this challenging market.

To kick things off, I’ll go over which sectors are winning and why. Then I’ll use MAPsignals data to show you how to play it with a best of breed, high-yielding ETF that’s generating big returns in a down market.

The Best Offense is a Good Defense

It rarely pays to get too defensive in the stock market. Most of the time you’ll just watch the parade go by. But recessions are the exception. They spark bear markets because they dent earnings by an average of 25%. Bear markets are worth sidestepping. Since 1929, the median S&P 500 bear market drop was 33% lasting 25 months (chart).

No one has a crystal ball. A recession and a bear market may not happen. But the risk is clearly on the rise. The cheapest time to buy insurance is before it’s obvious you need it.

S&P 500 Bear Markets - What You Need to Know

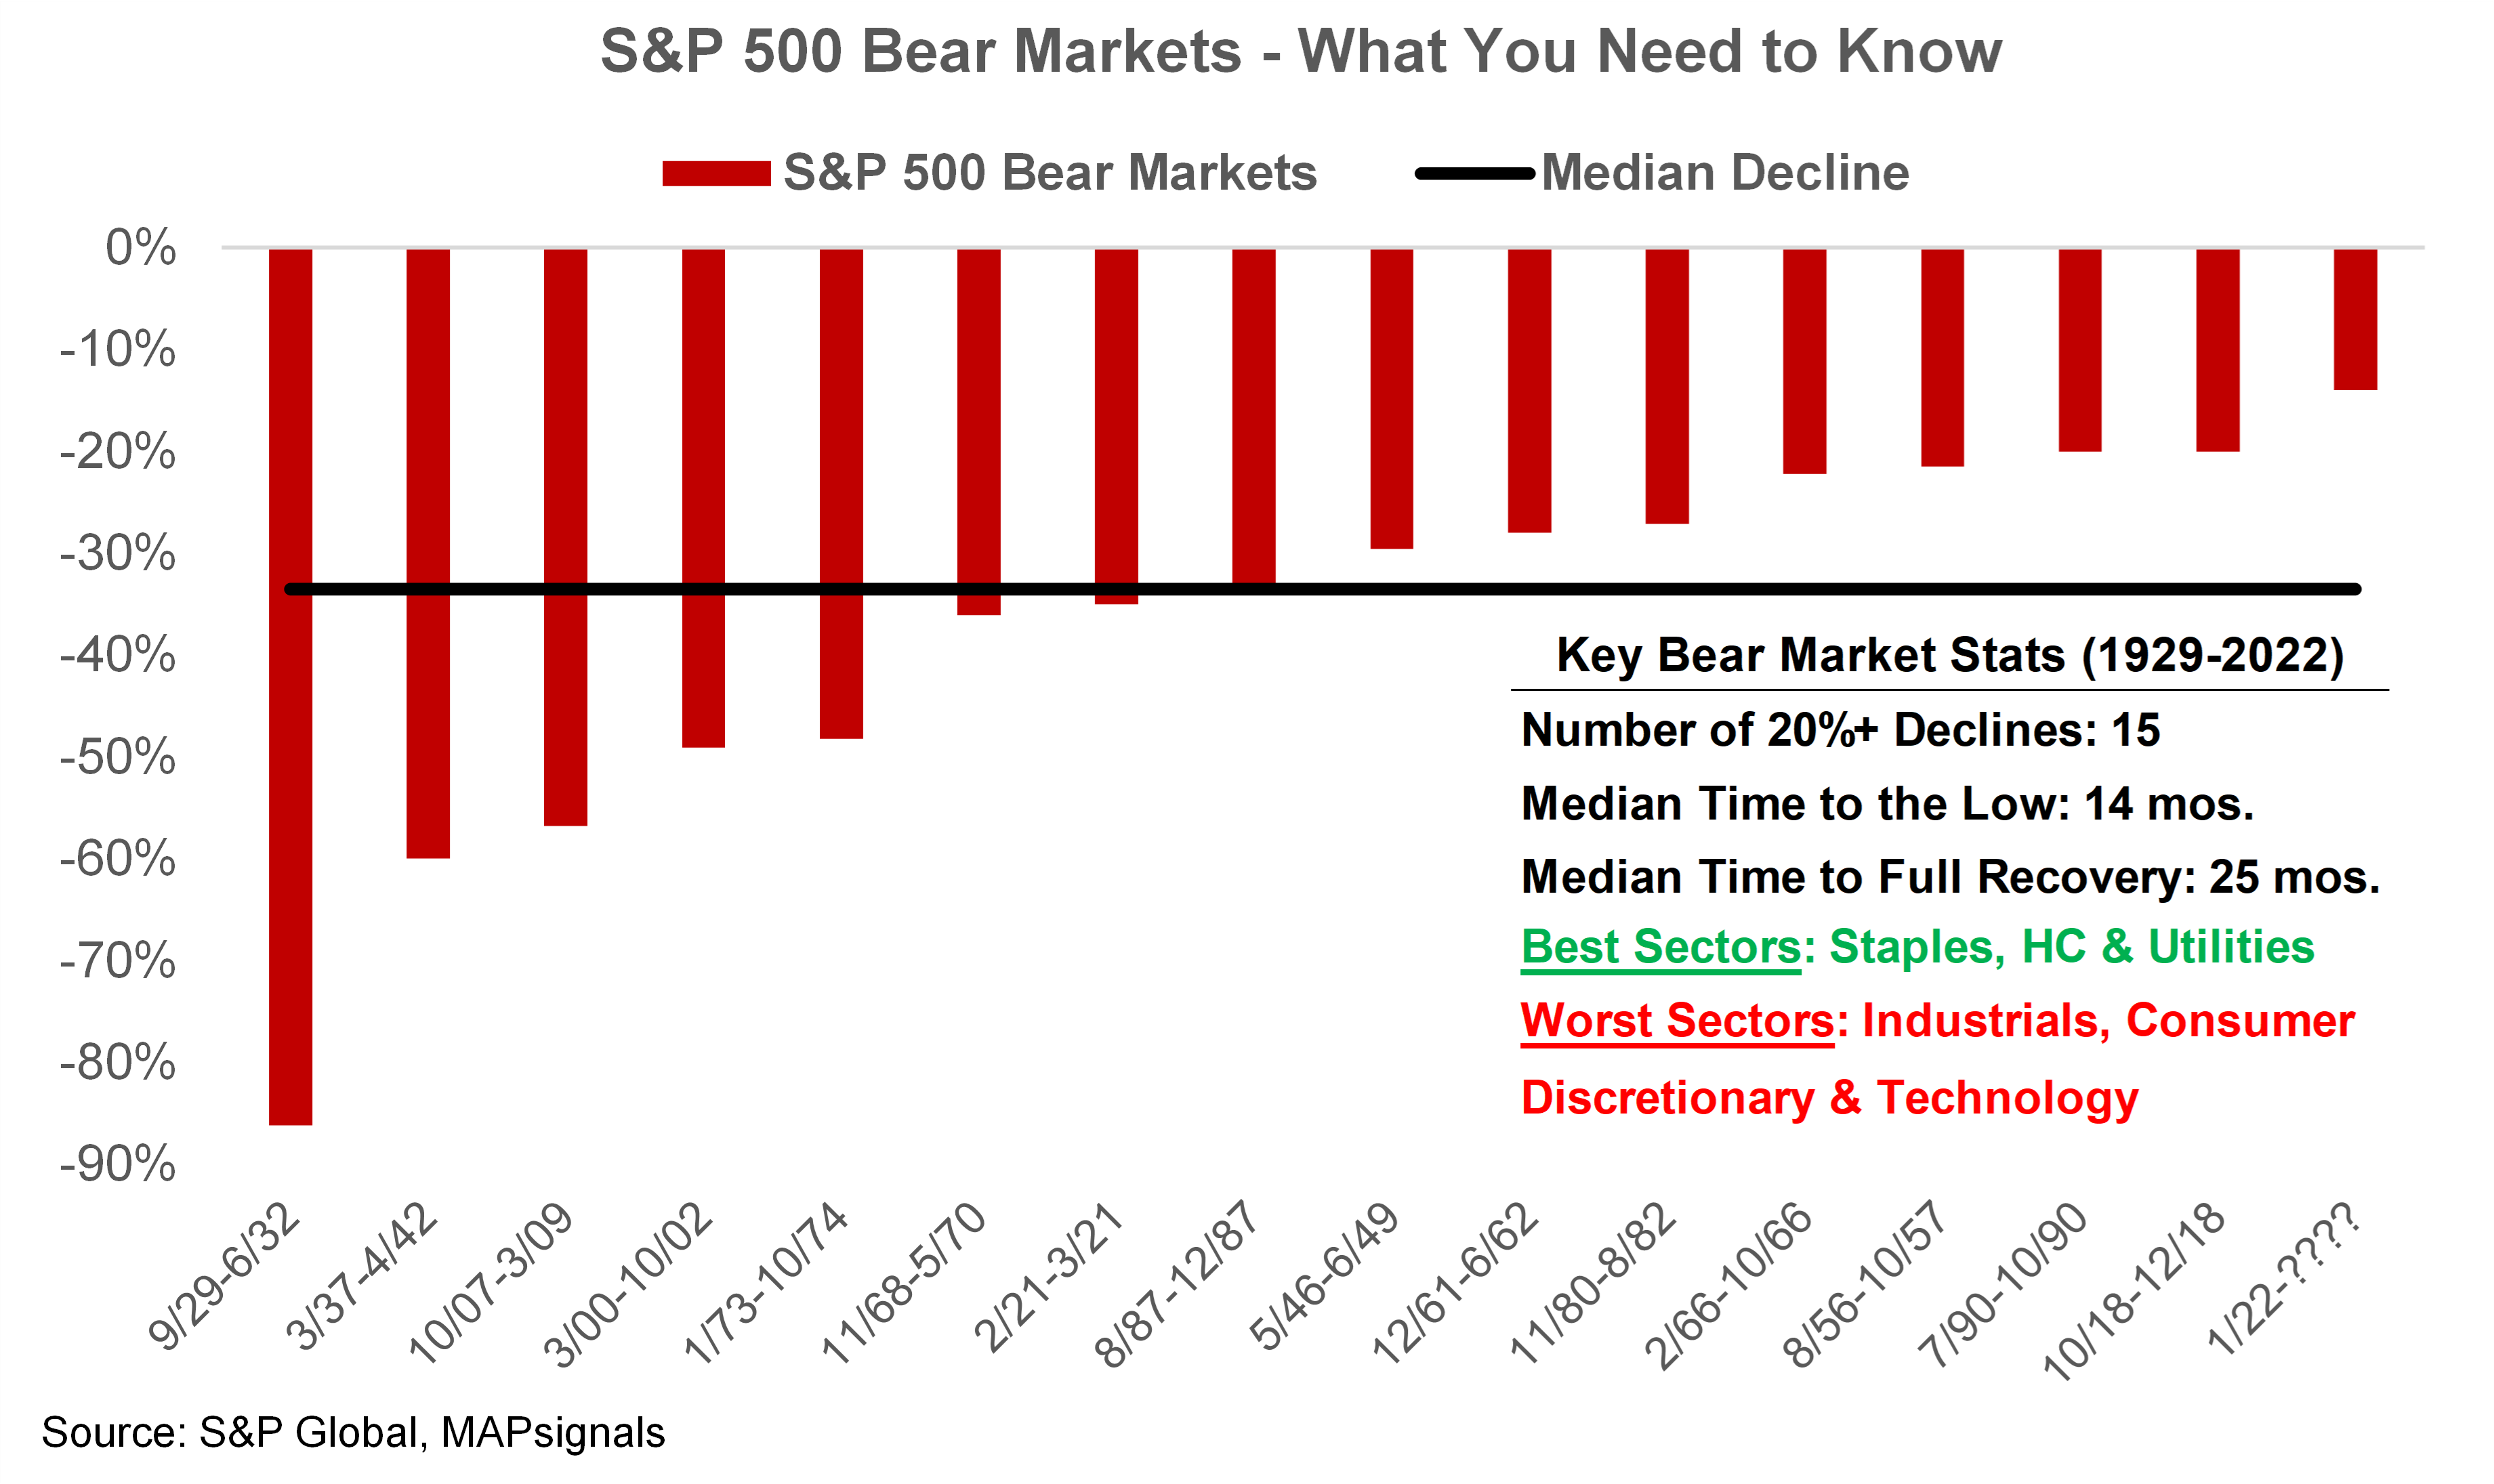
Above, you’ll see that there’s been 15 declines of 20% or more in the market since 1929. The median time to the low is 14 months, while the median time to full recovery is just over 2 years at 25 months.

Here’s your bear market playbook:

With inflation above 8% you’ll lose big money holding too much cash. Instead, target stocks best positioned to generate positive returns in a challenging macro environment. The best offense is a good defense!

  • Focus on high-quality dividend payers that are much less volatile than the S&P 500 Index.
  • Target inflation fighters with pricing power in the energy, materials, and real estate sectors
  • Seek out safer sectors like consumer staples, health care and utilities that consistently outperform during downturns because their profits are less sensitive to the economy’s ups and downs.
  • Keep an above average cash reserve you can use to leg in to cheap, blue chip growth stocks as they decline. Over the long run, you’ll be glad you did!

How to Play It

There are thousands of ETFs out there. Finding the right one can seem overwhelming. The good news is I used MAPsignals to find an ETF that targets exactly what you need to make money in this tough market.

Forget index ETFs and mutual funds. They don’t offer much protection when things turn ugly. That’s because the sectors best positioned to weather the storm only make up 32% of the S&P 500. Inflation fighters like energy, materials, and real estate only total 9% of the S&P, while safer sectors like staples, utilities and health care only add another 23%.

To earn returns high enough to stay ahead of inflation while also limiting your downside, you need a blue-chip basket of low volatility stocks that also pay big dividends. That’s a tough combination to find in one ETF. While there are plenty of well-established ETFs that target either high dividends or low volatility, only one targets blue chips with both attributes.

The Invesco S&P 500 High Dividend & Low Volatility ETF, ticker SPHD, fits the bill perfectly. It targets the 50 least volatile, high yielding companies in the S&P 500 Index. I used MAPsignals ETF ranking process to screen it across key fundamental and technical metrics, and it scored a healthy 59.

Below are the other key positives that jump out at me for this fund.

  • Making fresh all-time highs; generated its latest big money buy signal on April 7
  • 3% annual returns since 2012 inception with 40% less volatility than the S&P 500
  • Juicy 3.5% annual dividend yield with monthly payouts; 5% annual dividend growth since inception
  • Low 0.3% expense ratio
  • Liquid – $3.5B is assets with 1.3M shares of average daily trading volume

And while this is all fine and dandy, the fund has a massive 81% weighting in sectors with the strongest MAPsignals scores: energy, materials, utilities, staples, health care and real estate.

Take a look:MAPsignals Sector Scores

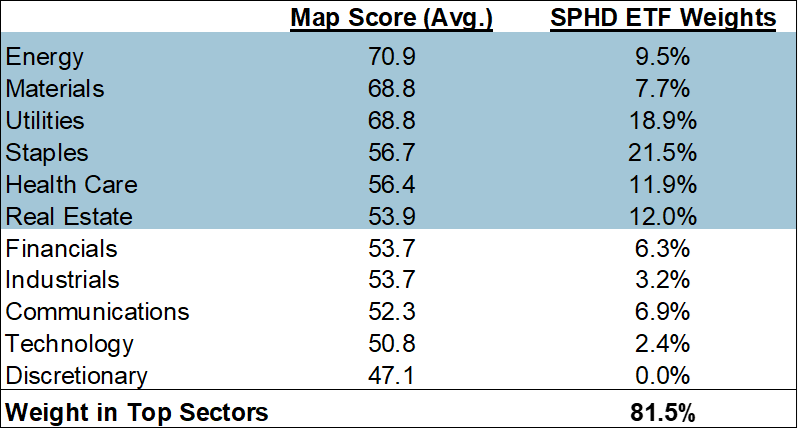
Check out this chart of SPHD. It’s making new all-time highs in this brutal market. Not many diversified portfolios can say that. It’s an important reminder that if you target the right sectors and stocks, you can make money in any market. The best offense is a good defense.Invesco S&P 500 High Dividend Low Volatility ETF (SPHD)

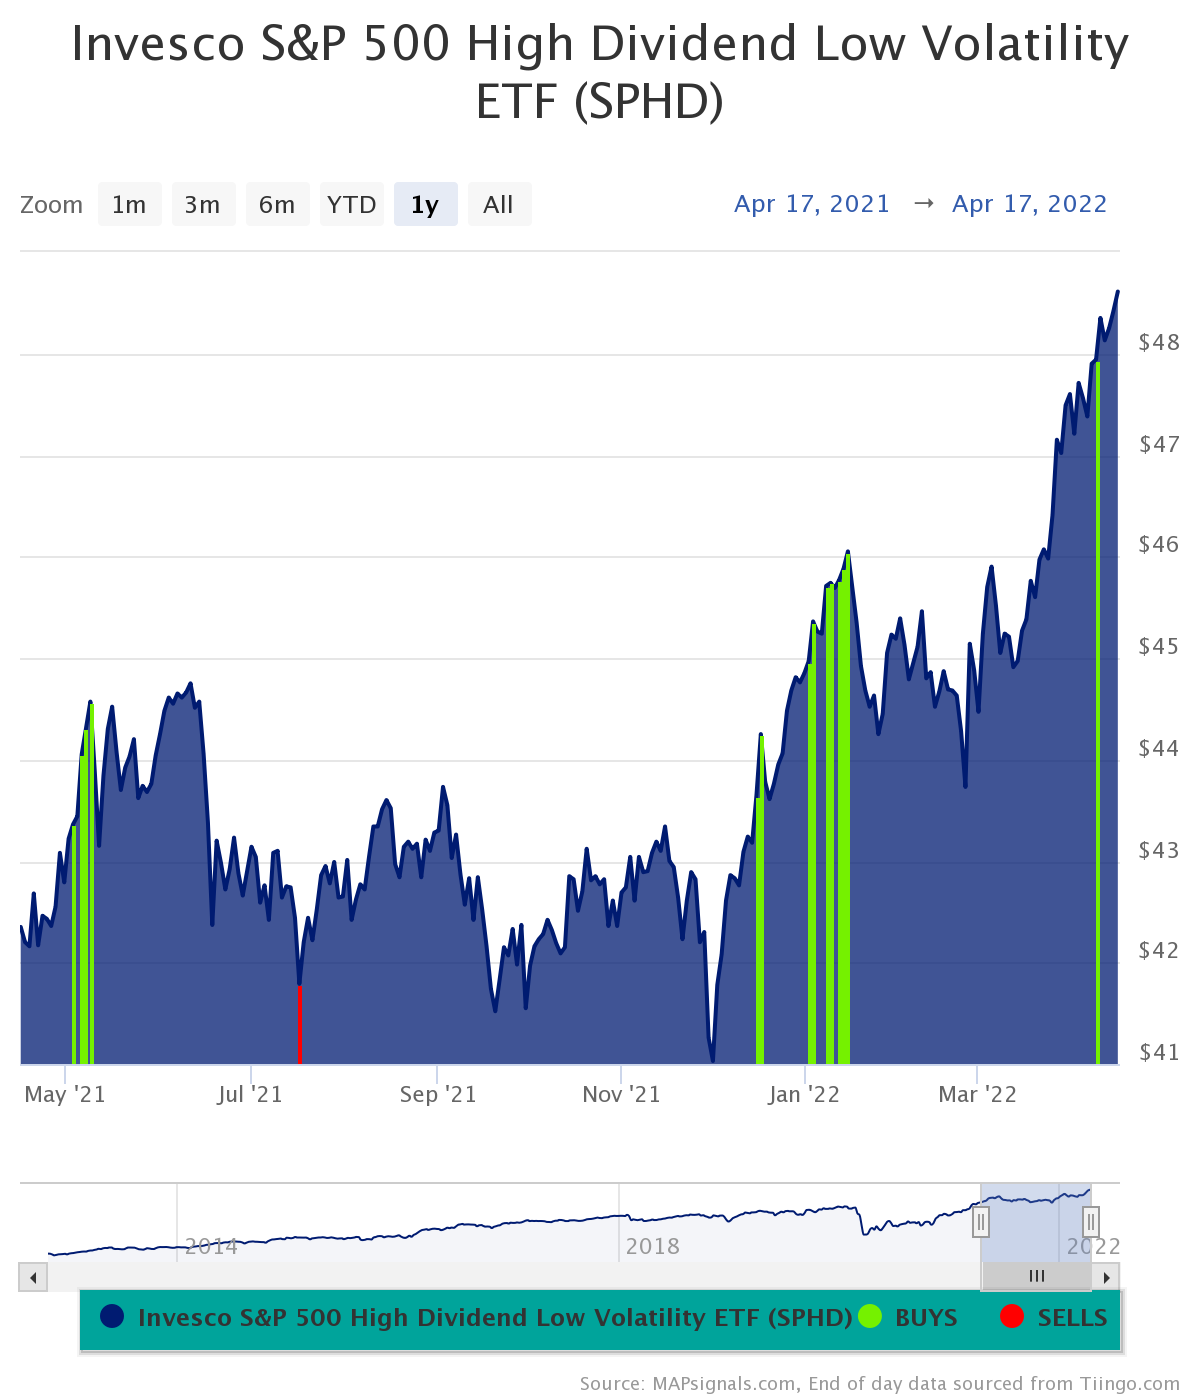
Bringing It All Together

Recent volatility could linger if 8% inflation doesn’t cool soon. The Fed may have to hike rates far higher than the 3.25% Wall Street currently expects. That could tip the economy into recession, hammering earnings.

No one has a crystal ball. But the risk of a recession is rising. That doesn’t mean panicking out of stocks. Instead, make room for some portfolio insurance. High dividend and low volatility are the two best performing stock factors YTD – both are solidly positive.

SPHD offers a low-cost, high yielding way to reduce risk. And our ranking process agrees! And remember, in this murky macro environment, the best offense is a good defense!

Invest well,

-Alec


Alec Young
Alec Young

Alec Young serves as MAPsignal’s Chief Investment Strategist. Alec is an experienced Wall Street investment strategist who has served in progressively more senior, client and media facing roles at major investment firms since 2005. Prior to joining MAPsignals, Alec spent 15 years in senior investment strategist roles at major financial firms. Most recently, he served as FTSE Russell’s Managing Director of Global Markets Research. Prior to that, he was VP & Investment Strategist at Oppenheimer Funds and served as Global Equity Strategist at S&P Global.
See his full bio here.

Spread the word!

Category: All, Macro Insights

Previous Post: «Sector Balance Wins in 2022 Sector Balance Wins in 2022
Next Post: The Bull Market of 2022 The Bull Market of 2022»

Reader Interactions

Leave a Reply Cancel reply

Your email address will not be published. Required fields are marked *

Primary Sidebar

Get Big Money Insights for FREE

Want to know where the Big Money is headed?

Just enter your email address below. You'll get our FREE NEWSLETTER sent directly to your inbox.

We call it Big Money Insights... It’s your weekly sneak peek at the powerful market-moving forces that are hidden from 99% of investors.

"*" indicates required fields

This field is for validation purposes and should be left unchanged.

Categories

  • All
  • Big Money Insights Weekly
  • Big Money Series
  • Macro Insights
  • MAP In The Media
  • Members Only
  • Performance
  • Podcast
  • Special Reports
  • Stocks
  • Videos & Interviews
  • White Papers

Archives

  • February 2023
  • January 2023
  • December 2022
  • November 2022
  • October 2022
  • September 2022
  • August 2022
  • July 2022
  • June 2022
  • May 2022
  • April 2022
  • March 2022
  • February 2022
  • January 2022
  • December 2021
  • November 2021
  • October 2021
  • September 2021
  • August 2021
  • July 2021
  • June 2021
  • May 2021
  • April 2021
  • March 2021
  • February 2021
  • January 2021
  • December 2020
  • November 2020
  • October 2020
  • September 2020
  • August 2020
  • July 2020
  • June 2020
  • May 2020
  • April 2020
  • March 2020
  • February 2020
  • January 2020
  • December 2019
  • November 2019
  • October 2019
  • September 2019
  • August 2019
  • July 2019
  • June 2019
  • May 2019
  • April 2019
  • March 2019
  • February 2019
  • January 2019
  • December 2018
  • November 2018
  • October 2018
  • September 2018
  • August 2018

Follow us on Twitter

MAPsignals Follow 1,434 1,061

MAPsignals is a data platform that tracks institutional money flows in stocks and ETFs. Sign up for free insights here: https://t.co/SaAVHjKC9J

mapsignals
mapsignals avatar; MAPsignals @mapsignals ·
1h 1621476848990359552

Pendulum has swung

Helene Meisler @hmeisler

Highest volume for the QQQs since 12/13

Reply on Twitter 1621476848990359552 Retweet on Twitter 1621476848990359552 0 Like on Twitter 1621476848990359552 0 Twitter 1621476848990359552
Load More...

Footer

© 2021 Mapsignals.com

  • Home
  • Contact & Disclaimer
  • Privacy Policy
  • Terms & Conditions
  • Opt-out preferences
  • FAQ

Copyright © 2023 · Mai Law Pro on Genesis Framework · WordPress · Log in

✕
What Happened to Risk Assets White Paper is Here

Get your copy here and take a journey through our thoughts on margin and leverage.

Enter your email address below and you'll get our FREE NEWSLETTER sent directly to your inbox. 

 We call it Big Money Insights... It’s your weekly sneak peek at the powerful market-moving forces that are hidden from 99% of investors.

MAPsignals
Manage Cookie Consent
We use cookies to optimize our website and our service.
Functional Always active
The technical storage or access is strictly necessary for the legitimate purpose of enabling the use of a specific service explicitly requested by the subscriber or user, or for the sole purpose of carrying out the transmission of a communication over an electronic communications network.
Preferences
The technical storage or access is necessary for the legitimate purpose of storing preferences that are not requested by the subscriber or user.
Statistics
The technical storage or access that is used exclusively for statistical purposes. The technical storage or access that is used exclusively for anonymous statistical purposes. Without a subpoena, voluntary compliance on the part of your Internet Service Provider, or additional records from a third party, information stored or retrieved for this purpose alone cannot usually be used to identify you.
Marketing
The technical storage or access is required to create user profiles to send advertising, or to track the user on a website or across several websites for similar marketing purposes.
Manage options Manage services Manage vendors Read more about these purposes
View preferences
{title} {title} {title}