
The Pace of Rate Cuts Matters, Two Sectors to Buy into Weakness
Stocks have had a great year. But recent market volatility has gotten investors spooked.
Traders are worried about 2 potential market headwinds: the path of Interest rate cuts and election uncertainty.
Today, we’ll debunk Wall Street’s latest economic and election worries. We’ll highlight why the pace of rate cuts matters and the 2 sectors to buy into weakness.
Seasonal weakness is a gift…so, prepare now.
Before we get into hard-hitting data, let’s unpack the latest recession worries the bears keep spinning.
Recession Fears are Overblown (again)
Remember how rate cuts used to be viewed as bullish? I do too!
Well, turns out, many are now flipping script. Recently, the bears argue how the Fed has waited too long to cut rates, and the economy is in trouble.
So far, the data doesn’t bear this out.
While growth is slowing due to weakness in manufacturing, the services sector, which equals 2/3 of the economy, remains healthy thanks to a resilient labor market and the strength of upper-income consumers. (making up 50% of overall spending).
This looks more like a mid-cycle slowdown than a recession. The latest real-time, Atlanta Fed GDP Now GDP forecast for Q3 stands at a steady 2.1%.
Remember that the recessionistas have been yelling fire in a crowded theater since this bull market began in October 2022. Listening to them has been dangerous to your wealth. We think they’re wrong, again.
OK, so what does all this mean for the Fed?
The Pace of Rate Cuts Matters, Slower is Bullish for Stocks
The Fed will begin cutting rates on September 18. Lower rates will help cushion growth, reducing the odds of a hard landing.
While growth is slowing, the economy isn’t in dire straits. The Fed is just normalizing monetary policy to reflect the steady decline in core PCE inflation to 2.5%.
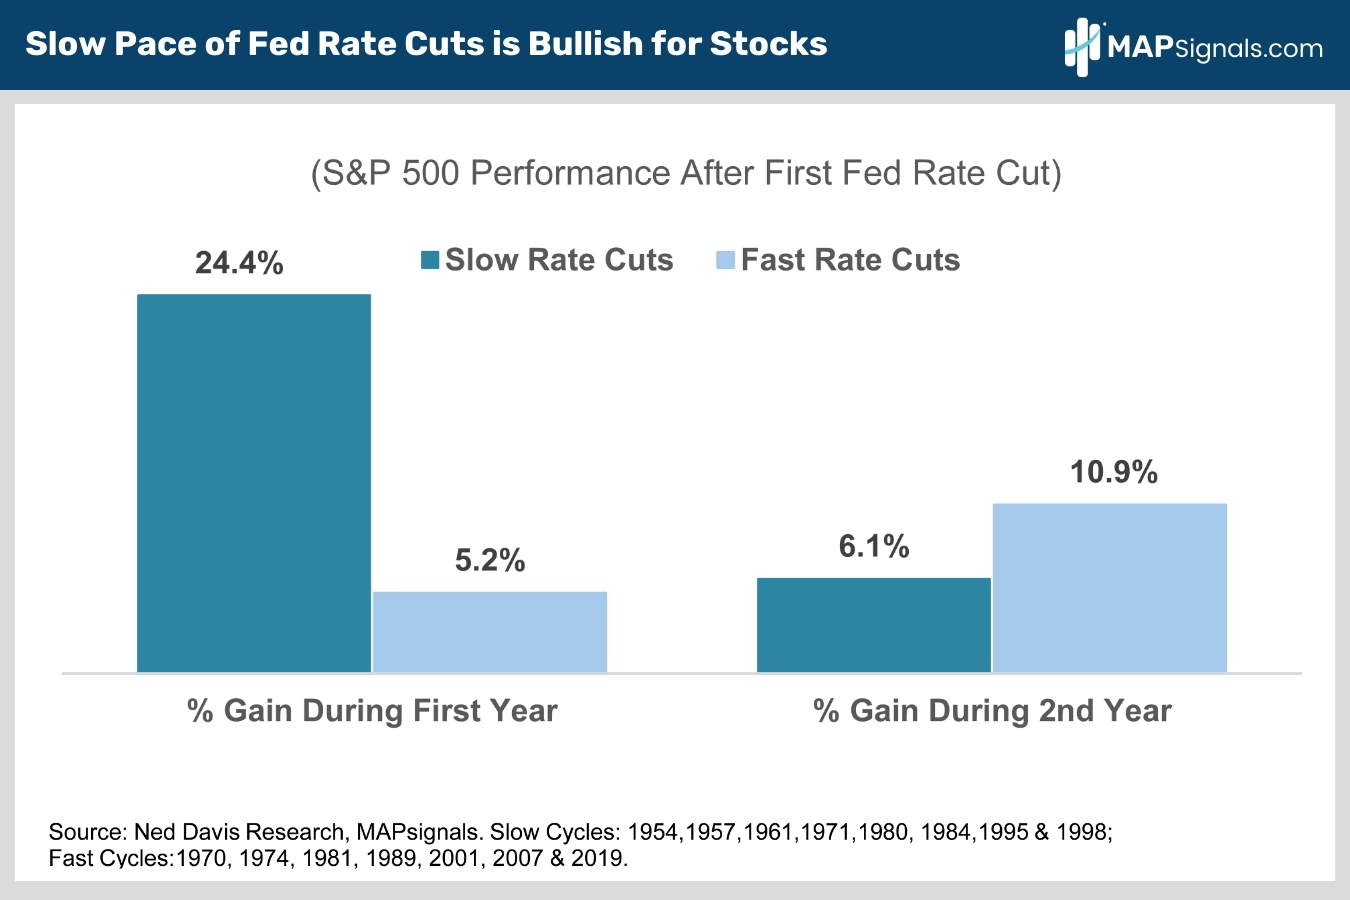
When easing has been slow, stocks fly.
Check out the performance of the S&P 500 after the first Fed rate cut back to 1954. When the pace of cuts is slow, the large-cap index is up 24% on average one year later.
Contrast this to fast rate cut cycles when the S&P 500 only gains 5.2% on average a year later, well below the 10% historical average annual gain:
If the Fed is cutting rates quickly, it usually means there is some sort of crisis afoot (Dot Com Bubble, Great Financial Crisis, Covid 19 etc..) or the economy needs rescuing because it’s already slipped into recession.
That’s not the case today.
The monetary policy backdrop is likely to remain favorable for stocks. We recommend you buy seasonal dips.
Let’s shift gears to the other big macro worry – election uncertainty.
Buy the Pre-Election Dip, 2 Sectors to Buy into Weakness
We all know markets hate uncertainty. With polls showing November’s election a virtual dead heat, this fall has uncertainty in spades.
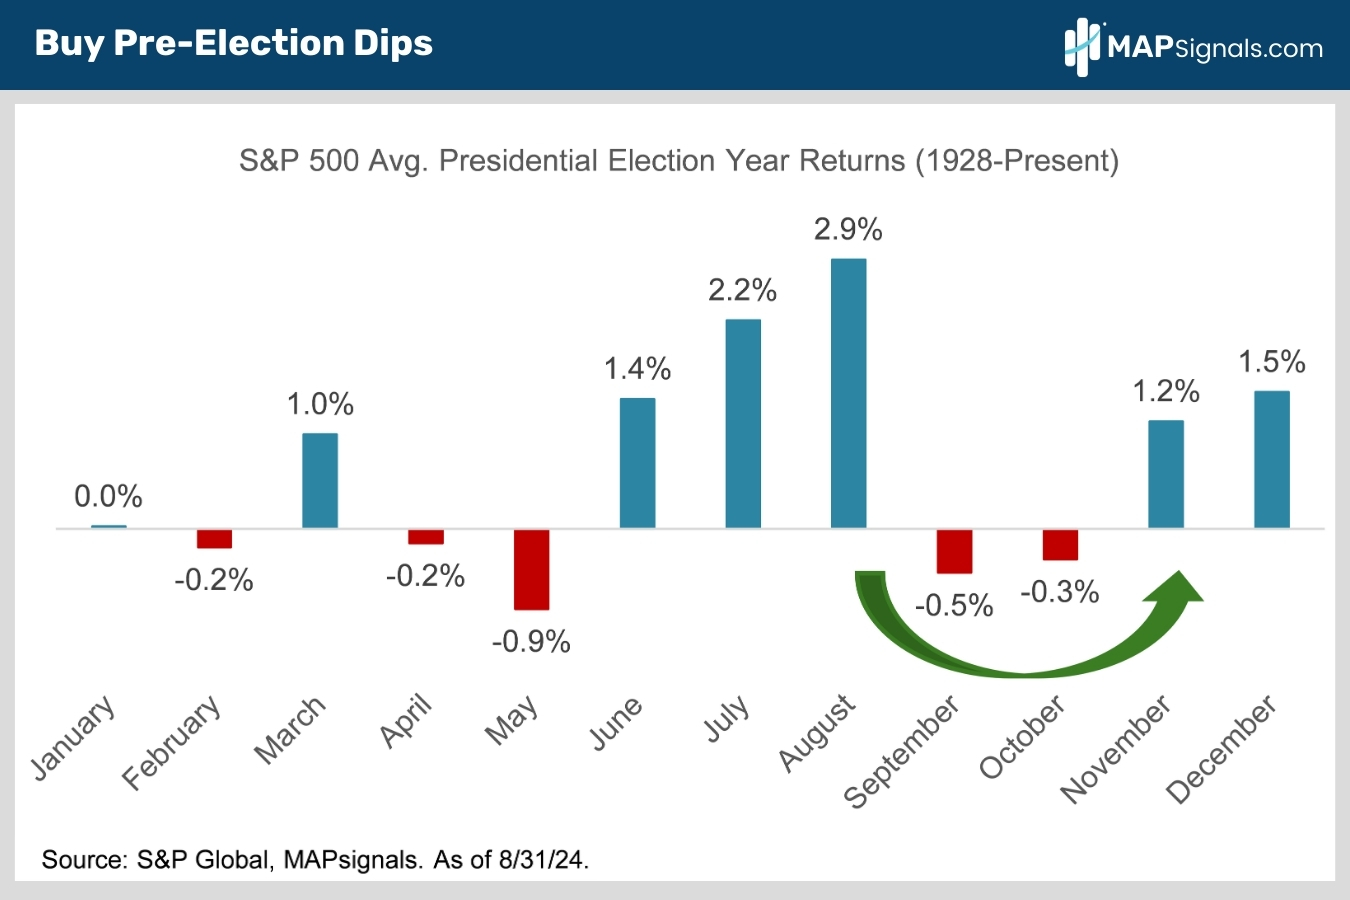
Electoral uncertainty is a big reason the S&P 500 averages losses of 0.5% and 0.3% in September and October, respectively, of election years (chart).
Markets have proven they can price in any outcome. It’s what markets do.
Getting the electoral uncertainty out of the way is more important than who wins the vote.
The good news is we know the election is November 5th and markets will have certainty about the outcome soon thereafter.
Markets have historically enjoyed big relief rallies after elections. The S&P 500 has averaged 1.2% and 1.5% gains in November and December of election years, respectively (chart).
Wait, it gets better. The post-election rally historically continues into the first year of the new presidential term with the S&P 500 averaging a 10% total return.
The data is clear. Cashing out of stocks over electoral jitters has been a losing investment strategy.
Here’s the bottom line: Buy the pre-election dip ahead of the post-election rip.
Now that the dip is here, let’s start by analyzing election cycle sector performance.
With 2024 almost over, focusing solely on election year performance has limited value.
Instead, we focus on a two-year span – the presidential election year, and, more importantly given that it’s September, the first year of the new presidential term.
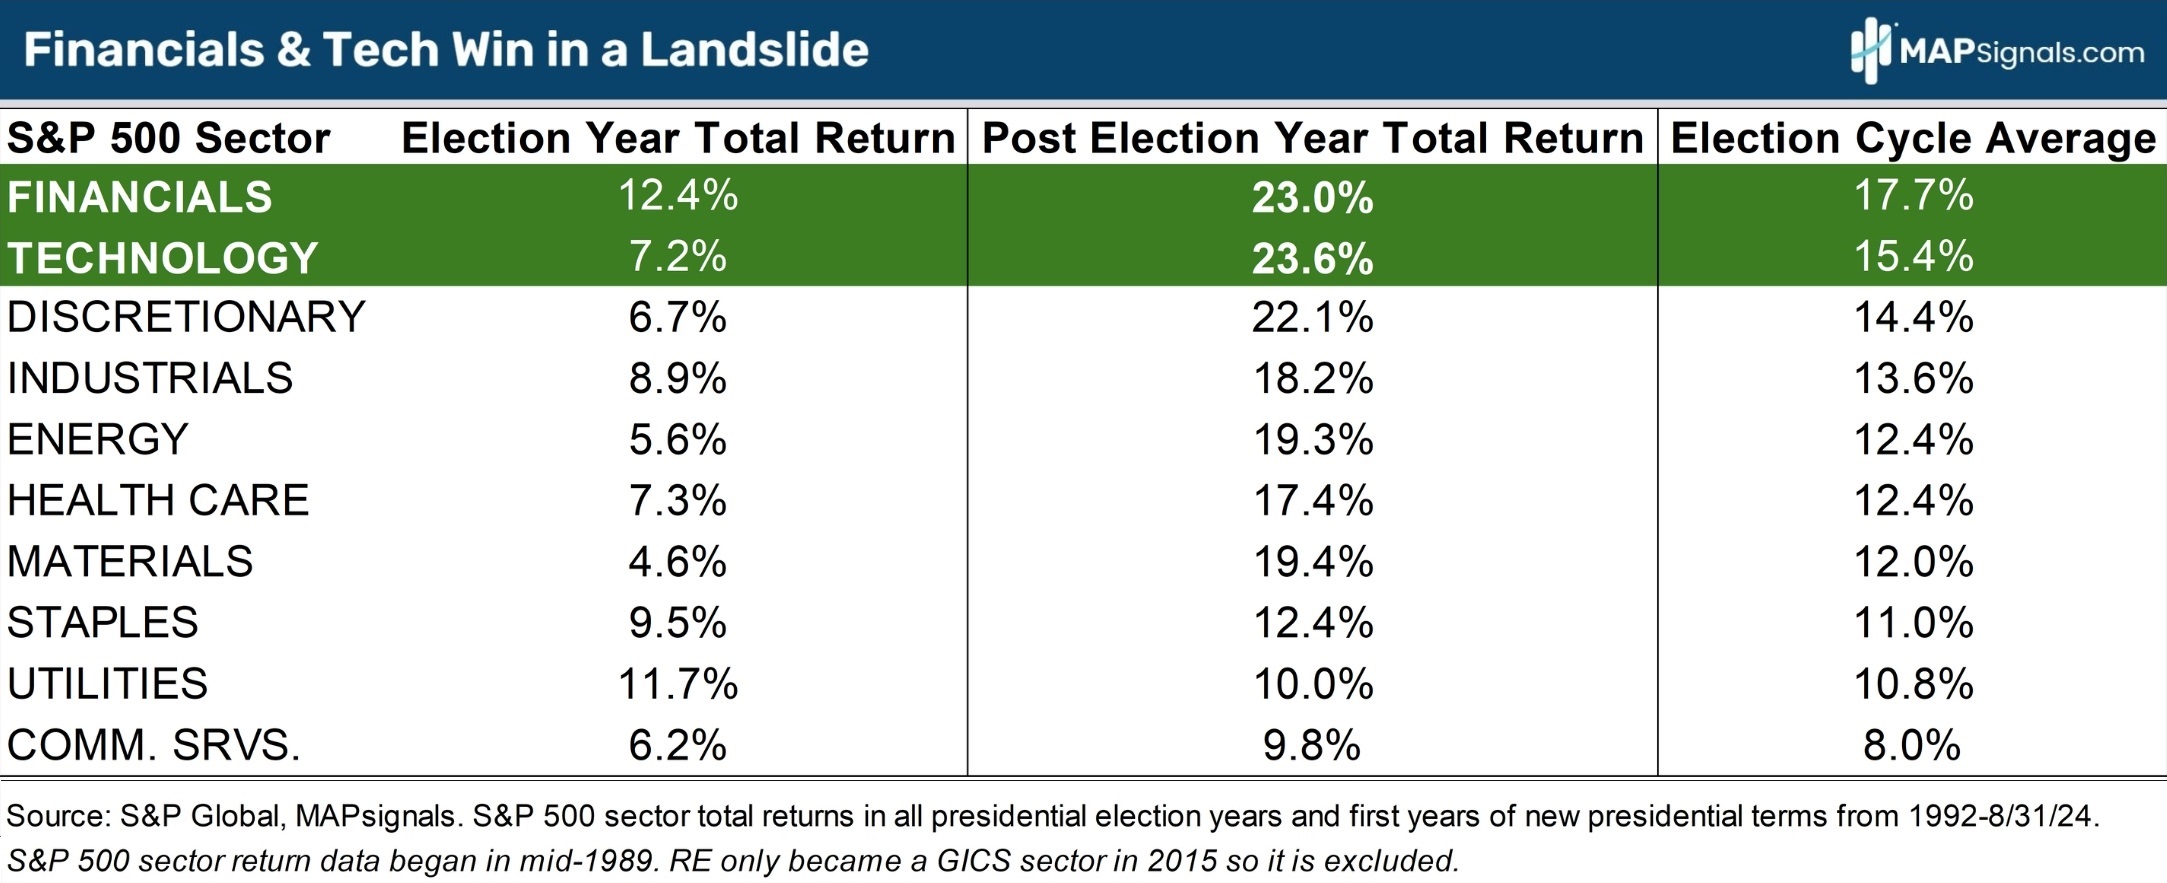
When you slice up average historical returns by sector, 2 areas jump out.
Financials lead the pack, averaging 12.4% and 23% total returns in election years and the first year of new presidential terms, respectively.
That works out to an impressive, backend loaded, election cycle average of 17.7%!
Technology also does great, averaging 7.2% and 23.6% total returns in election years and the first year of the presidential cycle, respectively.
That works out to an impressive, backend loaded, election cycle average of 15.4%!
That’s upside worth catching. Remember, the S&P 500’s average annual total return since 1926 is only 12%.
And in the first year of the presidential cycle, the S&P only averages 10% returns including dividends, making financials’ and tech’s 23% post-election year average gains even more compelling:
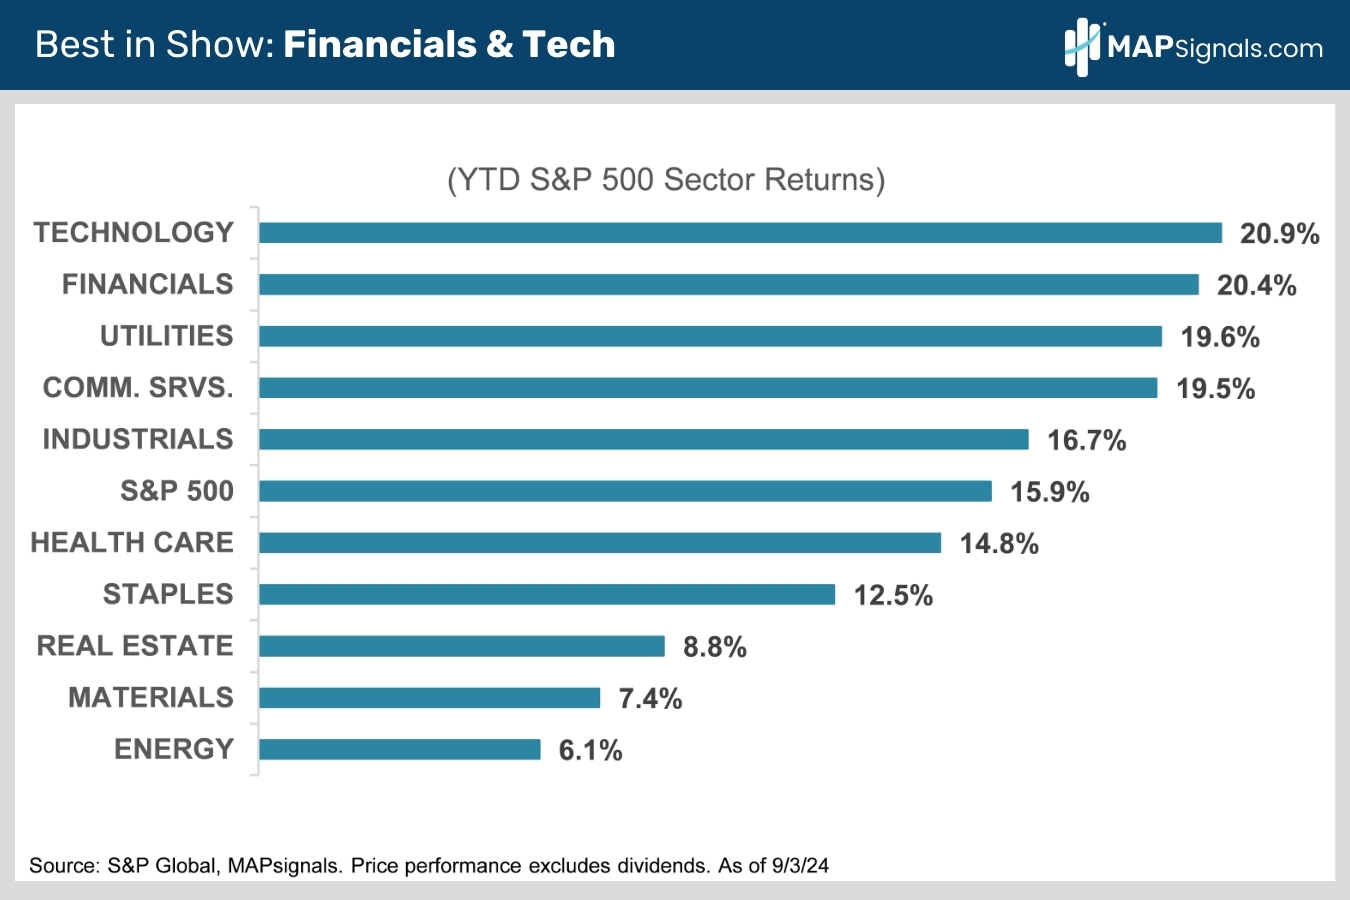
Macro and historical tendencies are important to understand. Couple those with recent institutional sponsorship and you’ve got a powerful recipe for upside.
Financials and tech are in pole position YTD partly due to healthy inflows. Note how technology and financials are the S&P 500’s top performers YTD with 20.9% and 20.4% gains, respectively (chart):
When you compare YTD performance to MAPsignals’ sector rankings, you see a similar flavor with Financials and Tech bracketing our top 5 sectors:
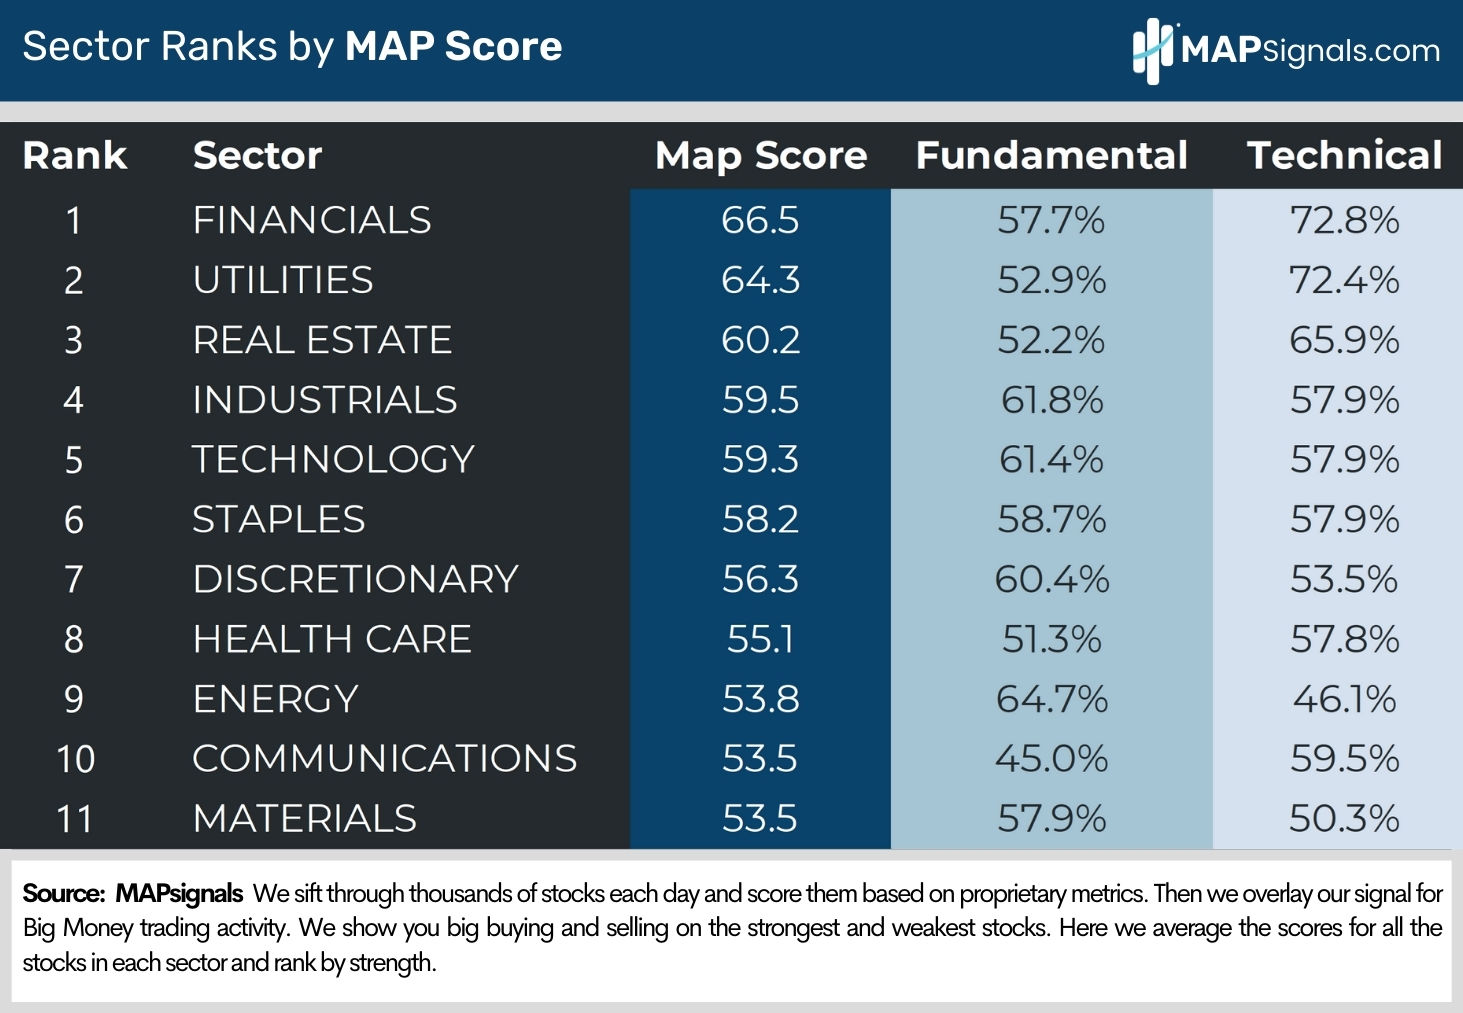
There’s a lot of oversold tech and financials names out there. Make sure to bet on all-star quality businesses loved by institutions.
Let’s wrap up.
Here’s the Bottom Line: We know it’s easy to get spooked by endless recession talk and pre-election noise.
That’s why you should expect the crowd to dump stocks before the vote. In election years over the past nearly hundred years, the S&P falls .5% in September and .3% in October.
That’ll create a great buying opportunity for the smart money (that’s you).
Stocks will ricochet higher through yearend. The S&P averages gains of 1.2% and 1.5%, respectively, in November and December of election years.
History isn’t the only thing on the bulls’ side.
The economy isn’t in dire straits. The Fed isn’t panicking. They’re just normalizing monetary policy to reflect the steady decline in core PCE inflation to 2.5%.
When easing has been slow, the S&P 500 surges.
Buy weakness in financials and tech – they’re seeing steady institutional inflows, and they’ve gained over 20% in the first year of new Presidential terms since 1992.
So, tune out the recession and election noise and buy into any pre-vote volatility, you’ll be glad you did!
If you want to find specific large-, mid-, and small-cap names ramping with Big Money support, get started with a MAPsignals PRO subscription. It’ll get you access to our portal that updates every morning, showcasing the exact tickers being bought and their scores.
Our prized Top 20 list is full of cyclical market beaters. This is the report that found every winner in our research.
There are plenty of quality financial and tech names to get long as volatility ramps into the election. Use an election MAP for navigation.
Invest well,
Alec