• Menu
  • Skip to right header navigation
  • Skip to main content
  • Skip to primary sidebar
  • Skip to footer

MAPsignals

We map big money.

  • Latest Insights
  • Power of MAP
    • MAP Products
    • MAP System
    • MAP White Papers
    • Videos & Interviews
  • Profit with MAP
  • About
    • About MAP
    • MAP Team
    • Authors
    • MAP System
    • MAP Products
    • Big Money Index
  • Members
    • Get Started With MAP
    • My MAP
    • Big Money Charts
    • MAP View
    • MAP View Options
    • MAP Top 20 Weekly
    • MAP 50
    • Member Updates
    • Platinum Updates
    • Members Only Posts
    • Performance
  • Portal

“This Time It’s Different”

August 13, 2020 //  by Lucas Downey//  2 Comments

It’s a cringeworthy phrase.

No one really likes hearing it as we humans crave consistency.

That’s why it pains me so much to say it now.

This time it’s different.

Like in life, change is the only constant in markets. However, what we are witnessing this year is like no other change before it. In 2020, we are going from extreme to extreme.

On March 19th, in the depths of financial market hell – at MAPsignals, we strapped on our helmets and called to send the marines. Chaos was unprecedented, but the data pointed one direction – UP.

When stocks go deeply oversold, we buy in droves. And when stocks go overbought for months, history says to expect a pullback. But- and now here it is:  this time it’s different. There are simply no sellers to be found. And when there are no sellers, markets are going to stay bid.

So, things are in fact different: we are in the longest overbought period ever going back to 1990. Regardless, we are still going to be us and follow the juice.

What that means is this: there is opportunity in all markets. Great stocks continue their greatness in oversold and overbought markets too. MAPsignals finds the stocks seeing the big money. That’s the advantage we learned to trounce the markets.

So, while things in the market are different, following the Big Money gives us the same old edge we’ve enjoyed since we developed this system years ago.

Let’s dig deeper. First, we’ll look at where we are in the current extreme environment.

this time it's different

When Markets Make No Sense, This Time It’s Different

Stock markets do tend to go from one extreme to the other…but each extreme may have different reasons.

Back when Jason and I were slinging stocks around on trading desks, there always needed to be a reason for why a stock went up or down. Traders would ask nervously over the hoot (our intercom system linking hundreds of traders across the world talking to thousands of hedge funds): “any reason ABC stock is down?”

They needed to give their client information on their stock. They saw it sink but didn’t know why. The very fact that they were asking the question highlights something important: there often isn’t an obvious reason. But one reason is as old as the hills: stocks only move based on supply and demand.

I can recall countless times when we were the axe in a stock: which means, all the big money trading was happening through our own hands. Here’s an example: Let’s say XYZ stock usually trades 500,000 shares per day. Now imagine we had a big order to buy 2,000,000 XYZ shares “best way.” That’s trader speak for get me the best prices but whatever you do- get my order done.

Can you guess which way the stock goes? Logically it goes UP.

So for fun, we’d get on that loudspeaker asking our couple-of-hundred salespeople if they had heard a “reason” for why XYZ was up that day.

We would laugh when we would hear the reasons flood in:

“Baird released a positive report.”

“Cramer made positive comments.”

“Hearing a sovereign wealth fund is buying.”

This was the stock trader equivalent of making prank calls. The countless reasons made us crack up because we knew the real reason. We were buying it! Simple as that: we needed to buy more than was available.

But imagine if someone asked why the stock was going up and we answered: “because someone is buying it.” We tried that a few times and it really ticked people off.

People need a reason.

I’m telling you this story because right now the market is seeing demand like this. Big orders are likely all over the place, rocketing stocks to the moon.

Why is the market overbought for so long? Because there are only buyers and no sellers.

That’s why the Big Money Index is staying overbought for so long too:

big money index overbought

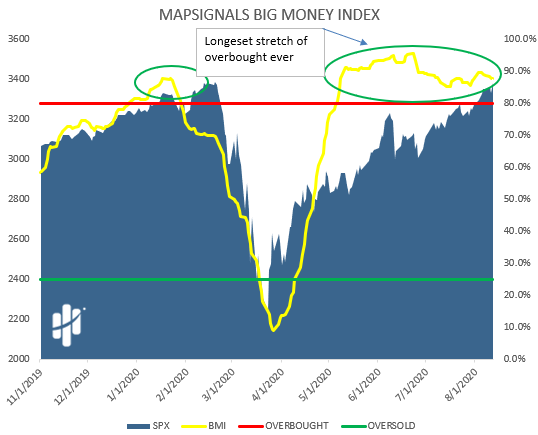
So, now you know why this time it’s different for an overbought market. History said to expect a pullback, but buying is relentless.  The law of supply and demand simply says we have a lot of demand for stocks.

Only when supply increases, can we expect anything different. Who knows what the reason will be, but rest assured there will be plenty to choose from.

The Power Of Big Money

We’ve witnessed a pandemic and the rally of a lifetime and MAPsignals was all over it.

But if we are so smart- then how did MAPsignals do?

I’m glad you asked!

First, let’s look at the past year. These are the weekly stock profiles our subscribers get in the MAP View. The great thing is, these stocks include a bear market and our current overbought heights.

These are the weekly picks from the 2nd half of 2019 and the 1st half of 2020.

The performance is from the date initiated (usually sent each Sunday evening) and held through yesterday’s close, August 12th, 2020. We will compare it to the S&P 500 (SPY ETF):

map view performance

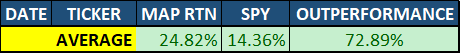
Ladies and gentlemen, when you beat the market by 73% – that’s what we call juice!

But, don’t draw your conclusion just on that alone. Judge us on our ideas when the heat was on.

We sent a special report to our members only right after we went oversold on March 19th, spotting opportunity.

On this post we saw an incredible setup and gave 15 Big Money stocks we considered as great buys. We also walk our talk: we own a bunch of them.

The S&P 500 (SPY ETF) since then is +41.79%…which is astounding. But, that was nothing compared to our favorite Big Money stocks:

spotting opportunity performance

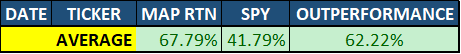
In one word – JUICE!

Bottom line – we can safely say that concerning the overbought market in 2020: this time it’s different.

What isn’t different though is winning by following the Big Money.

Wherever it goes – we will follow.

We hope you come too.

And the next time someone asks you why the market is up so much- tell them a reason they want to hear. But in your head you’ll know the truth: it’s because Big Money is buying it.

Lucas Downey
Lucas Downey

Lucas is co-founder of MAPsignals. His full bio can be found here.
Prior to MAP, he was Head of ETF Sales at Cantor Fitzgerald & SVP of Derivatives at Jefferies, LLC.

Spread the word!

Category: All, Big Money Insights Weekly, Performance, Special Reports

Previous Post: « How To Find The Handful Of Stocks That Win In Any Market – MoneyShow With Jason Bodner
Next Post: Mic Drop mic drop»

Reader Interactions

Comments

  1. Brett Dawson

    August 13, 2020 at 6:23 pm

    Thanks for the update but isn’t alpha on a 24% return vs SPY 14% closer to 10% (not 72%)? Could you please clarify your logic?
    Regards Brett

    Reply
    • Mapsignals Staff

      August 13, 2020 at 6:45 pm

      Hey Brett –

      You are right – it is about 10% alpha.

      We updated it to say what we meant – outperformance.

      The 24% number is larger than the 14% number by 72%.

      Reply

Leave a Reply Cancel reply

Your email address will not be published. Required fields are marked *

Primary Sidebar

Get Big Money Insights for FREE

Want to know where the Big Money is headed?

Just enter your email address below. You'll get our FREE NEWSLETTER sent directly to your inbox.

We call it Big Money Insights... It’s your weekly sneak peek at the powerful market-moving forces that are hidden from 99% of investors.

"*" indicates required fields

This field is for validation purposes and should be left unchanged.

Categories

  • All
  • Big Money Insights Weekly
  • Big Money Series
  • Macro Insights
  • MAP In The Media
  • Members Only
  • Performance
  • Podcast
  • Special Reports
  • Stocks
  • Videos & Interviews
  • White Papers

Archives

  • February 2023
  • January 2023
  • December 2022
  • November 2022
  • October 2022
  • September 2022
  • August 2022
  • July 2022
  • June 2022
  • May 2022
  • April 2022
  • March 2022
  • February 2022
  • January 2022
  • December 2021
  • November 2021
  • October 2021
  • September 2021
  • August 2021
  • July 2021
  • June 2021
  • May 2021
  • April 2021
  • March 2021
  • February 2021
  • January 2021
  • December 2020
  • November 2020
  • October 2020
  • September 2020
  • August 2020
  • July 2020
  • June 2020
  • May 2020
  • April 2020
  • March 2020
  • February 2020
  • January 2020
  • December 2019
  • November 2019
  • October 2019
  • September 2019
  • August 2019
  • July 2019
  • June 2019
  • May 2019
  • April 2019
  • March 2019
  • February 2019
  • January 2019
  • December 2018
  • November 2018
  • October 2018
  • September 2018
  • August 2018

Follow us on Twitter

MAPsignals Follow 1,434 1,061

MAPsignals is a data platform that tracks institutional money flows in stocks and ETFs. Sign up for free insights here: https://t.co/SaAVHjKC9J

mapsignals
mapsignals avatar; MAPsignals @mapsignals ·
1h 1621476848990359552

Pendulum has swung

Helene Meisler @hmeisler

Highest volume for the QQQs since 12/13

Reply on Twitter 1621476848990359552 Retweet on Twitter 1621476848990359552 0 Like on Twitter 1621476848990359552 0 Twitter 1621476848990359552
Load More...

Footer

© 2021 Mapsignals.com

  • Home
  • Contact & Disclaimer
  • Privacy Policy
  • Terms & Conditions
  • Opt-out preferences
  • FAQ

Copyright © 2023 · Mai Law Pro on Genesis Framework · WordPress · Log in

✕
What Happened to Risk Assets White Paper is Here

Get your copy here and take a journey through our thoughts on margin and leverage.

Enter your email address below and you'll get our FREE NEWSLETTER sent directly to your inbox. 

 We call it Big Money Insights... It’s your weekly sneak peek at the powerful market-moving forces that are hidden from 99% of investors.

MAPsignals
Manage Cookie Consent
We use cookies to optimize our website and our service.
Functional Always active
The technical storage or access is strictly necessary for the legitimate purpose of enabling the use of a specific service explicitly requested by the subscriber or user, or for the sole purpose of carrying out the transmission of a communication over an electronic communications network.
Preferences
The technical storage or access is necessary for the legitimate purpose of storing preferences that are not requested by the subscriber or user.
Statistics
The technical storage or access that is used exclusively for statistical purposes. The technical storage or access that is used exclusively for anonymous statistical purposes. Without a subpoena, voluntary compliance on the part of your Internet Service Provider, or additional records from a third party, information stored or retrieved for this purpose alone cannot usually be used to identify you.
Marketing
The technical storage or access is required to create user profiles to send advertising, or to track the user on a website or across several websites for similar marketing purposes.
Manage options Manage services Manage vendors Read more about these purposes
View preferences
{title} {title} {title}