• Menu
  • Skip to right header navigation
  • Skip to main content
  • Skip to primary sidebar
  • Skip to footer

MAPsignals

We map big money.

  • Latest Insights
  • Power of MAP
    • MAP Products
    • MAP System
    • White Papers
    • Videos & Interviews
    • Big Money Podcast
  • Profit with MAP
  • About
    • About MAP
    • MAP Team
    • MAP System
    • MAP Products
    • Big Money Index
  • Members
    • Get Started With MAP
    • My MAP
    • MAP View
    • MAP Options
    • MAP Top 20 Weekly
    • MAP 50
    • Members Only Posts

Time To Pop The Hood

March 11, 2020 //  by MAPsignals Staff//  8 Comments

When the check engine light flashes – bring your car in…don’t panic.

Running a diagnostic test helps visualize what’s going on.

To do that, a mechanic’s gotta pop the hood.

The same goes for the market. Today we’re popping the hood.

wikipedia

Monday’s Sell-off Was Off The Chart

Let’s start from the top and work our way down. I want you to see what we’re seeing under the hood each day.

Monday’s halted sell-off was epic. When we say it was off the chart, we actually mean that.

The below chart nets buys and sells each day. Green sticks are net buys and red are net sells. You can see just how large Monday’s selloff was compared to December 2018.

Have a look:

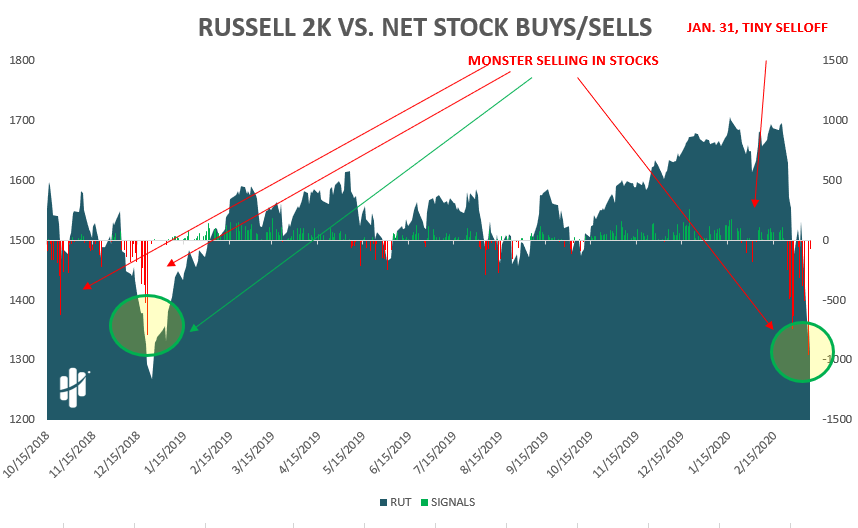
We’ve seen similar, but nothing of this magnitude. It was the single largest day of selling in stocks in our history.

Usually days like Monday are near local bottoms.

But, even as epic as it was, it’s still eerily similar to prior sell-offs.

The next charts should make that very clear.

We are inching ever closer to what is historically a very strong buy signal for us. The thing is, for us to get oversold – things have to get ugly…like now.

Below you can see our big money index which measures buying vs selling on a 5 week moving average. When it’s falling, like now, buyers have disappeared.

Our Mapsignals Big Money Index is free-falling:

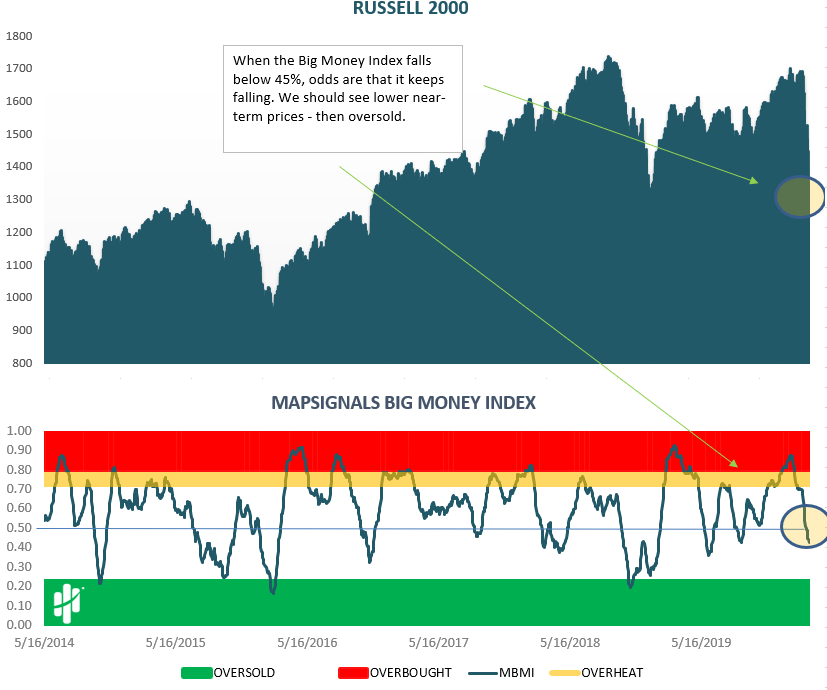
We’re likely 1-2 weeks away from being oversold. So, that means we likely have a bit more downside.

Big Money Selling In Sectors Is Huge

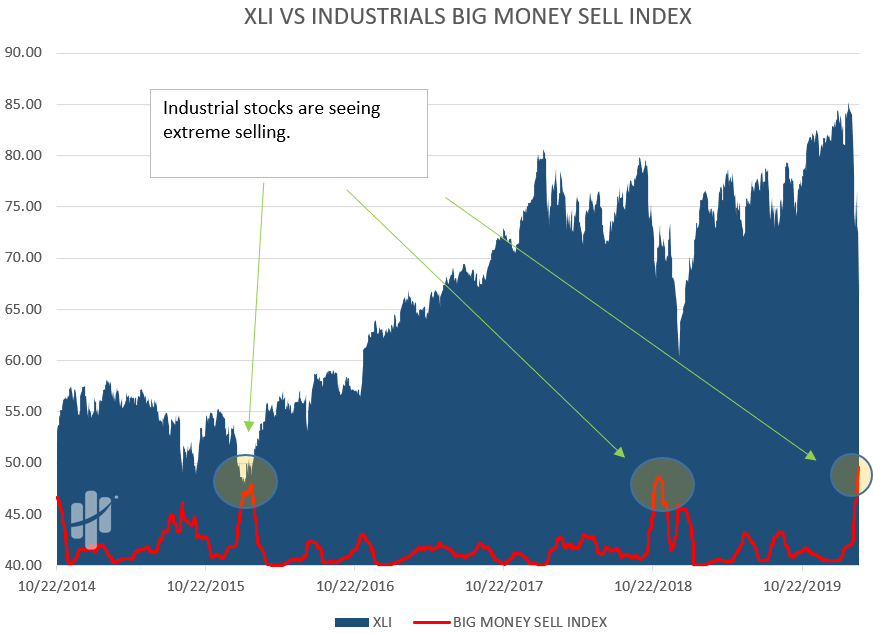
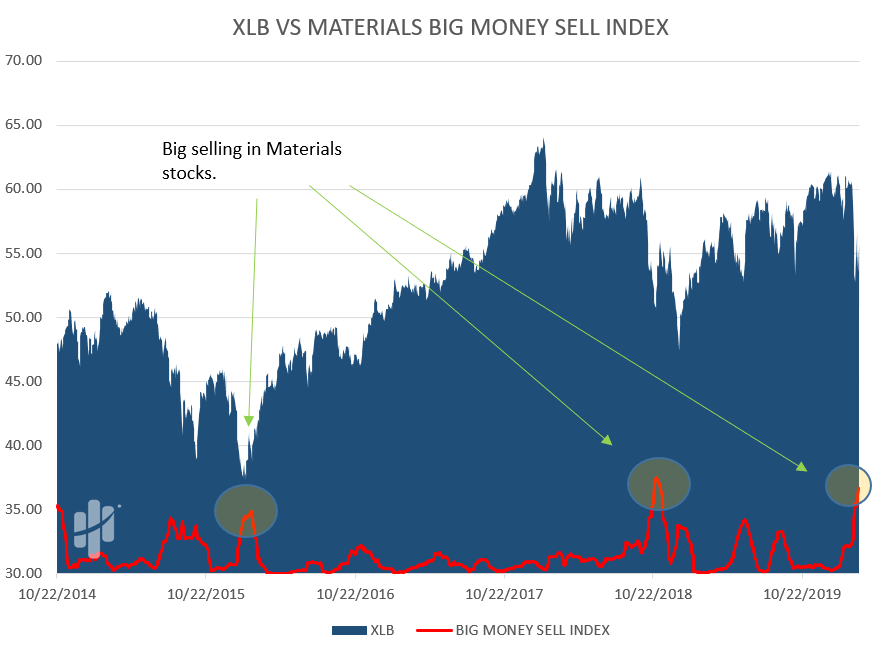
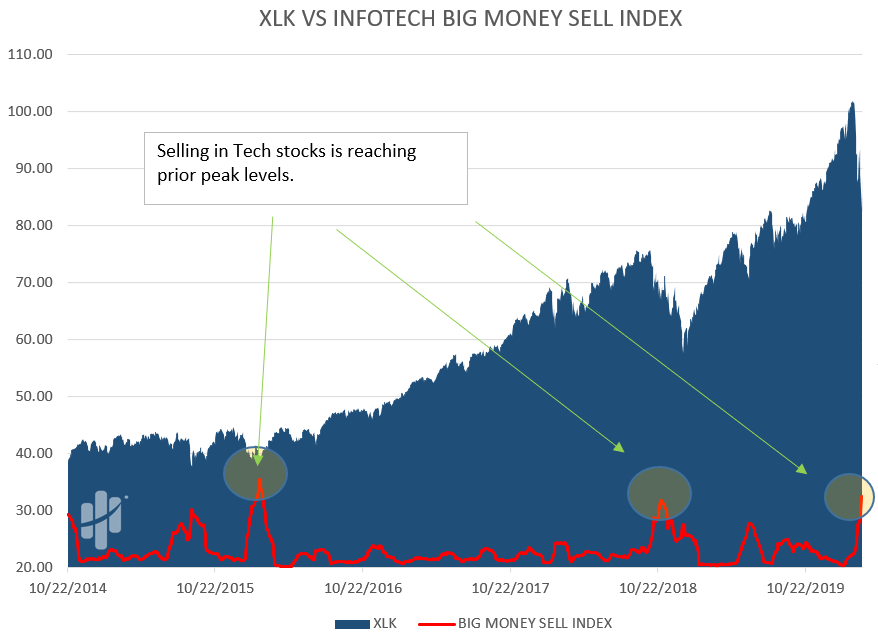
Let’s work our way down into sectors. Here’s a look at 5 sector charts that show how big the selling is currently.

We create each big money index by taking a moving average of sell signals in each sector. As the index moves higher, selling is increasing.

The key takeaway is how similar-sized selling has happened before over the past 6+ years.

Here’s Financials:

Now, Energy:

And Industrials:

Then Materials:

And lastly, Technology:

Here’s the bottom line – pullbacks like these happen. It’s part of the game.

Using data is such an advantage in times like this. We are able to gauge supply and demand by looking under the hood.

And the mechanic in me says, “she’ll be ready for the road in no time.”

So, don’t panic when the engine light flashes – it’s part of owning a car.

The same can be said for investing.

A diagnostic test gives you the clarity you’re looking for.

Spread the word!

Category: All, Big Money Insights Weekly, Special Reports

Previous Post: «GET IN THERE Get In There
Next Post: Wall Street Unplugged Podcast With Luke Downey »

Reader Interactions

Comments

  1. Chris

    March 11, 2020 at 1:31 pm

    Great simple analysis showing we are reaching the bottom if we have not already. As the selling index falls back from its peak levels I guess this reprents a good time to buy the market again. Or at least dip in a toe or three !!

    Reply
  2. Bruce

    March 11, 2020 at 1:32 pm

    I think the Map signals work is brilliant. I am retired and only trading a small hobby account now but were I still trading professionally I would subscribe immediately. I would like to ask if you have or can construct data much further back in time? The data presented is great but the time period covered happens to be a relative small sample of market environments. I have been trading since 1975 and over bought/sold sentiment levels can look very different in secular bull or secular bear markets or when transitioning from one to the other. None of this is to question the call you are making, I agree with you now.

    Reply
    • Mapsignals

      March 11, 2020 at 1:46 pm

      Thanks for the kind words, Bruce.

      This is what we love to do. We have data going back to 1990, but much of it is limited. We will be working to expand the dataset!

      -The Mapsignals Team

      Reply
      • Joe

        March 11, 2020 at 3:27 pm

        So several weeks away. I think that makes sense based on the timeframe it took for the virus to Peter out in China. South Korea and Japan now under control. Here is my question: we are down 20% in a little over two weeks. You say we could go down for another 2 weeks. How much? Another 20%? More then that you are getting into 2008-2009 50% ish sell off range.

        Reply
        • Mapsignals

          March 11, 2020 at 5:46 pm

          We are likely less than 2 weeks away from oversold. We aren’t thinking another 20% lower, closer to 10%.

          Markets will bounce around, for sure. We’d be dipping toes on these wicked down days of 4%+. Great stocks are going to make it out of this!

          -The Mapsignals Team

          Reply
  3. Kurt

    March 11, 2020 at 3:27 pm

    Thanks guys for these excellent updates, especially in this environment! I see SPY just broke below $272, yikes! Yes, your work is most impressive. I hope in the future to have a trading account of a size that will justify your paid service. Keep up the good work.

    Reply
  4. b

    March 12, 2020 at 4:18 pm

    what makes you think we are not heading into a recession?

    Reply
    • Mapsignals

      March 12, 2020 at 5:07 pm

      Hey B –

      We very well could be heading into a recession. We try and let the data guide us and we do know that earnings are definitely going lower.

      This is an extraordinary time.

      Reply

Leave a Reply Cancel reply

Your email address will not be published. Required fields are marked *

Primary Sidebar

Get Big Money Insights for FREE

Want to know where the Big Money is headed?

Just enter your email address below. You'll get our FREE NEWSLETTER sent directly to your inbox. 

 We call it Big Money Insights... It’s your weekly sneak peek at the powerful market-moving forces that are hidden from 99% of investors.

Categories

  • All
  • Big Money Insights Weekly
  • Big Money Series
  • MAP 50
  • MAP In The Media
  • Members Only
  • Performance
  • Podcast
  • Special Reports
  • Stocks
  • Videos & Interviews
  • White Papers

Archives

  • January 2021
  • December 2020
  • November 2020
  • October 2020
  • September 2020
  • August 2020
  • July 2020
  • June 2020
  • May 2020
  • April 2020
  • March 2020
  • February 2020
  • January 2020
  • December 2019
  • November 2019
  • October 2019
  • September 2019
  • August 2019
  • July 2019
  • June 2019
  • May 2019
  • April 2019
  • March 2019
  • February 2019
  • January 2019
  • December 2018
  • November 2018
  • October 2018
  • September 2018
  • August 2018

Footer

© 2020 Mapsignals.com

  • Home
  • Contact
  • Privacy Policy
  • Terms & Conditions
  • Cookie Policy (US)
  • FAQ

Copyright © 2021 · Mai Law Pro on Genesis Framework · WordPress · Log in