
Waiting For The Signal
The game goes like this:
Green means go. Red means stop.
But every now and then there’s a pause. It requires waiting for the signal.
Who has played Red Light Green Light? It’s the classic game teaching kids to pay attention.
It’s so simple: An adult stands on one side of the room while each kid lines up on the opposite side. The grownup says, “green light” and the kids rush forward. But they must be careful because at some point they’ll hear: “red light.”
If they don’t stop, they must go back to the beginning. The best listener wins.
But the game is more than just stop and go… A lot of the fun is in the suspense. Just waiting for the signal to change keeps the anticipation high.
The longer the wait, the deeper the tension. But counterintuitively, I think the game is more about sitting tight than moving forward.
And this gets me thinking about the market. While our recent writings may feel a bit like Red Light, Green Light, we’ve actually been overbought for 52 trading days. That’s over 10 weeks…talk about a long green light!
To put that in perspective, the longest consecutive overbought period (since 1990) came after the pandemic crash of 2020. It lasted 84 trading days. That was nearly 4 months long.
To the unprepared investor, it can feel like the game is rigged; there won’t ever be another red-light. But the seasoned investor knows better: they are patiently waiting for the signal.
So, is Red Light finally here? Let’s look at our recent data.
Despite a market at or near all-time highs, under the surface buying is softening. We have come to expect this action in long bull-markets. Like all things in life, the market breathes. It ebbs and flows even within an uptrend or downtrend.
So, does waning buying mean a crash is near? No.
Diminishing buying could give way to a new stronger wave of buying, or it could mean the first signs of an exhausted uptrend. Trying to anticipate it is like being the kid trying to leap ahead the moment the grownup opens their lips- it’s risky.
We are better off just waiting for the signal.
But how do we interpret this recent slower buying? It just means that a red light could flash if things deteriorate further. Right now, the green light is flickering…
Big Money Index Waiting For The Signal
As you can see, the Big Money Index could not match it’s prior high. Two weeks ago, we told you we were in a Holding Pattern. The market sagged for 3 days, but then buyers rushed in to buy the dip.
But, now a few more days of Big Money data have rolled in. Look how things appear to be flat lining again:
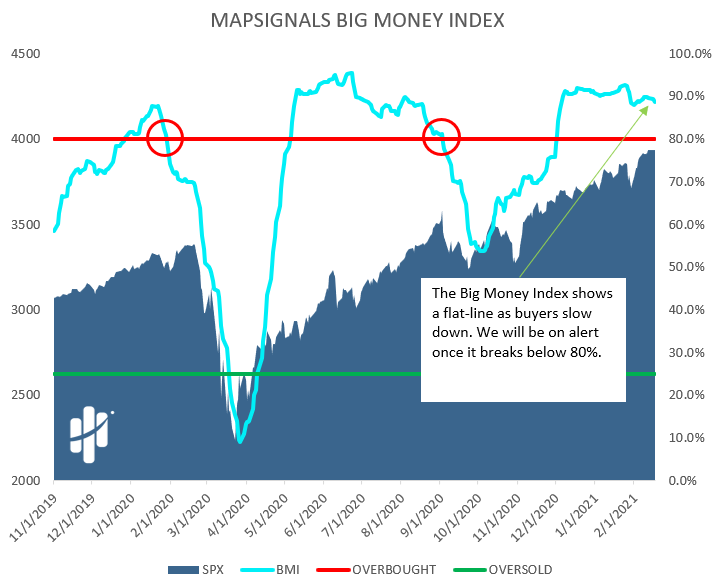
We’ve circled the areas that are important. When the BMI drops below 80% (overbought threshold), that’s the red light.
As we are waiting for the signal, let’s look beneath the surface…
Stock Buying Has Been Muted
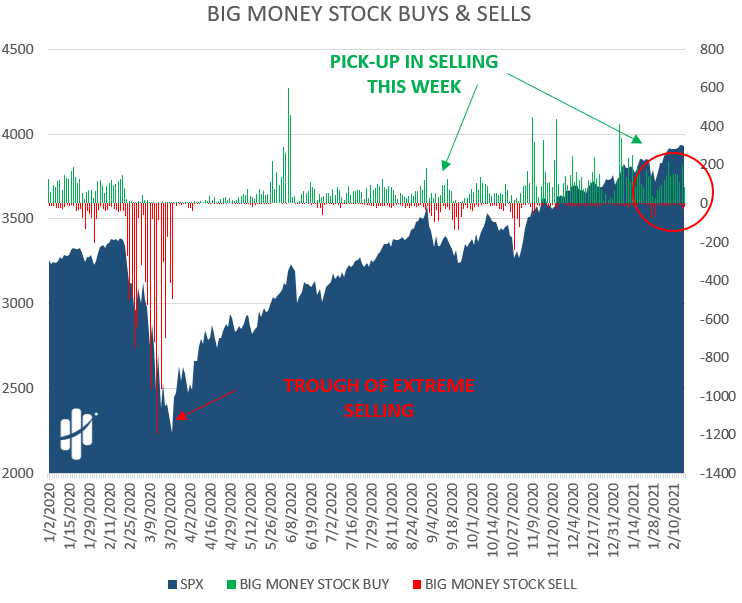
We create the Big Money Index by measuring daily unusual stock buying and selling. We net all of the signals together each day and produce a 25-day moving average of the results. The only way for the BMI to fall is for buying to slow and selling to grow.
Now, this data lags a bit as it incorporates 25 days (5 weeks) of buying and selling. As stronger days roll off and newer days are weaker, the BMI will fall.
Do you remember the selling at the end of January? In the chart below, those are the red bars circled to the right. Those few days put pressure on the BMI.
It’s hard to see, but recently there has been a small uptick in selling:
Here’s a zoom in…you may need a magnifying glass:
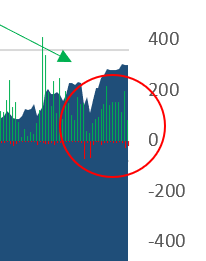
That tiny bit of red is what’s keeping the BMI from lifting further. It’s holding the BMI back. If selling intensifies, we’ll see the BMI start to deteriorate. But if buyers step back in, it could even lift more.
Just like the kid who wants to win Red Light Green Light, waiting for the signal is key. But unfortunately, the suspense can be painful!
We know we have to wait for the signal, so while we do let’s check out what else caught our eye in our data.
Velocity Of Stock Buying Has Slowed
The BMI can lift quickly or slowly. When stocks zoom to the moon, velocity is high: people can’t buy fast enough. But when that rate of buying slows, we notice.
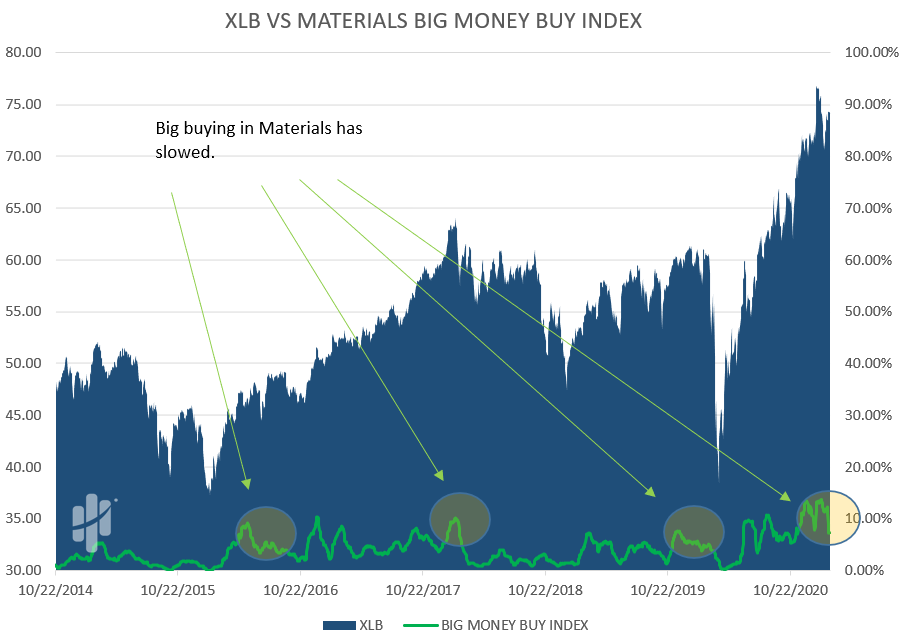
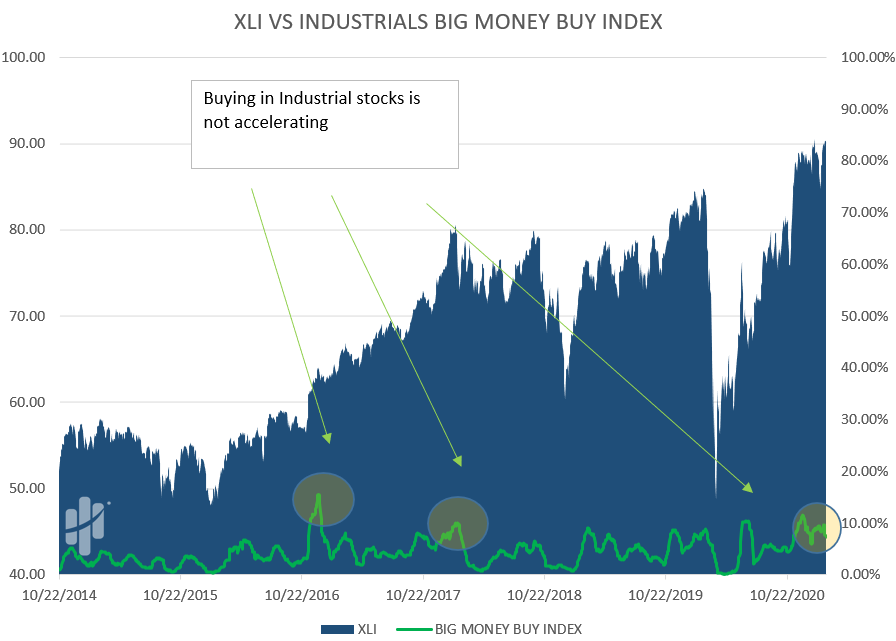
Below are our Big Money Sector Buy Indexes. They just measure the velocity of buying for each sector. If the green line is rising, the rate of buying is increasing on a 25-day moving average.
If the line is falling, buying momentum is slowing. These are some of our favorite charts because it really helps show how quickly money is coming into a sector.
Check out Materials:
Now, Industrials:
Lastly, Energy:
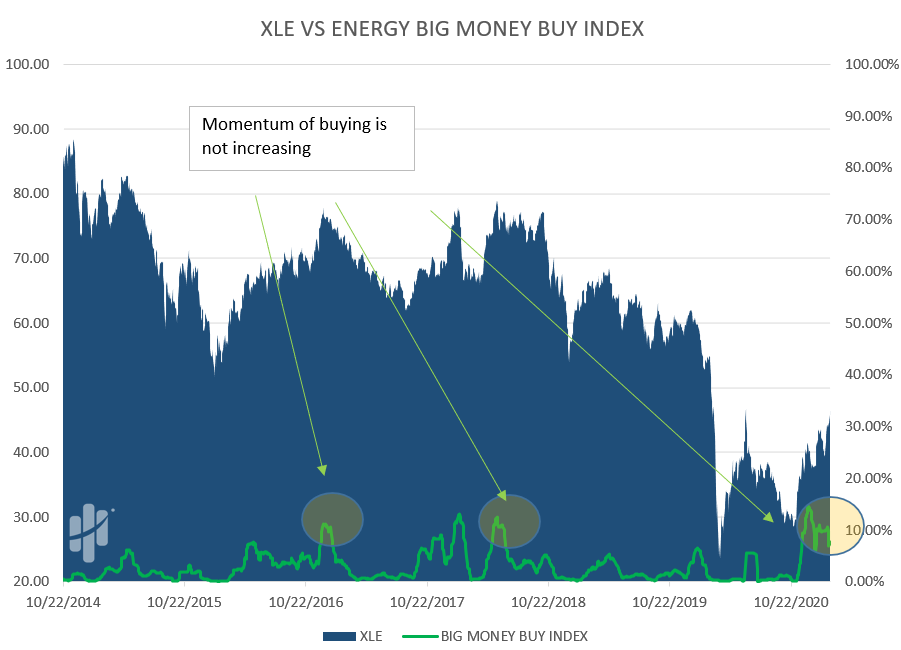
That’s right, look at Energy! You may have noticed Energy’s recent strength. But even with that pop in prices of Energy stocks, the big buying hasn’t ramped up like we expected.
So, let’s neatly tie this all together.
Here’s the Bottom Line: Frustrating as it may be, there’s a bit of a mixed message going on with stocks. It’s like when an adult says “yellow light” during the game of red-light green light just to throw the kids off. Not knowing what to do, they all look at each other.
Well, in times of extreme greed like now, patiently waiting for the signal is key. At MAPsignals, we unemotionally follow our data. And this is what it says:
The surface shows stocks are at all-time highs. But underneath, our data shows the beginning of a divergence.
For market timers, pay attention in the coming weeks. For long-term outlier stock lovers like us, be prepared to go to work while waiting for the signal. Get your buy lists and cash at the ready, for when the shift comes, those who are prepared will win the game.
If you ignore the red light, you might have to go all the way back to the starting line.