Weakness is a Buying Opportunity
The roller coaster ride for stocks continues.
Companies bob and weave as volatility remains elevated. Under the surface of the market though, signs suggest weakness is a buying opportunity.
It seems everyone is bearish. Headlines are awful with high inflation, energy worries, and rising rates. The mood is sour, which is typical of September downdrafts. But I say investors should cheer up.
The latest pullback has been swift and ugly to say the least. However, there are positive signs emerging. Stay with me.
Let’s begin with the last few months of stock returns.
Stocks made lows on June 16th, then staged an epic 2-month rally. The S&P 500 gained 17.68% from the low to the recent peak on August 16th. Talk about a rally! Interestingly, that local peak lines up exactly with our first overbought signal in well over a year, firing on August 17th.
Since then, stocks have plummeted. From August 17th through yesterday’s close, the market fell 7.44%. September’s seasonal weakness came right on time, which I referenced in our midterm election playbook.
But here’s the deal. Recent action under the surface of the market suggests that better times could be ahead in the coming weeks.
Let’s turn to the data.
Weakness is a Buying Opportunity
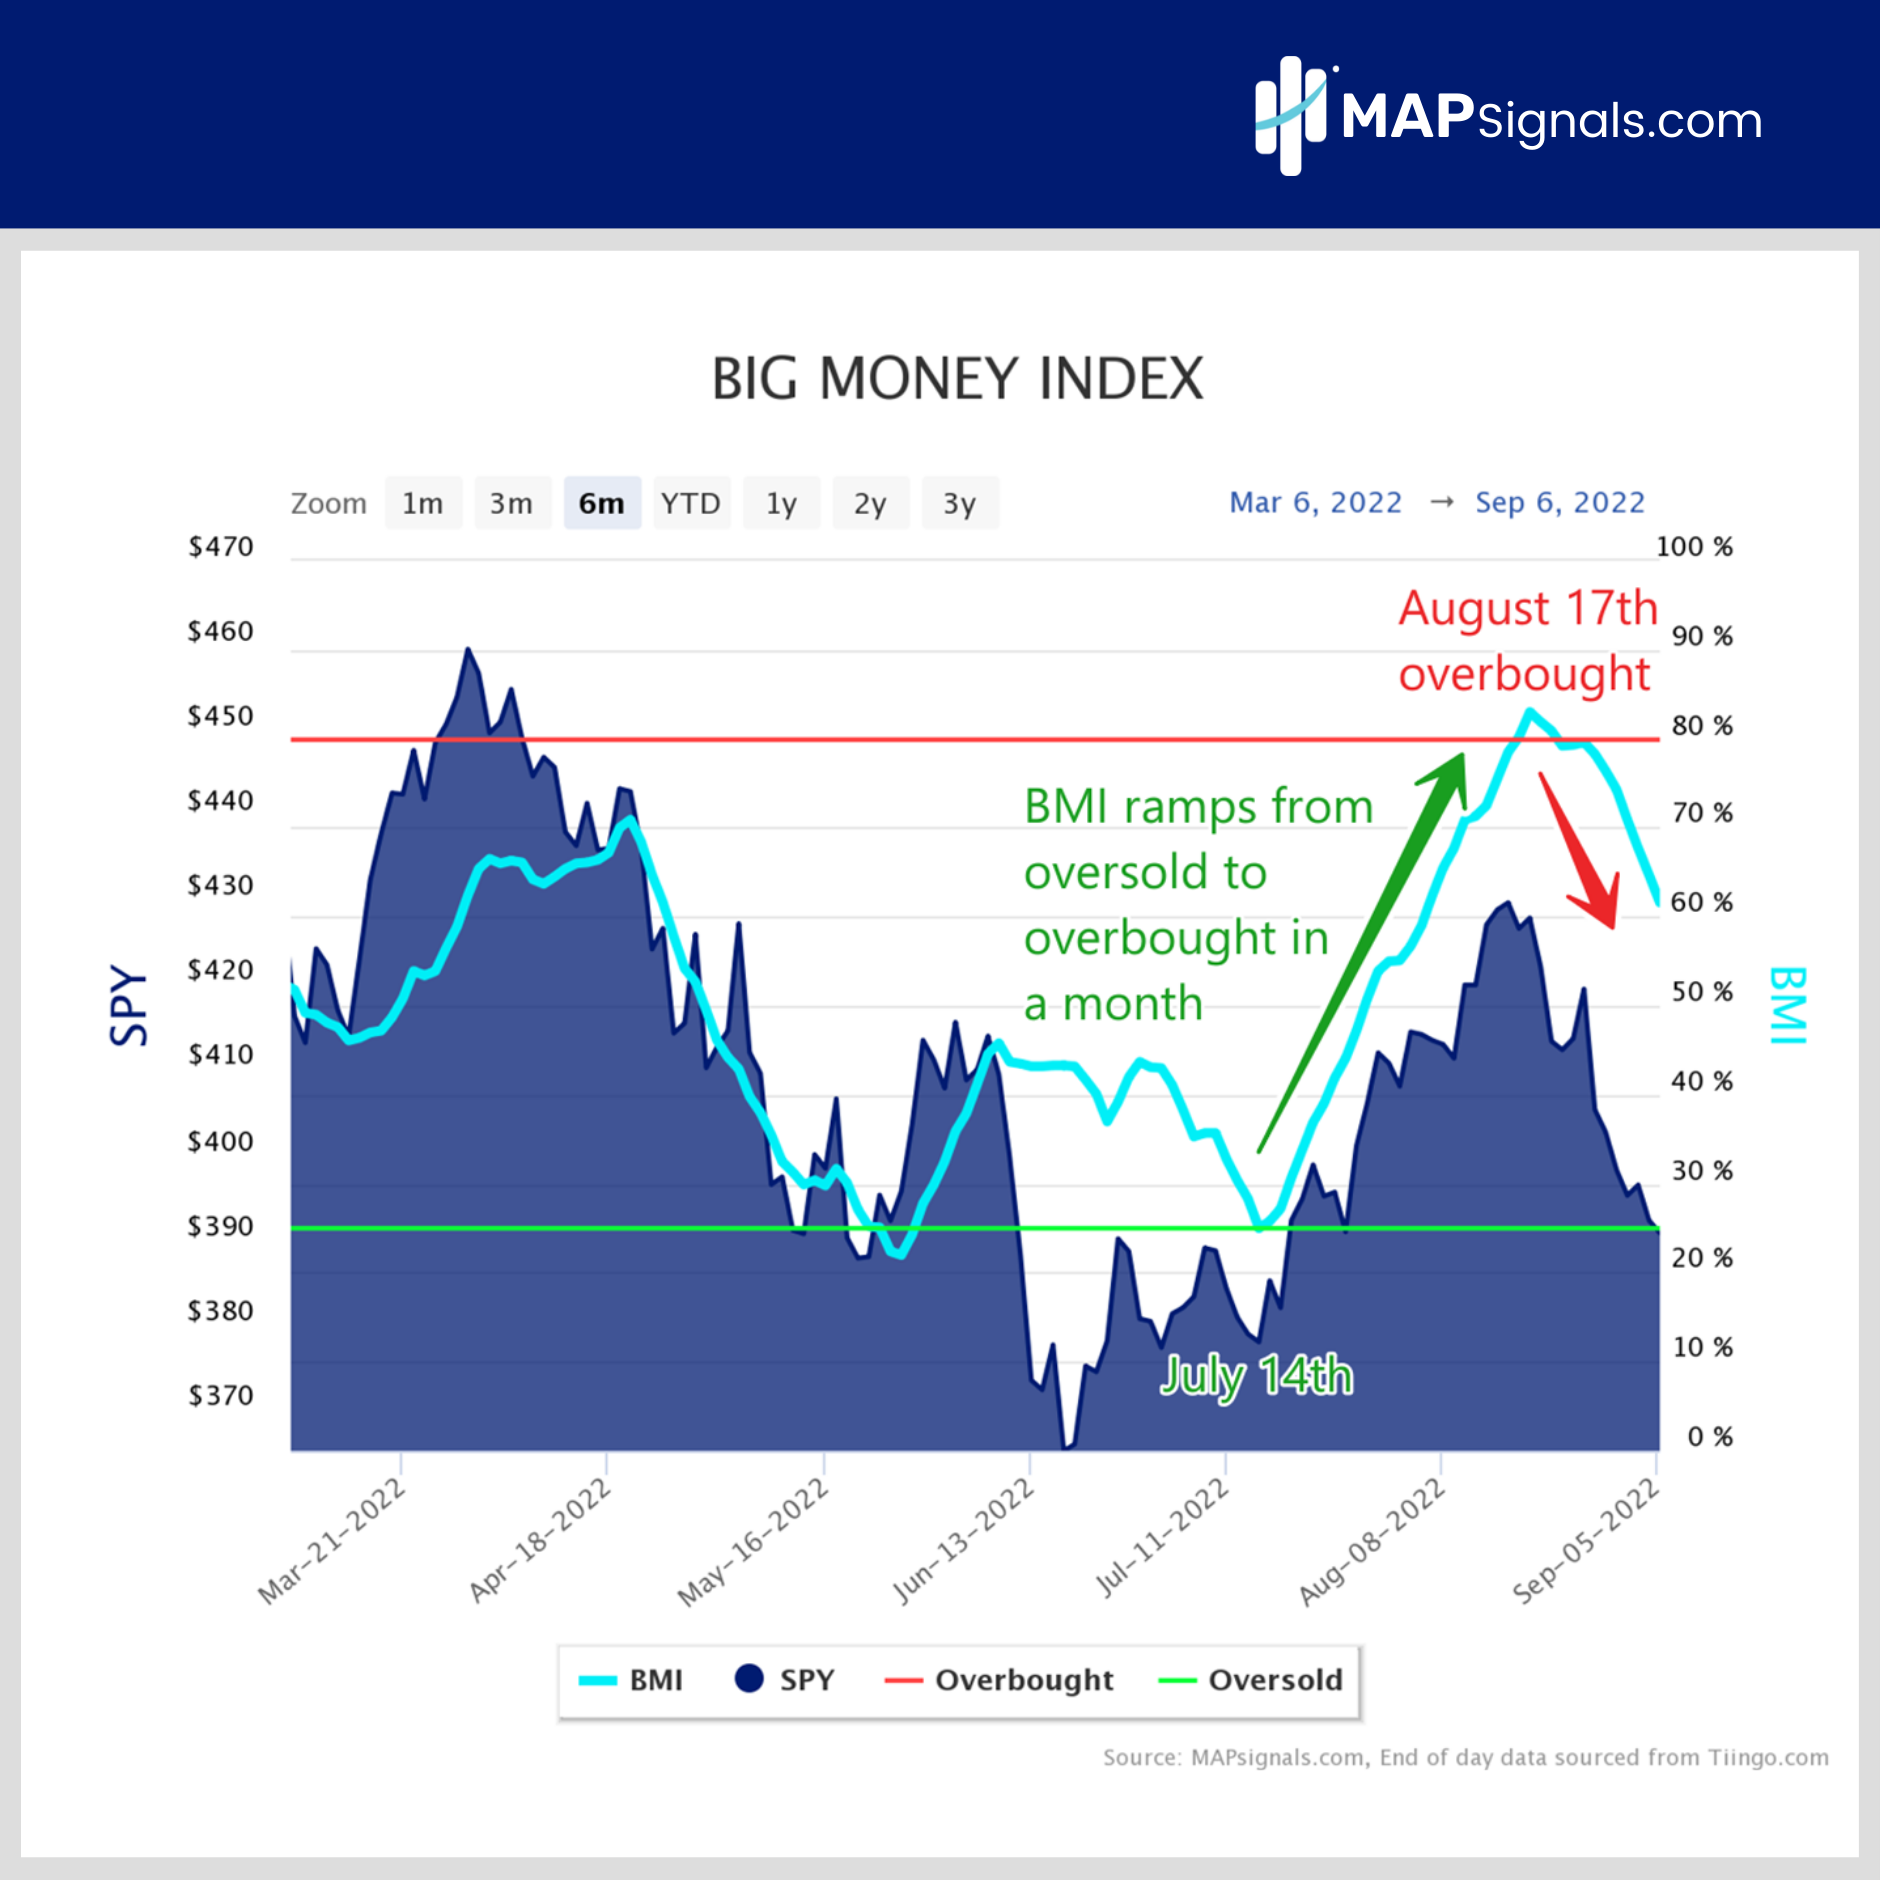
Over the past few months, our Big Money Index has helped guide us through a tough market terrain. Since mid-July, we’ve waded through 2 extremes: an oversold and overbought market.
From July 14th to August 17th, the wave of buying was intense. We didn’t stay in the red zone for long. Those inflows reversed in epic fashion as sellers took the helm. Below you’ll see how lockstep the BMI has been with market pivot points:
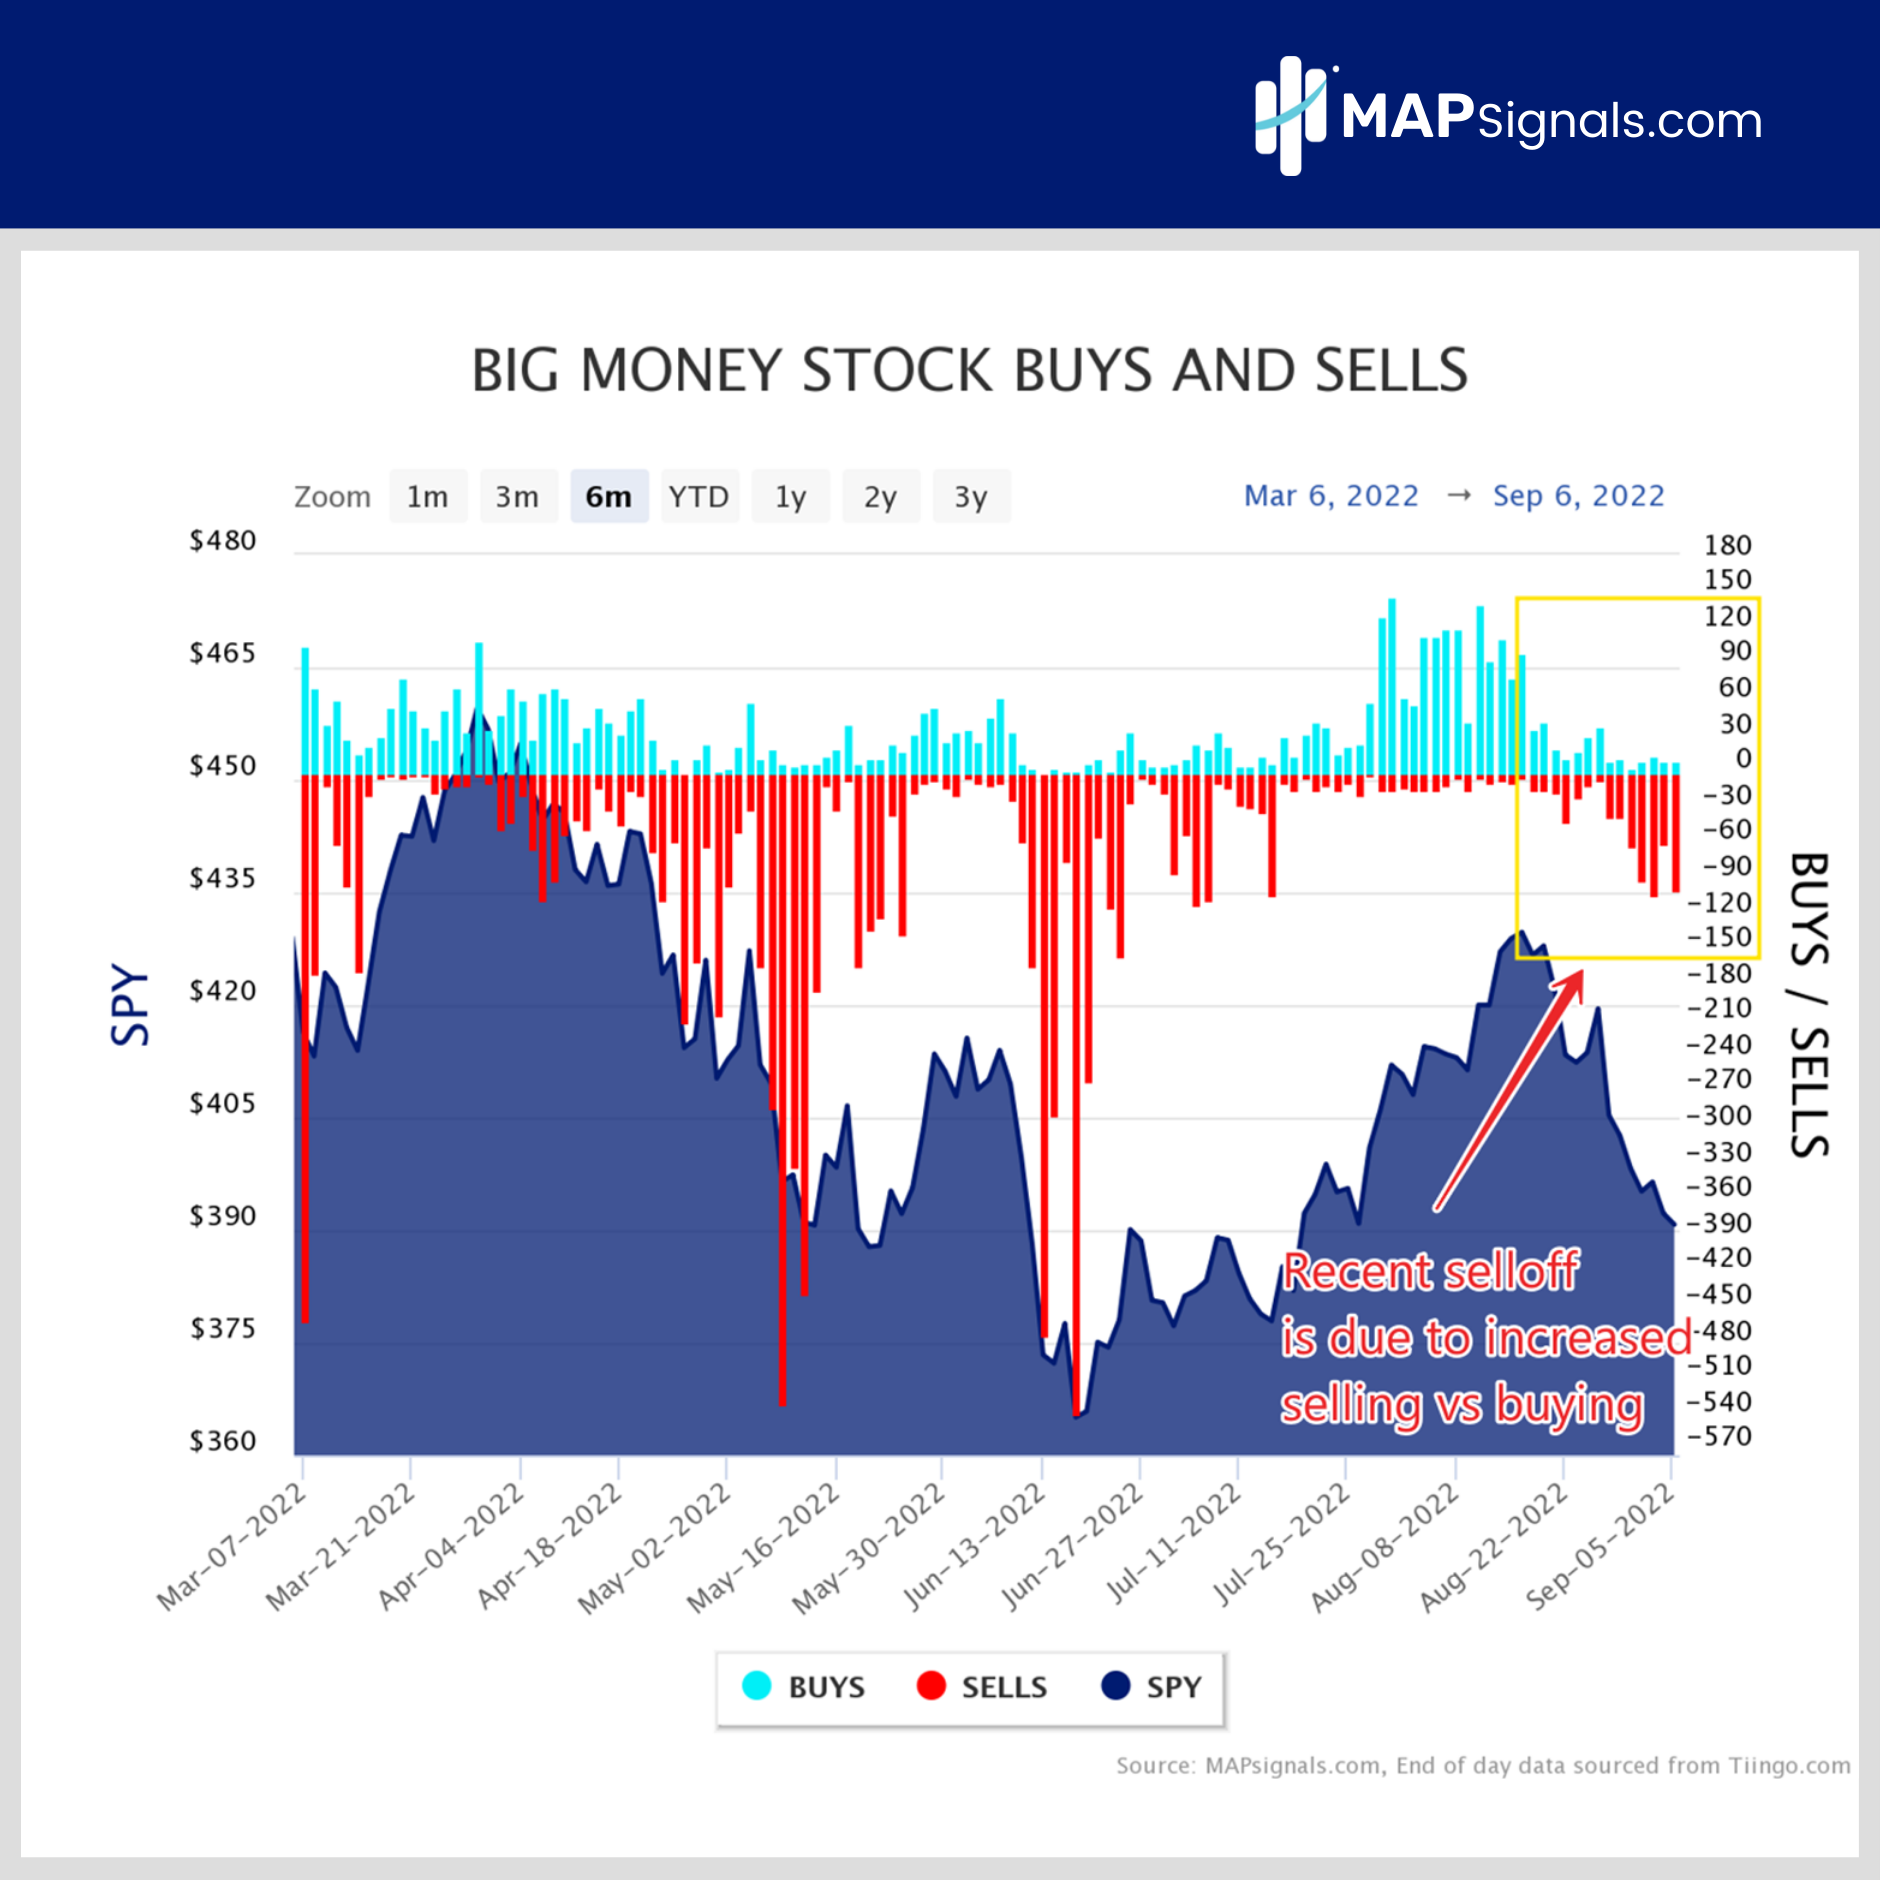
And when you dive a bit deeper, you can see the cause of the recent pullback has been the vanishing of buyers.
Our Big Money Stock Buys and Sells chart shows this clearly. The yellow block below references the period since the BMI triggered overbought. Sellers quickly took control. When red bars increase, supply overwhelms demand and stocks fall:
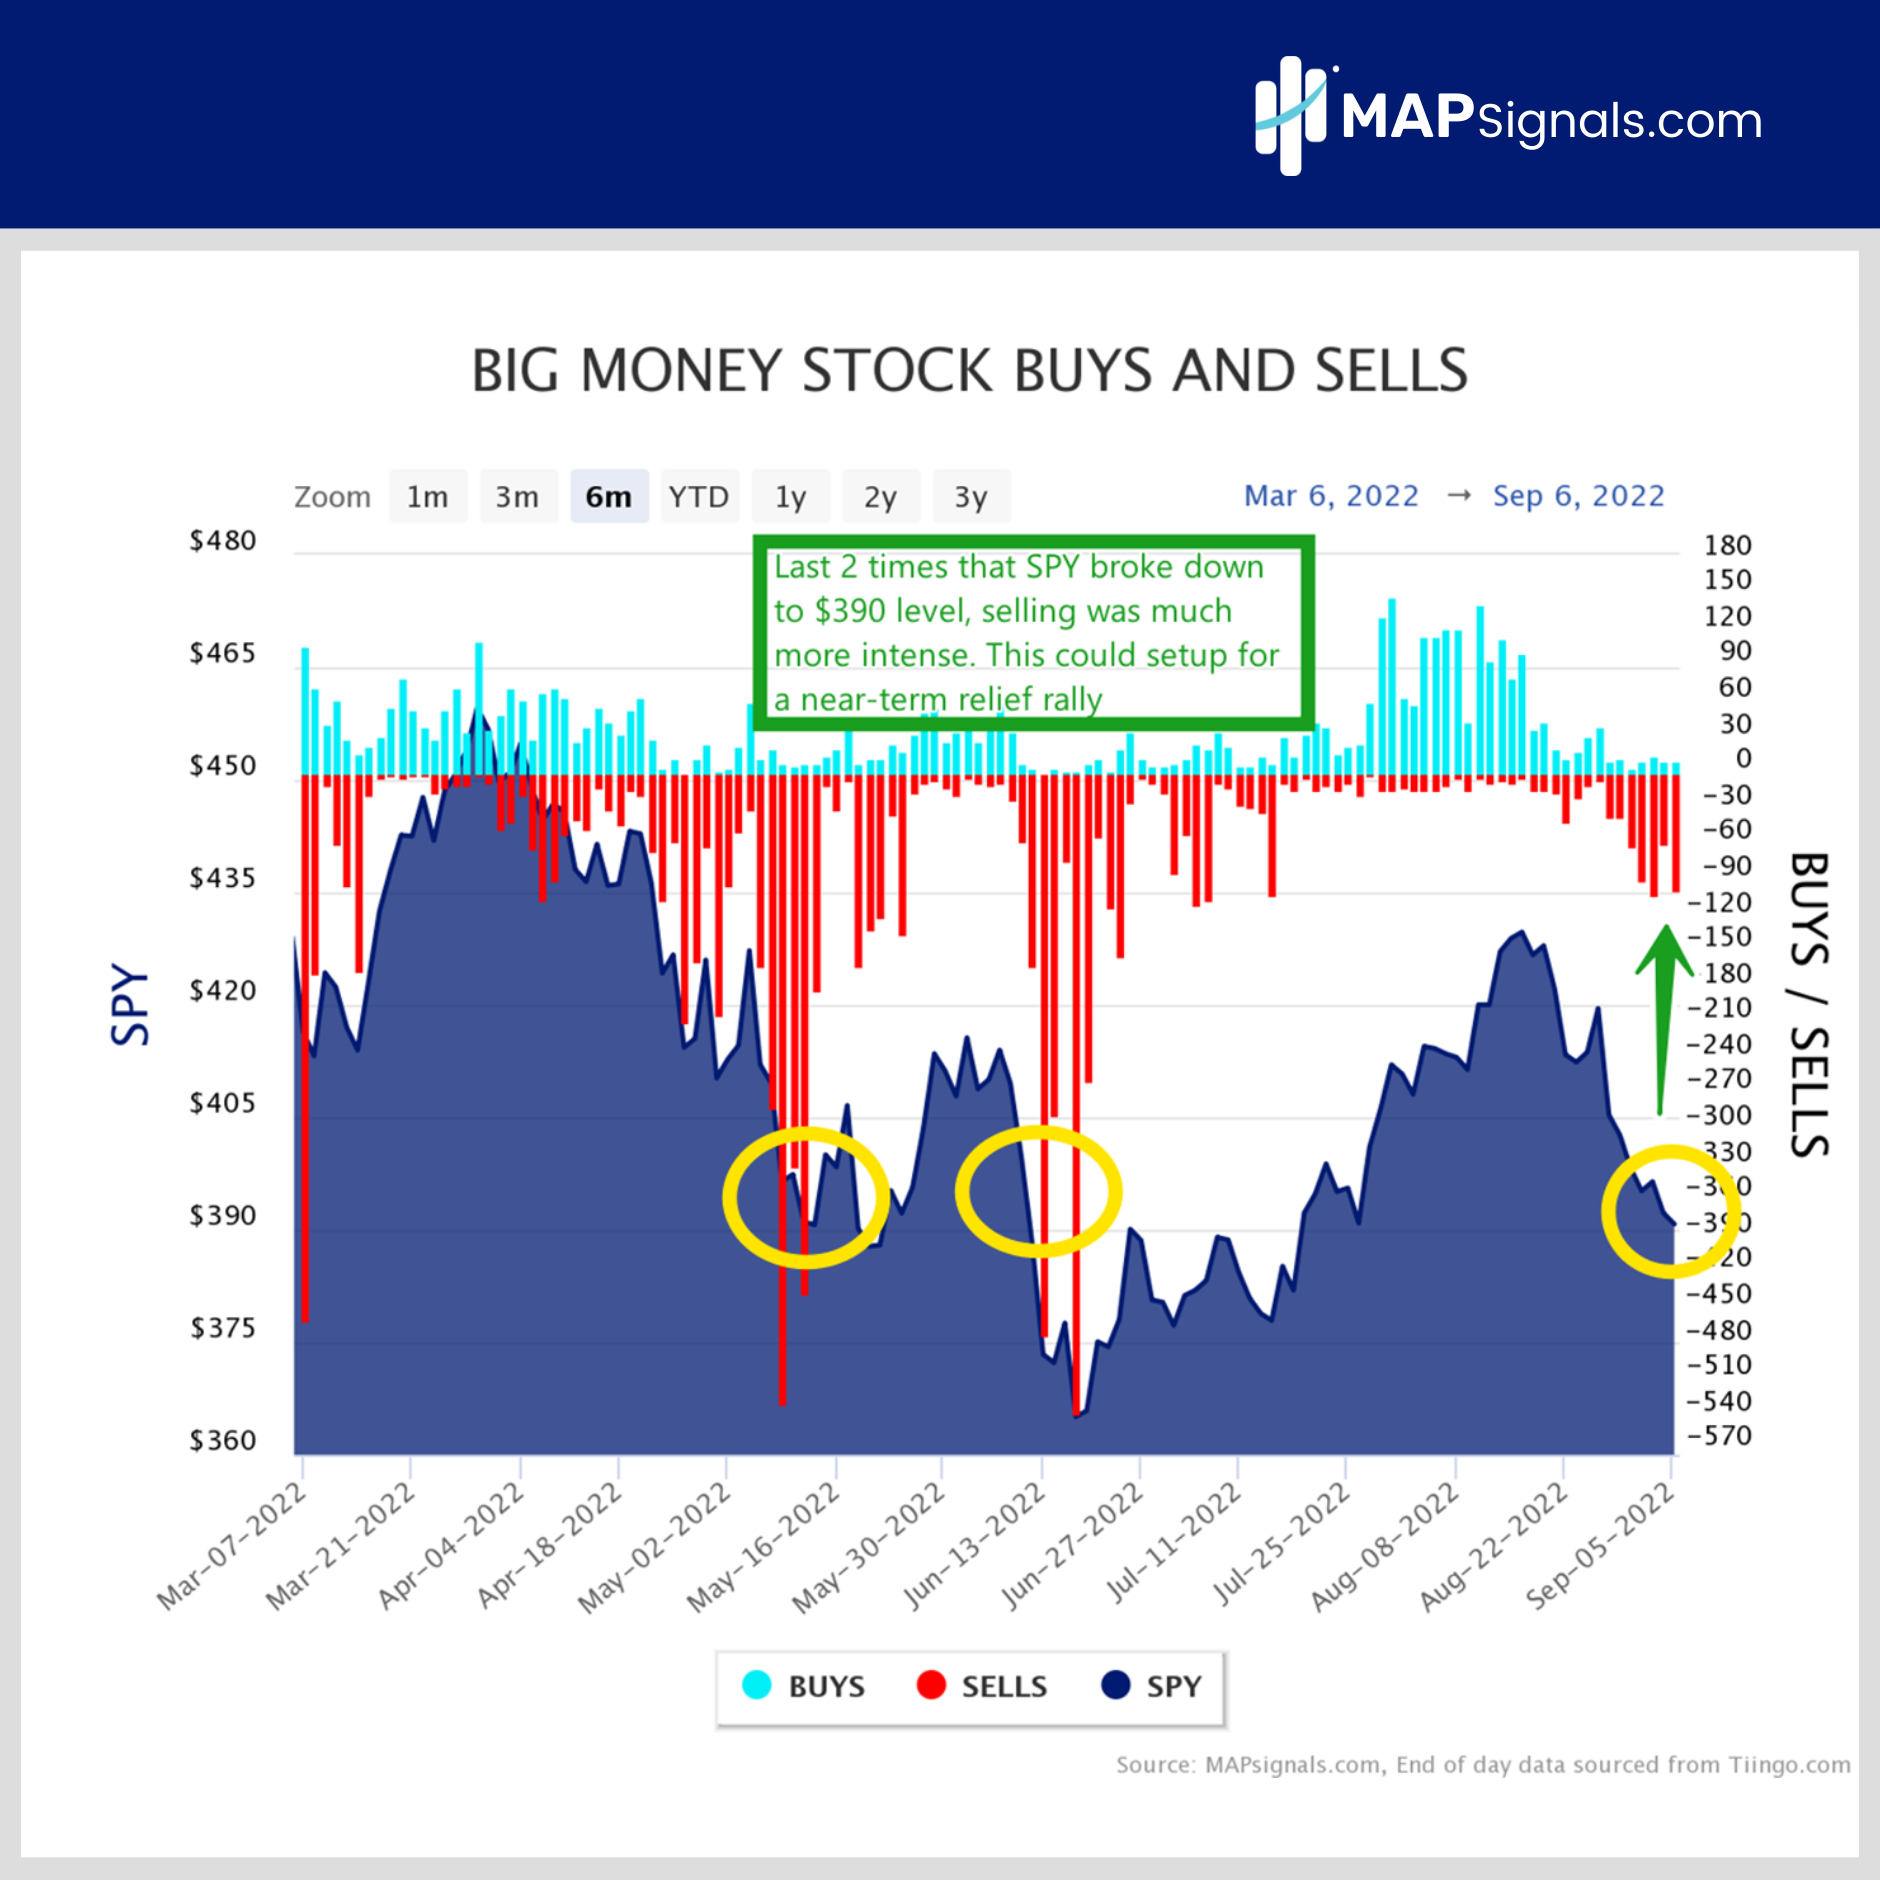
There’s something else about this chart that I want to draw your attention to. Tuesday’s closing low of ~$390 on the SPY (S&P 500 tracking ETF) has been visited twice before on the downside this year. Let’s compare our data now to those periods.
Below is the same chart as above except I’ve circled 3 dates. Off to the right is Tuesday’s pullback to the $390 level on SPY. The 2 other circles reference May 11th and June 10th – periods when SPY fell to nearly $390.
All things being equal, you’d expect the data to appear similar. But today’s selloff is quite different. Notice how much deeper the red bars are for May and June’s pullback.
May 11th saw 438 stocks get sold while June 10th saw 162. Tuesday only saw 99 stocks pressed hard on the downside. That points to less appetite on the sell-side, which can make way for buyers in the coming weeks.
My bet is, at these levels, weakness is a buying opportunity:
And this narrative supports my view that weakness in September, will lead to a stronger Q4.
As a reminder, in the midterm election year study, there’s a strong seasonal pattern where big investors dump stocks in September, only to bid them up in October and November.
Going back to 1990, midterm years see stocks fall -.3% on average in September but boast 2.5% gains in October and 2.4% gains in November. You can reference the study here.
Let me be clear, this recent data isn’t the all-clear signal. It simply hints at better days in the coming weeks.
Let’s wrap up.
Here’s the bottom line: September is always a time to be cautious. But keep in mind the doldrums eventually fade.
Markets have fallen hard recently, however our data is pointing to less aggressive selling now compared to prior similar pullbacks.
Use moments like now to add to high-quality stocks, with strong cashflows. Those are the ones that are going to bounce the highest once the real buyers step in. Weakness is a buying opportunity.
MAPsignals is all about finding the best stocks and we automate our top ranked stocks list every day, here, for Platinum subscribers. There are leaders out there and the Big Money process spots them.
If you’re wanting access to which stocks rank the best by sector, get started with a subscription today!